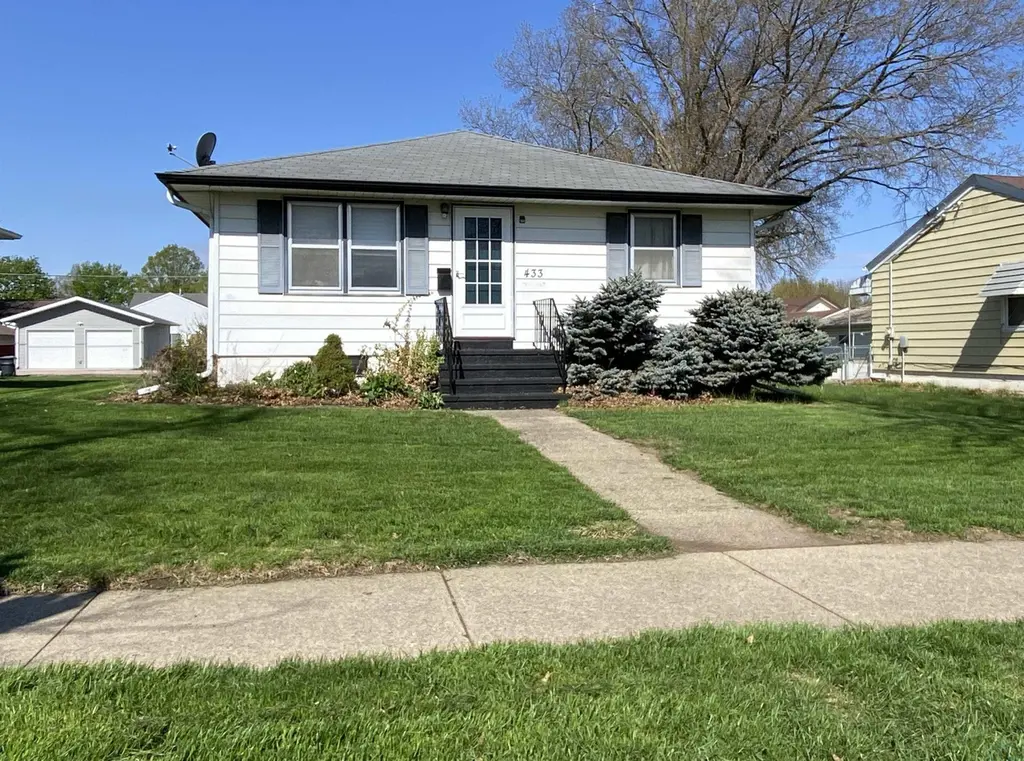
433 2nd Ave Ave NE · Le Mars, IA
Flood risk 1/10 · Minimal
- FEMA flood zone
- X (unshaded)
- Chance of flooding over 30 yrs
- 0.0%
- Est. flood insurance / yr
- $473 – $860
Fire risk 1/10 · Minimal
- Est. fire insurance / yr
- $902 – $1,676
Heat risk 3/10 · Minor
- Hot days now (above 103°F)
- 7 days/yr
- Hot days in 30 yrs
- 15 days/yr
Wind risk 2/10 · Minimal
- Chance of severe wind over 30 yrs
- —
Air-quality risk 2/10 · Minimal
- Unhealthy air days now
- 1 days/yr
- Unhealthy air days in 30 yrs
- 1 days/yr
Risk factors via First Street. Map © Google.
Why this score? — see what drove the D grade
The composite is a weighted blend of 9 inputs, each scored 0–100. Each bar is that input's sub-score; the figure is the points it added to the 100-point composite (weight × sub-score).
- Cash flow +13.1/30.0
- ARV discount +8.7/15.0
- Schools +6.2/10.0
- Livability +4.1/5.0
- DSCR +3.9/10.0
- 1% rule +3.2/10.0
- Rent growth +2.5/5.0
- Condition / age +2.5/5.0
- Appreciation +0.0/10.0
$209,000
🖨 Deal sheet (PDF) 📄 Offer letter ✓ Due diligence
Listing remarks
Step into this classic ranch style home offering 3 main floor bedrooms, 2 bath locations, a detached 2 car garage, and a partially finished full basement that’s ready for your future ideas. Enjoy a spacious living room, eat in kitchen, main floor laundry, and a rear deck perfect for enjoying the outdoors. Conveniently located near downtown Le Mars and O’Toole Park, this property also features alley access to the generous sized garage. Loved by the same owner since the 1960s, this rare find is part of an Estate sale and is being sold as is. Recent updates include HVAC (2023) & water heater (2022), with MidAmerican Energy reporting a 24-month average of $140/mo. Don’t
Key facts
- Recent updates
- Eat in kitchen
- Main floor laundry
Tags
Property features AI
Exterior
- Parking: Detached garage with concrete driveway and garage door opener (2 car spaces)
- Utilities: Public water; Public sewer
- Home design: Single-family residence; Residential property
- Construction: Vinyl siding; Shingle roof; Below-grade finished area
- Exterior features: Deck; Level, landscaped lot with a few trees
Interior
- Kitchen: Eat-in kitchen
- Bathrooms: One full bathroom; One three-quarter bathroom
- Heating & cooling: Central air conditioning; Natural gas forced-air heating
- Interior features: Eat-in kitchen; Master suite on the main level; Full basement, partially finished
- Laundry & utility: Main level laundry
Neighborhood map
What this means for you Summary
Snapshot
- This is a 3-bed/2.0-bath single-family listed at $209k.
Deal economics
- At list price, monthly cash flow is $-6 ($-69/yr) — negative.
- To cash-flow at today's rent, offer at most $208k (0.5% below list).
- To meet the 1% rule (rent ≥ 1% of price), the offer needs to be $171k (18.0% below list).
- Recommended offer: $171k (18.0% below list) — sets the bar for 1% rule.
- Cap rate 6.3% vs local median 2.7% in Le Mars — top-decile yield for the area; either an underpriced asset or a hidden risk that comps aren't pricing in. Stress-test before assuming the spread holds.
Location & tenants
- Location reads 82/100 on livability (#48 in IA, #1,235 nationally) — a professional / high-income tenant draw. Strengths: crime A+, cost of living A+, housing A+; Watch: amenities F, commute F.
- Le Mars Community School District (town): math 73% / reading 72% proficiency, ranked #96 of 289 in IA (top 33%) — strong family-tenant draw, lease renewals of 3-5y typical.
- Zoned schools: Kluckhohn Elementary School (math 76% / reading 76%, grade A, #123 of 616 statewide, top 20%, 439 students, 35% FRL); Le Mars Middle School (math 71% / reading 71%, grade A, #110 of 246 statewide, top 44%, 488 students, 38% FRL); Le Mars High School (math 73% / reading 75%, grade B+, #103 of 336 statewide, top 32%, 675 students, 30% FRL).
- Market conditions: 59 active listings in the ZIP; 1 comparable units currently listed for rent nearby; 147 units permitted in Plymouth County in 2024 (112 in 5+ unit buildings).
Forward outlook
- Local home prices are declining (-3.0%/yr); year-one equity from $1k of loan paydown is wiped out by about $6k of value loss. Plan a longer hold.
Negotiation context
- Only 5 days on market — expect competitive offers; lowballing is unlikely to land.
Risks & watch-outs
- Watch-outs: built in 1952 — expect roof / HVAC / electrical / plumbing capex.
Questions for the listing agent
- What do current leases actually rent for vs. the listed asking? Can we see a recent rent roll and the last 12 months of T-12 income?
- Built in 1952 — when were the roof, HVAC, electrical panel, plumbing, and water heater last replaced?
- Is there a deadline driving the sale (1031 exchange, divorce, estate, relocation)? That informs how much negotiation room exists.
- Schools are A-rated — typically a magnet for longer-tenancy family renters. What's the average tenant stay here, and is there a school-zone premium baked into asking?
- The area grade is low — what's the realistic commute time and amenity access for the typical tenant pool here? Any planned neighborhood developments (good or bad) we should know about?
- What's the average days-on-market for RENTAL listings here right now (not sales)? A rising rental-DOM trend means longer vacancies and softer asking-rent achievability than the comps imply.
- What's the recent tenant-quality profile in this submarket — average credit score on applications, eviction rate, late-payment / NSF rate, and stable-employment percentage? A property-management company in the area should have these aggregated.
- How much new for-sale + rental construction is in the pipeline within 1–3 miles? Heavy new supply typically softens prices + rents 12–24 months out; constrained supply supports both.
Investment metrics
- 1% rule
- 0.82% ✗
- Cap rate
- 6.26%
- Cash-on-cash
- -0.12%
- DSCR
- 0.99
- GRM
- 10.2
CMA / ARV
- ARV (on-the-fly)
- $214,776
- Comps found
- 4
Show comp detail 4 sales within ~0.75 mi
| Address | Dist | Beds/Ba | Sqft | Sold | Price | $/sf | Match |
|---|---|---|---|---|---|---|---|
| 120 SE 5th Ave | 0.60mi | 3/2.0 | 1,299 (+3%) | 7mo | $194,500 | $150 | 60 |
| 211 6th St. St NE | 0.12mi | 3/1.5 | 1,424 (+13%) | 18mo | $244,000 | $171 | 55 |
| 418 3rd St. St NW | 0.48mi | 2/1.5 (-1) | 1,086 (-14%) | 6mo | $200,000 | $184 | 43 |
| 309 Central Ave Ave SW | 0.71mi | 3/2.0 | 1,376 (+10%) | 11mo | $210,000 | $153 | 42 |
Match score weights: distance 35% · size 25% · config 20% · recency 20%. Top-matched comps best support the ARV.
Projected returns pro-forma
-3.0% appreciation · 3.0% rent growth · sell at horizon
- IRR
- -16.5%
- Equity multiple
- 0.41×
- Total profit
- $-34,257
- Equity at exit
- $31,163
- IRR
- -8.3%
- Equity multiple
- 0.48×
- Total profit
- $-30,404
- Equity at exit
- $18,071
Cash invested: $58,520 (down + closing). Projections, not guarantees.
Landlord ↔ Tenant lean methodology
- Overall (STATE)
- 83 Strongly Landlord-Friendly
- State Iowa
- 83 Strongly Landlord-Friendly · R+6
- County
- — inherits STATE
- City
- — inherits STATE
ZIP-level market 51031
- Home prices YoY
- -22.2%
- Active inventory
- 59
- Price-to-rent
- 10.2×
Monthly cashflow live
- Estimated rent
- $1,714 medium interval (Pro) →
- Mortgage (P&I)
- −$1,096
- Tax from tax record
- −$177 /mo · $2,120/yr
- Insurance
- −$87
- HOA
- −$0
- Vacancy / Maint / Mgmt
- −$360
- Net cashflow
- $-6
Break-even live
Sensitivity live
| Price | -10% $113 | -5% $53 | +0% $-6 | +5% $-65 | +10% $-124 |
|---|---|---|---|---|---|
| Rent | -10% $-141 | -5% $-73 | +0% $-6 | +5% $62 | +10% $130 |
| Rate | -1.0pp $100 | -0.5pp $47 | base $-6 | +0.5pp $-60 | +1.0pp $-115 |
UW: 25.0% down · 7.5% · 30yr · 1.5% tax · 5.0% vac · 8.0% maint · 8.0% mgmt
Financing live
Cash to close
- Down payment
- $52,250
- Closing costs
- $6,270
- Reserves months
- —
- Total cash needed
- —
Loan-product check · same deal, 3 products live
Conventional
25% down · 7.5% · 30yr
- Down + closing
- —
- Monthly P&I
- —
- Monthly cashflow
- —
- DSCR
- —
- Eligible?
- —
Personal DTI + credit; lowest rate.
DSCR
20% down · 8.5% · 30yr
- Down + closing
- —
- Monthly P&I
- —
- Monthly cashflow
- —
- DSCR
- —
- Eligible?
- —
No personal income docs; deal must DSCR.
Hard money
10% down · 12.0% · 12mo
- Down + closing
- —
- Monthly P&I
- —
- Monthly cashflow
- —
- DSCR
- —
- Eligible?
- —
Short-term bridge; refi at stabilization.
Rent comps 1 comps
| Address | Beds | Baths | Sqft | Rent | $/sqft | DOM | Units | Dist |
|---|---|---|---|---|---|---|---|---|
| 427 4th St NW Le Mars, IA | 1.0–2.0 | 1.0–2.0 | 1011 | $1,714 | $1.70 | 45d | 32 | 0.47mi |
Listing history 2 events
-
2026-05-13status Pending
-
2026-05-08$209,000 Active
ⓘ Source: listings_history table (triggers on properties + properties_extension) + one-shot
backfill from property_details.listing_events for pre-trigger history.
Tax reassessment forecast IA · Partial reset (capped growth)
- Current annual tax
- $2,120 · $177/mo
- Projected year-2 tax
- $2,701 · $225/mo
- Expected delta
- +$581/yr (+$48/mo · 27.4%)
ⓘ Screening estimate from a state-policy table — verify with the county assessor before closing.
Climate risk First Street
- Flood 1/10 Low FEMA zone X (unshaded) · 0% chance over 30 yrs
- Wildfire 1/10 Low
- Heat 3/10 Moderate 7 d/yr ≥103°F today · 15 d/yr by 30 yrs out
- Wind 2/10 Low
- Air quality 2/10 Low 1 unhealthy d/yr today · 1 by 30 yrs out
Nearby sold comps map
Loading sold comps map…
Walkable amenities ~0.75 mi
Loading nearby amenities…
Taxation est. · year 1
- Rental income
- $20,568
- − Mortgage interest
- −$11,707
- − Property taxes
- −$2,120
- − Insurance
- −$1,045
- − Repairs & maintenance
- −$1,645
- − Management
- −$1,645
- − Depreciation
- −$6,080
- Taxable loss
- −$3,675
- Est. tax savings @ 24.0%
- +$882
- After-tax cash flow
- $814/yr
For passive investors: Depreciation is non-cash, so a rental often shows a tax loss while cash-flowing — sheltering income. Rental losses are passive: they offset passive income freely, and up to $25,000/yr can offset ordinary (W-2) income if you actively participate and your MAGI is under $100k (phasing out to $0 by $150k); unused losses carry forward. On sale, claimed depreciation is recaptured at up to 25%, and gains may owe capital-gains tax (a 1031 exchange can defer both). Figures are a year-1 estimate at your 24.0% rate — not tax advice; consult a CPA.
Schools (NCES district)
- District
- Le Mars Community School District
- NCES district ID
- 1916530
- Math proficiency
- 73% ▼ -5.00%
- Reading proficiency
- 72% ▼ -1.00%
- Median HH income
- $55,414
- Composite
- 61.97/100
- National rank
- #723
- State rank
- #96 of 289 in IA
Livability — Le Mars
- Score
- 82/100
- State rank
- #48
- US rank
- #1235
Category grades
Schools grade is shown separately in the Schools card above.
Census & demographics
- Census place
- Le Mars, IA
- Population (ZIP)
- 12,785
Population outlook (Plymouth County) Hauer SSP2
- Today (2025)
- 25,214 people
- By 2030
- 25,257 · +0.2%
- By 2040
- 25,304 · +0.4%
- By 2050
- 25,421 · +0.8%
- By 2075
- 26,820 · +6.4%
- By 2100
- 27,604 · +9.5%
Race, ethnicity, and origin ACS 2023
- Neighborhood character
- Predominantly White (85%)
- Race & ethnicity
- White 85% Hispanic / Latino 9% Black 4% Two or more races 4%
- Hispanic origin (detail)
- Mexican 6%
- Common ancestry
- Iranian 6% Portuguese 3% Ukrainian 2%
- Foreign-born
- 6% · Canada
- Languages at home
- 88% English-only · Spanish 7% German/W. Germanic 1%
Political lean MEDSL · Plymouth
- 2024 margin
- Solid R (+54.2) · D 22.3% · R 76.5% · Other 1.2%
- 2008→2024 swing
- -29.2pp toward R · 2008: -25.1pp · 2024: -54.2pp
- All cycles
- 2024: R+54.2 2020: R+49.3 2016: R+51.9 2012: R+34.3 2008: R+25.1
Not yet ingested
- Civics
- —
Market trends
- HPI YoY
- ▼ -81.02%
- Current HPI
- 283.6093
- Rent YoY
- —
- Metro
- —
- State GDP YoY
- ▲ 2.48%
- F500 in state
- 4
Industry mix (Fortune 500 HQ in IA)
| Industry | F500 HQs | Revenue |
|---|---|---|
| Financial Services | 1 | $16B |
|
||
| Retail / Convenience | 1 | $15B |
|
||
Price history
2 events — show timeline
- 2026-05-13 Pending — NWIA
- 2026-05-08 Listed $209,000 NWIA
Property tax history
+2.9%/yrLatest (2025): $2,120 · +4.7% YoY. Source: county tax records.
Cash-flow waterfall
monthlySold comps — $/sqft
last 12 mo · ≤1 miLoading sold comps…