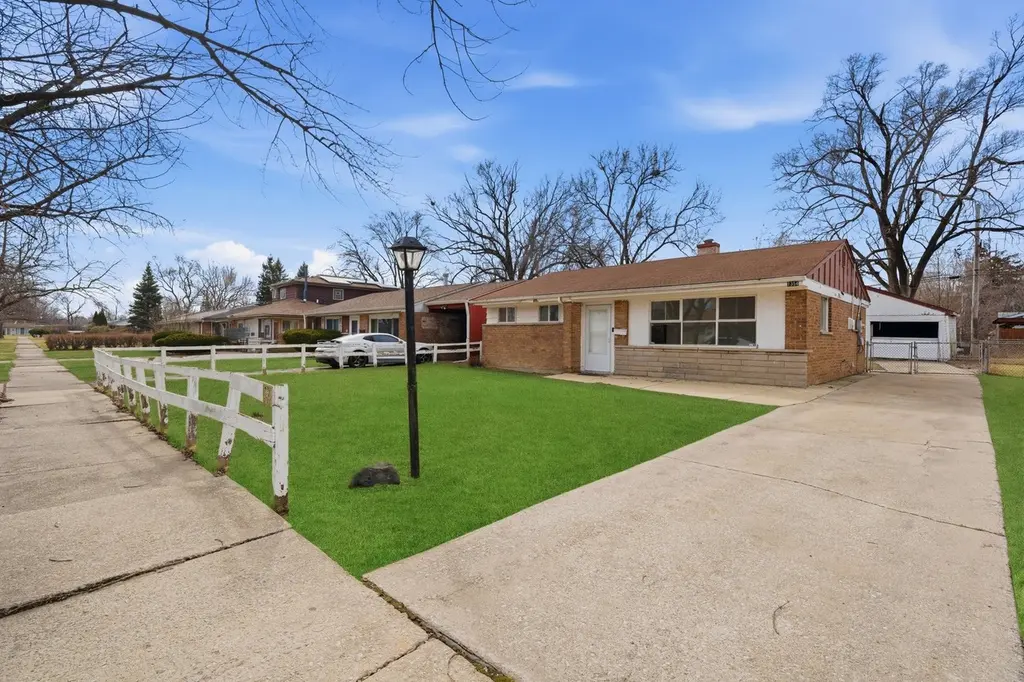
1354 Gordon Ave · Calumet City, IL
Flood risk 5/10 · Moderate
- FEMA flood zone
- X (shaded)
- Chance of flooding over 30 yrs
- 0.24%
- Est. flood insurance / yr
- $473 – $860
Fire risk 1/10 · Minimal
- Est. fire insurance / yr
- $804 – $1,492
Heat risk 3/10 · Minor
- Hot days now (above 102°F)
- 7 days/yr
- Hot days in 30 yrs
- 15 days/yr
Wind risk 2/10 · Minimal
- Chance of severe wind over 30 yrs
- —
Air-quality risk 4/10 · Minor
- Unhealthy air days now
- 5 days/yr
- Unhealthy air days in 30 yrs
- 6 days/yr
Risk factors via First Street. Map © Google.
Why this score? — see what drove the C+ grade
The composite is a weighted blend of 9 inputs, each scored 0–100. Each bar is that input's sub-score; the figure is the points it added to the 100-point composite (weight × sub-score).
- Cash flow +26.0/30.0
- ARV discount +11.6/15.0
- DSCR +8.7/10.0
- 1% rule +6.9/10.0
- Rent growth +4.0/5.0
- Livability +3.6/5.0
- Condition / age +2.5/5.0
- Schools +1.0/10.0
- Appreciation +0.0/10.0
$134,999
🖨 Deal sheet 📄 Offer letter ✓ Due diligence
Listing remarks
Freshly updated ranch in Calumet City is a sharp buy for first-time buyers, downsizers, and investors looking for a clean, turnkey property at an accessible price point. Inside, brand new luxury vinyl flooring, fresh paint, updated light fixtures, and new laminate countertops give the home a crisp, move-in ready feel throughout. The oversized backyard with a spacious deck is a genuine highlight, with plenty of room to entertain, garden, or simply enjoy the outdoors. Minutes from major expressways, easy access into Chicago, and a short drive to the Indiana border for shopping, dining, and entertainment. Everyday conveniences are close by. Schedule your showing today.
Key facts
- Spacious deck
- Oversized backyard
- 6,200 sq ft lot
Tags
Property features AI
Finance
- Other: Ownership: Fee simple; Property not currently leased; Possession at closing; Parcel number available
- HOA & community: No master association fee required
Exterior
- Parking: Detached owned garage (2 garage spaces, 2 total parking spaces)
- Utilities: Water source: Lake Michigan; Public sewer
- Home design: Detached single-family home; One-story; Accessible / disability access equipped; Built approximately 71–80 years ago; Estimated living area
- Construction: Brick construction; Asphalt roof; Concrete perimeter foundation; Property built before 1978
- Exterior features: Deck; Porch
Interior
- Kitchen: Galley-style kitchen (9 x 13) with luxury vinyl flooring
- Bedrooms: Master bedroom on main level (12 x 14) with luxury vinyl flooring; Second bedroom on main level (12 x 12) with luxury vinyl flooring; Additional bedrooms listed (no level or dimensions provided)
- Flooring: Luxury vinyl flooring in main living areas and bedrooms; Vinyl flooring in family room
- Bathrooms: One full bathroom
- Heating & cooling: Natural gas heating; Central air conditioning
- Interior features: Five total rooms; CO detectors; Ceiling fans
- Laundry & utility: Dedicated laundry room
Neighborhood map
What this means for you Summary
Snapshot
- This is a 3-bed/1.0-bath single-family listed at $135k.
Deal economics
- At list price, monthly cash flow is $336 ($4k/yr) — positive.
- The deal already cash-flows at list — no discount required.
- Meets the 1% rule at list price ($2k rent vs $135k).
- Recommended offer: $131k (3.0% below list) — sets the bar for market timing.
Location & tenants
- Location reads 71/100 on livability (#330 in IL) — a middle-class / working-renter tenant base. Strengths: commute A+, cost of living A+, housing A+; Watch: employment C-, schools F, crime D-.
- Thornton Fractional Twp Hsd 215 (suburban): math 9% / reading 13% proficiency, ranked #563 of 620 in IL (top 91%) — low school quality limits family demand, transient renter base, plan for 1-2y turnover.
- Market conditions: Rents rising fast (+6.2%/yr); 198 active listings in the ZIP; 11 comparable units currently listed for rent nearby; rentals at typical pace (median 21d on market — plan ~3-4 weeks tenant-placement turnaround); 6,272 units permitted in Cook County in 2024 (4,658 in 5+ unit buildings).
- This rent runs 35% of the median local income ($55k/yr) — at the standard rent-burdened threshold; future hikes will face affordability resistance.
Forward outlook
- Local home prices are declining (-3.0%/yr); year-one equity from $933 of loan paydown is wiped out by about $4k of value loss. Plan a longer hold.
- At projected returns (-3.0% appreciation + 6.2% rent growth), your $38k cash investment doubles in ~8 years — after that, you're playing with house money.
Negotiation context
- It's been on market 58 days — a 3% lower offer ($131k) is reasonable based on typical stale-listing flexibility.
- 4 sale attempts since 19y ago with the ask held roughly flat each time — persistent listings suggest the price (not the market) is what's stuck; bring a comps-based counter.
- Current owner paid $92k; 47% above their basis — modest negotiation headroom, anchor on the comps not their cost.
Risks & watch-outs
- Watch-outs: built in 1954 — expect roof / HVAC / electrical / plumbing capex.
- Climate carrying-cost: moderate flood risk — expect insurance premiums to compound above CPI over the hold.
Questions for the listing agent
- It's been on market 58 days. Have you received any prior offers? Is the seller open to a 3% concession, seller financing, or rate buy-down credit?
- Built in 1954 — when were the roof, HVAC, electrical panel, plumbing, and water heater last replaced?
- Is there a deadline driving the sale (1031 exchange, divorce, estate, relocation)? That informs how much negotiation room exists.
- Schools are F-rated, which usually means shorter tenancies and higher turnover. Who's the typical renter profile here, and what's been the actual vacancy rate?
- Crime grade is D in this area — have there been break-ins, vandalism, or insurance claims at this property in the last 3 years? What carrier currently insures it and at what premium?
- What's the average days-on-market for RENTAL listings here right now (not sales)? A rising rental-DOM trend means longer vacancies and softer asking-rent achievability than the comps imply.
- What's the recent tenant-quality profile in this submarket — average credit score on applications, eviction rate, late-payment / NSF rate, and stable-employment percentage? A property-management company in the area should have these aggregated.
- How much new for-sale + rental construction is in the pipeline within 1–3 miles? Heavy new supply typically softens prices + rents 12–24 months out; constrained supply supports both.
Investment metrics
- 1% rule
- 1.19% ✓
- Cap rate
- 9.28%
- Cash-on-cash
- 10.67%
- DSCR
- 1.47
- GRM
- 7.0
CMA / ARV
- ARV (on-the-fly)
- $148,365
- Comps found
- 12
Show comp detail 12 sales within ~0.75 mi
| Address | Dist | Beds/Ba | Sqft | Sold | Price | $/sf | Match |
|---|---|---|---|---|---|---|---|
| 1351 Gordon Ave | 0.03mi | 2/1.0 (-1) | 945 (0%) | 7mo | $140,000 | $148 | 88 |
| 1378 Hirsch Ave | 0.14mi | 2/1.0 (-1) | 945 (0%) | 9mo | $148,000 | $157 | 81 |
| 1404 Burnham Ave | 0.23mi | 2/1.0 (-1) | 945 (0%) | 7mo | $77,595 | $82 | 79 |
| 1386 Price Ave | 0.10mi | 2/1.0 (-1) | 1,000 (+6%) | 10mo | $159,000 | $159 | 72 |
| 1554 Burnham Ave | 0.53mi | 2/1.0 (-1) | 945 (0%) | 2mo | $125,000 | $132 | 69 |
| 1501 Freeland Ave | 0.38mi | 3/1.0 | 1,000 (+6%) | 9mo | $110,000 | $110 | 65 |
| 1269 Arthur St | 0.55mi | 3/1.5 | 999 (+6%) | 2mo | $168,000 | $168 | 61 |
| 1481 Lincoln Pl | 0.36mi | 3/1.5 | 1,047 (+11%) | 6mo | $85,000 | $81 | 58 |
| 19 Schrum Rd | 0.47mi | 3/1.5 | 1,062 (+12%) | 3mo | $109,000 | $103 | 54 |
| 102 163rd St | 0.45mi | 4/1.5 (+1) | 1,024 (+8%) | 10mo | $165,000 | $161 | 50 |
| 1261 Balmoral Ave | 0.62mi | 3/1.5 | 1,055 (+12%) | 2mo | $172,000 | $163 | 48 |
| 1303 Balmoral Ave | 0.61mi | 3/1.5 | 1,036 (+10%) | 9mo | $175,000 | $169 | 46 |
Match score weights: distance 35% · size 25% · config 20% · recency 20%. Top-matched comps best support the ARV.
Projected returns pro-forma
-3.0% appreciation · 6.17% rent growth · sell at horizon
- IRR
- 3.2%
- Equity multiple
- 1.13×
- Total profit
- $4,838
- Equity at exit
- $20,129
- IRR
- 15.6%
- Equity multiple
- 2.46×
- Total profit
- $55,024
- Equity at exit
- $11,672
Cash invested: $37,800 (down + closing). Projections, not guarantees.
Landlord ↔ Tenant lean methodology
- Overall (STATE)
- 43 Moderately Tenant-Leaning
- State Illinois
- 43 Moderately Tenant-Leaning · D+7
- County
- — inherits STATE
- City
- — inherits STATE
ZIP-level market 60409
- Home prices YoY
- -27.6%
- Rents YoY
- 6.2%
- Active inventory
- 198
- Price-to-rent
- 7.0×
Monthly cashflow live
- Estimated rent
- $1,606 high interval (Pro) →
- Mortgage (P&I)
- −$708
- Tax est. 1.5%
- −$169 /mo · $2,025/yr
- Insurance
- −$56
- HOA
- −$0
- Vacancy / Maint / Mgmt
- −$337
- Net cashflow
- $336
Break-even live
UW: 25.0% down · 7.5% · 30yr · 1.5% tax · 5.0% vac · 8.0% maint · 8.0% mgmt
Financing live
Cash to close
- Down payment
- $33,750
- Closing costs
- $4,050
- Reserves months
- —
- Total cash needed
- —
Loan-product check · same deal, 3 products live
Conventional
25% down · 7.5% · 30yr
- Down + closing
- —
- Monthly P&I
- —
- Monthly cashflow
- —
- DSCR
- —
- Eligible?
- —
Personal DTI + credit; lowest rate.
DSCR
20% down · 8.5% · 30yr
- Down + closing
- —
- Monthly P&I
- —
- Monthly cashflow
- —
- DSCR
- —
- Eligible?
- —
No personal income docs; deal must DSCR.
Hard money
10% down · 12.0% · 12mo
- Down + closing
- —
- Monthly P&I
- —
- Monthly cashflow
- —
- DSCR
- —
- Eligible?
- —
Short-term bridge; refi at stabilization.
Rent comps 11 comps
| Address | Beds | Baths | Sqft | Rent | $/sqft | DOM | Units | Dist |
|---|---|---|---|---|---|---|---|---|
| 1338 Wentworth Ave Unit 1338 Calumet City, IL | 2.0 | 1.0 | 800 | $1,430 | $1.79 | 24d | 1 | 0.30mi |
| 1539 Wentworth Ave Unit 3W Calumet City, IL | 3.0 | 1.0 | 1100 | $1,700 | $1.55 | 12d | 1 | 0.55mi |
| 407 Kenwood St Hammond, IN | 2.0 | 1.0 | 920 | $1,495 | $1.62 | 24d | 1 | 0.98mi |
| 407 Kenwood St Hammond, IN | 2.0 | 1.0 | 920 | $1,495 | $1.62 | 16d | 1 | 0.98mi |
| 5 Ruth St Unit 2W Hammond, IN | 2.0 | 1.0 | 900 | $1,250 | $1.39 | 12d | 1 | 1.00mi |
| 3 Ruth St Hammond, IN | 2.0 | 1.0 | 900 | $1,250 | $1.39 | 24d | 1 | 1.01mi |
| 115 157th St Unit 3 Calumet City, IL | 3.0 | 1.0 | 800 | $1,350 | $1.69 | 24d | 1 | 1.12mi |
| 3069 Bernice Rd Apt 2N Lansing, IL | 3.0 | 1.0 | 950 | $1,535 | $1.62 | 20d | 1 | 1.15mi |
| 3069 Bernice Rd Apt 2S Lansing, IL | 3.0 | 1.0 | 950 | $1,535 | $1.62 | 2d | 1 | 1.15mi |
| 3023 Bernice Rd Apt 2S Lansing, IL | 3.0 | 1.0 | 1000 | $1,600 | $1.60 | 1d | 1 | 1.17mi |
| 3649 173rd Ct Lansing, IL | 2.0 | 2.0 | 972 | $1,357 | $1.40 | 24d | 1 | 1.18mi |
Listing history 23 events
-
2026-06-18days on market $134,999 Active 58 DOM
-
2026-06-17days on market $134,999 Active 57 DOM
-
2026-06-16days on market $134,999 Active 56 DOM
-
2026-06-15days on market $134,999 Active 55 DOM
-
2026-06-13days on market $134,999 Active 53 DOM
-
2026-06-09days on market $134,999 Active 49 DOM
-
2026-06-08days on market $134,999 Active 48 DOM
-
2026-06-07days on market $134,999 Active 47 DOM
-
2026-06-04days on market $134,999 Active 44 DOM
-
2026-06-03days on market $134,999 Active 43 DOM
-
2026-06-02days on market $134,999 Active 42 DOM
-
2026-06-01days on market $134,999 Active 41 DOM
-
2026-05-31days on market $134,999 Active 40 DOM
-
2026-04-21$134,999 Active
-
2026-04-21historical
-
2026-03-01Active
-
2025-03-23historical
-
2025-02-14Active
-
2007-11-05historical
-
2007-01-22
-
2005-08-09soldstatus $92,000
-
1992-10-26soldstatus $58,000
-
1988-04-01soldstatus $46,600
ⓘ Source: listings_history table (triggers on properties + properties_extension) + one-shot
backfill from property_details.listing_events for pre-trigger history.
Climate risk First Street
- Flood 5/10 Major FEMA zone X (shaded) · 24% chance over 30 yrs
- Wildfire 1/10 Low
- Heat 3/10 Moderate 7 d/yr ≥102°F today · 15 d/yr by 30 yrs out
- Wind 2/10 Low
- Air quality 4/10 Moderate 5 unhealthy d/yr today · 6 by 30 yrs out
Nearby sold comps map
Loading sold comps map…
Walkable amenities ~0.75 mi
Loading nearby amenities…
Taxation est. · year 1
- Rental income
- $19,276
- − Mortgage interest
- −$7,562
- − Property taxes
- −$2,025
- − Insurance
- −$675
- − Repairs & maintenance
- −$1,542
- − Management
- −$1,542
- − Depreciation
- −$3,927
- Taxable income
- $2,003
- Est. tax owed @ 24.0%
- −$481
- After-tax cash flow
- $3,552/yr
For passive investors: Depreciation is non-cash, so a rental often shows a tax loss while cash-flowing — sheltering income. Rental losses are passive: they offset passive income freely, and up to $25,000/yr can offset ordinary (W-2) income if you actively participate and your MAGI is under $100k (phasing out to $0 by $150k); unused losses carry forward. On sale, claimed depreciation is recaptured at up to 25%, and gains may owe capital-gains tax (a 1031 exchange can defer both). Figures are a year-1 estimate at your 24.0% rate — not tax advice; consult a CPA.
Schools (NCES district)
- District
- Thornton Fractional Twp Hsd 215
- NCES district ID
- 1738940
- Math proficiency
- 9% ▼ -3.00%
- Reading proficiency
- 13% ▼ -3.00%
- Median HH income
- $48,207
- Composite
- 10.27/100
- National rank
- #9793
- State rank
- #563 of 620 in IL
Livability — Calumet City
- Score
- 71/100
- State rank
- #330
- US rank
- #6552
Category grades
Schools grade is shown separately in the Schools card above.
Census & demographics
- Census place
- Calumet City, IL
- County
- Cook County · 4,486,803 people
- City population
- 35,100
- Metro
- Chicago-Naperville-Elgin, IL-IN-WI
- Population (ZIP)
- 35,100
- Household income
- $55,369
- Rent vs Own
- Severe rent burden
- 2415.0
Population outlook (Cook County) Hauer SSP2
- Today (2025)
- 5,347,519 people
- By 2030
- 5,357,703 · +0.2%
- By 2040
- 5,324,924 · -0.4%
- By 2050
- 5,230,762 · -2.2%
- By 2075
- 4,785,735 · -10.5%
- By 2100
- 4,188,836 · -21.7%
Race, ethnicity, and origin ACS 2023
- Neighborhood character
- Predominantly Black (74%)
- Race & ethnicity
- Black 74% Hispanic / Latino 15% White 7% Two or more races 4%
- Hispanic origin (detail)
- Mexican 14%
- Common ancestry
- Romanian 2%
- Foreign-born
- 9% · Canada
- Languages at home
- 83% English-only · Spanish 14%
Political lean MEDSL · Cook
- 2024 margin
- Solid D (+42.0) · D 70.4% · R 28.4% · Other 1.2%
- 2008→2024 swing
- -11.4pp toward R · 2008: 53.4pp · 2024: 42.0pp
- All cycles
- 2024: D+42.0 2020: D+50.3 2016: D+53.0 2012: D+49.4 2008: D+53.4
Not yet ingested
- Civics
- —
Market trends
- HPI YoY
- ▼ -75.01%
- Current HPI
- 197.2137
- Rent YoY
- ▲ 6.17%
- Metro
- Chicago-Naperville-Elgin, IL-IN-WI
- State GDP YoY
- ▲ 1.59%
- F500 in state
- 60
Industry mix (Fortune 500 HQ in IL)
| Industry | F500 HQs | Revenue |
|---|---|---|
| Insurance | 4 | $201B |
|
||
| Consumer Goods | 4 | $87B |
|
||
| Industrial Machinery | 3 | $64B |
|
||
| Healthcare | 2 | $55B |
|
||
| Retail / Pharmacy | 1 | $148B |
|
||
| Agriculture / Food | 1 | $86B |
|
||
Price history
+189.7% since first listed10 events — show timeline
- 2026-04-21 Listing Removed — MRED as Distributed by MLS Grid
- 2026-04-21 Listed $134,999 MRED as Distributed by MLS Grid
- 2026-03-01 Listed — MRED as Distributed by MLS Grid
- 2025-03-23 Listing Removed — MRED as Distributed by MLS Grid
- 2025-02-14 Listed — MRED as Distributed by MLS Grid
- 2007-11-05 Listing Removed — MRED as Distributed by MLS Grid
- 2007-01-22 Listed — MRED as Distributed by MLS Grid
- 2005-08-09 Sold (Public Records) $92,000 Public Records
- 1992-10-26 Sold (Public Records) $58,000 Public Records
- 1988-04-01 Sold (Public Records) $46,600 Public Records
Property tax history
+4.9%/yrLatest (2023): $7,234 · +22.5% YoY. Source: county tax records.
Cash-flow waterfall
monthlySold comps — $/sqft
last 12 mo · ≤1 miLoading sold comps…