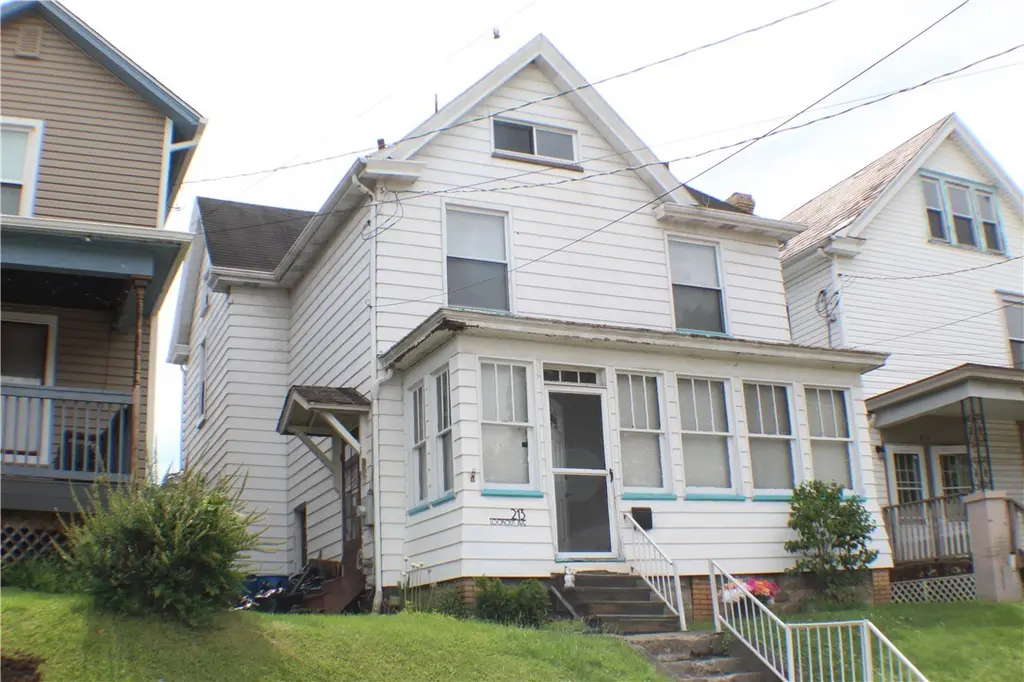
213 Lookout Ave · Charleroi, PA
Flood risk 1/10 · Minimal
- FEMA flood zone
- X (unshaded)
- Chance of flooding over 30 yrs
- 0.0%
- Est. flood insurance / yr
- $473 – $860
Fire risk 1/10 · Minimal
- Est. fire insurance / yr
- $511 – $949
Heat risk 4/10 · Minor
- Hot days now (above 97°F)
- 7 days/yr
- Hot days in 30 yrs
- 20 days/yr
Wind risk 2/10 · Minimal
- Chance of severe wind over 30 yrs
- —
Air-quality risk 2/10 · Minimal
- Unhealthy air days now
- 1 days/yr
- Unhealthy air days in 30 yrs
- 2 days/yr
Risk factors via First Street. Map © Google.
Why this score? — see what drove the B grade
The composite is a weighted blend of 9 inputs, each scored 0–100. Each bar is that input's sub-score; the figure is the points it added to the 100-point composite (weight × sub-score).
- Cash flow +30.0/30.0
- 1% rule +10.0/10.0
- DSCR +10.0/10.0
- ARV discount +4.4/15.0
- Appreciation +4.1/10.0
- Livability +3.8/5.0
- Schools +3.0/10.0
- Rent growth +2.5/5.0
- Condition / age +2.5/5.0
$63,900
🖨 Deal sheet (PDF) 📄 Offer letter ✓ Due diligence
Listing remarks MLS
Well maintained. 3br's, 2 full bth, 1st floor fam rm, form dr, pocket doors, bay wind, fp in LR, sun porch, range, ref, wsh/dry incl.
Key facts
- Corner china closet
- Working pocket doors
- Enclosed porch
Tags
Property features AI
Exterior
- Parking: On-street parking
- Utilities: Public water; Public sewer
- Home design: Two-story residence; Resale property
- Construction: Aluminum siding; Asphalt roof
- Exterior features: Private pool
Interior
- Kitchen: Microwave; Refrigerator; Stove; Some electric appliances
- Bedrooms: Three bedrooms (upper level)
- Bathrooms: Two full bathrooms
- Heating & cooling: Gas hot water heating; Wall/window air conditioning units
- Interior features: Full basement with interior entry; Fireplace (gas) in family/living room
- Laundry & utility: Main-level laundry room
Neighborhood map
What this means for you Summary
Snapshot
- This is a 3-bed/2.0-bath single-family listed at $64k.
Deal economics
- At list price, monthly cash flow is $663 ($8k/yr) — positive.
- The deal already cash-flows at list — no discount required.
- Meets the 1% rule at list price ($1k rent vs $64k).
- Recommended offer: $63k (1.5% below list) — sets the bar for market timing.
- Cap rate 18.7% vs local median 15.3% in Charleroi — meaningfully above typical; check what's discounted (condition, days-on-market, listing class) to confirm the premium yield is real.
Location & tenants
- Location reads 76/100 on livability (#382 in PA, #3,416 nationally) — a middle-class / working-renter tenant base. Strengths: cost of living A+, housing A+, crime A-; Watch: schools D+, employment F.
- Charleroi SD (rural): math 20% / reading 51% proficiency, ranked #421 of 539 in PA (top 78%) — families likely to look elsewhere, expect single-tenant / working-renter base with shorter leases.
- Market conditions: 87 active listings in the ZIP; 1 comparable units currently listed for rent nearby; 489 units permitted in Washington County in 2024 (30 in 5+ unit buildings).
Forward outlook
- Local home prices are declining (-1.8%/yr); year-one equity from $442 of loan paydown is wiped out by about $1k of value loss. Plan a longer hold.
- Washington County population projected to shrink 6% by 2050 — rents likely to lag national; underwrite the cash flow, not the appreciation.
- At projected returns (-1.8% appreciation + 3.0% rent growth), your $18k cash investment doubles in ~3 years — after that, you're playing with house money.
Negotiation context
- It's been on market 15 days — a 2% lower offer ($63k) is reasonable based on typical stale-listing flexibility.
- 2 sale attempts since 24y ago with the ask held roughly flat each time — persistent listings suggest the price (not the market) is what's stuck; bring a comps-based counter.
- Current owner paid $36k; list at $64k implies a 80% gain — meaningful room to come down on a strong offer.
Risks & watch-outs
- Watch-outs: built in 1910 — expect roof / HVAC / electrical / plumbing capex.
Questions for the listing agent
- Built in 1910 — when were the roof, HVAC, electrical panel, plumbing, and water heater last replaced?
- Is there a deadline driving the sale (1031 exchange, divorce, estate, relocation)? That informs how much negotiation room exists.
- Schools are D-rated, which usually means shorter tenancies and higher turnover. Who's the typical renter profile here, and what's been the actual vacancy rate?
- What's the average days-on-market for RENTAL listings here right now (not sales)? A rising rental-DOM trend means longer vacancies and softer asking-rent achievability than the comps imply.
- What's the recent tenant-quality profile in this submarket — average credit score on applications, eviction rate, late-payment / NSF rate, and stable-employment percentage? A property-management company in the area should have these aggregated.
- How much new for-sale + rental construction is in the pipeline within 1–3 miles? Heavy new supply typically softens prices + rents 12–24 months out; constrained supply supports both.
Investment metrics
- 1% rule
- 2.27% ✓
- Cap rate
- 18.75%
- Cash-on-cash
- 44.49%
- DSCR
- 2.98
- GRM
- 3.7
CMA / ARV
- ARV (on-the-fly)
- $59,768
- Comps found
- 12
Show comp detail 12 sales within ~0.75 mi
| Address | Dist | Beds/Ba | Sqft | Sold | Price | $/sf | Match |
|---|---|---|---|---|---|---|---|
| 327 Meadow Ave | 0.20mi | 4/1.5 (+1) | 1,916 (-1%) | 10mo | $77,000 | $40 | 74 |
| 606 Shady Ave | 0.38mi | 3/2.0 | 1,868 (-3%) | 20mo | $127,000 | $68 | 60 |
| 207 Mckean Ave | 0.19mi | 3/1.5 | 1,782 (-8%) | 19mo | $78,000 | $44 | 60 |
| 250 Grandview Way | 0.39mi | 4/2.5 (+1) | 2,072 (+8%) | 3mo | $240,000 | $116 | 60 |
| 613 Crest Ave | 0.38mi | 4/1.5 (+1) | 2,111 (+10%) | 5mo | $54,000 | $26 | 55 |
| 901 Mckean Ave | 0.63mi | 4/1.5 (+1) | 1,962 (+2%) | 12mo | $35,000 | $18 | 51 |
| 907 Crest Ave | 0.60mi | 3/1.5 | 1,700 (-12%) | 1mo | $53,000 | $31 | 50 |
| 437 Shady Ave | 0.35mi | 4/1.5 (+1) | 1,698 (-12%) | 8mo | $58,500 | $34 | 50 |
| 828 Crest Ave | 0.57mi | 4/2.0 (+1) | 1,762 (-9%) | 6mo | $24,000 | $14 | 49 |
| 722 Washington Ave | 0.48mi | 3/1.5 | 1,756 (-9%) | 17mo | $22,000 | $13 | 47 |
| 906 Fallowfield Ave | 0.64mi | 4/1.0 (+1) | 1,806 (-6%) | 15mo | $42,000 | $23 | 38 |
| 809 Mckean Ave | 0.56mi | 3/2.0 | 1,668 (-14%) | 19mo | $40,000 | $24 | 35 |
Match score weights: distance 35% · size 25% · config 20% · recency 20%. Top-matched comps best support the ARV.
Projected returns pro-forma
-1.83% appreciation · 3.0% rent growth · sell at horizon
- IRR
- 43.2%
- Equity multiple
- 2.96×
- Total profit
- $35,128
- Equity at exit
- $12,920
- IRR
- 48.0%
- Equity multiple
- 5.92×
- Total profit
- $88,049
- Equity at exit
- $11,531
Cash invested: $17,892 (down + closing). Projections, not guarantees.
Landlord ↔ Tenant lean methodology
- Overall (STATE)
- 62 Landlord-Friendly
- State Pennsylvania
- 62 Landlord-Friendly · EVEN
- County
- — inherits STATE
- City
- — inherits STATE
ZIP-level market 15022
- Home prices YoY
- -1.0%
- Active inventory
- 87
- Price-to-rent
- 3.7×
Monthly cashflow live
- Estimated rent
- $1,450 medium interval (Pro) →
- Mortgage (P&I)
- −$335
- Tax from tax record
- −$120 /mo · $1,445/yr
- Insurance
- −$27
- HOA
- −$0
- Vacancy / Maint / Mgmt
- −$304
- Net cashflow
- $663
Break-even live
Sensitivity live
| Price | -10% $699 | -5% $681 | +0% $663 | +5% $645 | +10% $627 |
|---|---|---|---|---|---|
| Rent | -10% $549 | -5% $606 | +0% $663 | +5% $721 | +10% $778 |
| Rate | -1.0pp $696 | -0.5pp $680 | base $663 | +0.5pp $647 | +1.0pp $630 |
UW: 25.0% down · 7.5% · 30yr · 1.5% tax · 5.0% vac · 8.0% maint · 8.0% mgmt
Financing live
Cash to close
- Down payment
- $15,975
- Closing costs
- $1,917
- Reserves months
- —
- Total cash needed
- —
Loan-product check · same deal, 3 products live
Conventional
25% down · 7.5% · 30yr
- Down + closing
- —
- Monthly P&I
- —
- Monthly cashflow
- —
- DSCR
- —
- Eligible?
- —
Personal DTI + credit; lowest rate.
DSCR
20% down · 8.5% · 30yr
- Down + closing
- —
- Monthly P&I
- —
- Monthly cashflow
- —
- DSCR
- —
- Eligible?
- —
No personal income docs; deal must DSCR.
Hard money
10% down · 12.0% · 12mo
- Down + closing
- —
- Monthly P&I
- —
- Monthly cashflow
- —
- DSCR
- —
- Eligible?
- —
Short-term bridge; refi at stabilization.
Rent comps 1 comps
| Address | Beds | Baths | Sqft | Rent | $/sqft | DOM | Units | Dist |
|---|---|---|---|---|---|---|---|---|
| 1022 McKean Ave Charleroi, PA | 3.0 | 3.0 | 1344 | $1,450 | $1.08 | 2d | 1 | 0.78mi |
Listing history 10 events
-
2026-06-18days on market $63,900 Active 15 DOM
-
2026-06-17days on market $63,900 Active 14 DOM
-
2026-06-16days on market $63,900 Active 13 DOM
-
2026-06-15days on market $63,900 Active 12 DOM
-
2026-06-13days on market $63,900 Active 10 DOM
-
2026-06-09days on market $63,900 Active 6 DOM
-
2026-06-08days on market $63,900 Active 5 DOM
-
2026-06-07days on market $63,900 Active 4 DOM
-
2026-06-05remarks 699-char remark
-
2026-06-05$63,900 Active 1 DOM
ⓘ Source: listings_history table (triggers on properties + properties_extension) + one-shot
backfill from property_details.listing_events for pre-trigger history.
Tax reassessment forecast PA · Partial reset (capped growth)
- Current annual tax
- $1,445 · $120/mo
- Projected year-2 tax
- $1,445 · $120/mo
- Expected delta
- $0/yr ($0/mo · 0.0%)
ⓘ Screening estimate from a state-policy table — verify with the county assessor before closing.
Climate risk First Street
- Flood 1/10 Low FEMA zone X (unshaded) · 0% chance over 30 yrs
- Wildfire 1/10 Low
- Heat 4/10 Moderate 7 d/yr ≥97°F today · 20 d/yr by 30 yrs out
- Wind 2/10 Low
- Air quality 2/10 Low 1 unhealthy d/yr today · 2 by 30 yrs out
Nearby sold comps map
Loading sold comps map…
Walkable amenities ~0.75 mi
Loading nearby amenities…
Taxation est. · year 1
- Rental income
- $17,400
- − Mortgage interest
- −$3,579
- − Property taxes
- −$1,445
- − Insurance
- −$320
- − Repairs & maintenance
- −$1,392
- − Management
- −$1,392
- − Depreciation
- −$1,859
- Taxable income
- $7,413
- Est. tax owed @ 24.0%
- −$1,779
- After-tax cash flow
- $6,181/yr
For passive investors: Depreciation is non-cash, so a rental often shows a tax loss while cash-flowing — sheltering income. Rental losses are passive: they offset passive income freely, and up to $25,000/yr can offset ordinary (W-2) income if you actively participate and your MAGI is under $100k (phasing out to $0 by $150k); unused losses carry forward. On sale, claimed depreciation is recaptured at up to 25%, and gains may owe capital-gains tax (a 1031 exchange can defer both). Figures are a year-1 estimate at your 24.0% rate — not tax advice; consult a CPA.
Schools (NCES district)
- District
- Charleroi SD
- NCES district ID
- 4205640
- Math proficiency
- 20% ▼ -19.00%
- Reading proficiency
- 51% ▼ -11.00%
- Median HH income
- $40,410
- Composite
- 29.72/100
- National rank
- #6450
- State rank
- #421 of 539 in PA
Livability — Charleroi
- Score
- 76/100
- State rank
- #382
- US rank
- #3416
Category grades
Schools grade is shown separately in the Schools card above.
Census & demographics
- Census place
- Charleroi, PA
- Population (ZIP)
- 10,044
Population outlook (Washington County) Hauer SSP2
- Today (2025)
- 208,060 people
- By 2030
- 207,168 · -0.4%
- By 2040
- 202,738 · -2.6%
- By 2050
- 195,269 · -6.1%
- By 2075
- 175,588 · -15.6%
- By 2100
- 145,827 · -29.9%
Race, ethnicity, and origin ACS 2023
- Neighborhood character
- Predominantly White (87%)
- Race & ethnicity
- White 87% Two or more races 6% Black 6%
- Common ancestry
- Romanian 8% Lithuanian 3% Scotch-Irish 2%
- Foreign-born
- 2% · Canada
- Languages at home
- 98% English-only · Spanish 1%
Political lean MEDSL · Washington
- 2024 margin
- Strong R (+25.5) · D 36.9% · R 62.4%
- 2008→2024 swing
- -20.8pp toward R · 2008: -4.7pp · 2024: -25.5pp
- All cycles
- 2024: R+25.5 2020: R+22.8 2016: R+25.3 2012: R+13.3 2008: R+4.7
Not yet ingested
- Civics
- —
Market trends
- HPI YoY
- ▼ -1.83%
- Current HPI
- 174.218
- Rent YoY
- —
- Metro
- —
- State GDP YoY
- ▲ 1.68%
- F500 in state
- 34
Industry mix (Fortune 500 HQ in PA)
| Industry | F500 HQs | Revenue |
|---|---|---|
| Healthcare | 2 | $309B |
|
||
| Insurance | 2 | $27B |
|
||
| Telecommunications / Media | 1 | $124B |
|
||
| Industrial Distribution | 1 | $22B |
|
||
| Financial Services | 1 | $20B |
|
||
| Chemicals / Materials | 1 | $18B |
|
||
Price history
+64.3% since first listed3 events — show timeline
- 2026-06-03 Listed $63,900 West Penn MLS
- 2003-02-25 Sold (MLS) $35,500 West Penn MLS
- 2002-10-01 Listed $38,900 West Penn MLS
Property tax history
+2.0%/yrLatest (2026): $1,445 · +1.2% YoY. Source: county tax records.
Cash-flow waterfall
monthlySold comps — $/sqft
last 12 mo · ≤1 miLoading sold comps…