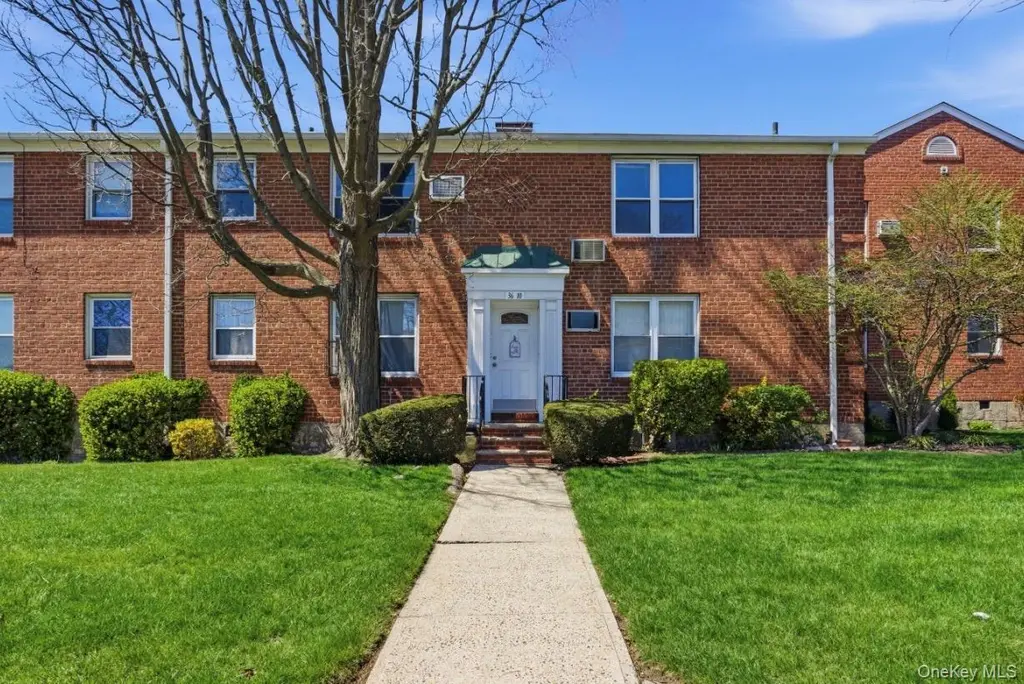
36-10 Utopia Pkwy Unit E4 · New York, NY
Flood risk 1/10 · Minimal
- FEMA flood zone
- X (unshaded)
- Chance of flooding over 30 yrs
- 0.0%
- Est. flood insurance / yr
- $507 – $1,088
Fire risk 1/10 · Minimal
- Est. fire insurance / yr
- $691 – $1,283
Heat risk 6/10 · Moderate
- Hot days now (above 99°F)
- 7 days/yr
- Hot days in 30 yrs
- 15 days/yr
Wind risk 6/10 · Moderate
- Chance of severe wind over 30 yrs
- 27.0%
Air-quality risk 4/10 · Minor
- Unhealthy air days now
- 6 days/yr
- Unhealthy air days in 30 yrs
- 6 days/yr
Risk factors via First Street. Map © Google.
Why this score? — see what drove the D grade
The composite is a weighted blend of 9 inputs, each scored 0–100. Each bar is that input's sub-score; the figure is the points it added to the 100-point composite (weight × sub-score).
- Cash flow +10.9/30.0
- ARV discount +7.5/15.0
- Rent growth +5.0/5.0
- Schools +5.0/10.0
- Condition / age +4.0/5.0
- Livability +3.8/5.0
- 1% rule +3.2/10.0
- DSCR +3.2/10.0
- Appreciation +0.0/10.0
$285,000
🖨 Deal sheet (PDF) 📄 Offer letter ✓ Due diligence
Listing remarks
Beautiful one bedroom unit. Very sunny with a lots of updates including a new luxury kitchen and new hardwood floors . This is spacious corner second floor unit which provides a nice views of the garden and the neighborhood. There is a laundry in the premises . New windows will install in the next two months . The location is a plus . Next to the bus Q28 and LIRR . Can be in NYC in less than 30 minutes . Trains to Manhattan every 30 minutes. Shopping dining and entertainment are all walking distance. Must see to appreciate ! Featured Residential Sales.
Key facts
- Views of the garden
- New hardwood floors
- New luxury kitchen
Tags
Property features AI
Finance
- Other: Community features include nearby park and sidewalks; Located in Queens County; directions: corner of Utopia Parkway and Crocheron Ave
- HOA & community: Association-maintained landscaping and grounds; Maintenance services provided
Exterior
- Parking: On-street parking; Private parking (waitlist); Parking fee applicable
- Utilities: Public sewer; Trash collection (public)
- Home design: Townhouse (stock cooperative); Two stories total; Entry at level 2
- Construction: Brick construction
- Exterior features: Brick exterior; No waterfront
Interior
- Kitchen: Dishwasher; Gas range; Microwave; Refrigerator; Stainless steel appliances
- Bedrooms: One level (entry level 2)
- Flooring: Hardwood floors
- Bathrooms: 1 full bathroom
- Heating & cooling: Hot water heating; Natural gas heating; Wall/window AC unit(s)
- Interior features: Granite counters; Updated/remodeled
- Laundry & utility: Common area laundry; In-basement laundry; Dedicated laundry room
Neighborhood map
What this means for you Summary
Snapshot
- This is a 1-bed/1.0-bath condo listed at $285k. Condition is rated good.
Deal economics
- At list price, monthly cash flow is $-125 ($-2k/yr) — negative.
- To cash-flow at today's rent, offer at most $267k (6.4% below list).
- To meet the 1% rule (rent ≥ 1% of price), the offer needs to be $233k (18.1% below list).
- Recommended offer: $233k (18.1% below list) — sets the bar for 1% rule.
- Cap rate 5.8% vs local median 2.6% in New York — top-decile yield for the area; either an underpriced asset or a hidden risk that comps aren't pricing in. Stress-test before assuming the spread holds.
Location & tenants
- Location reads 75/100 on livability (#268 in NY, #4,188 nationally) — a middle-class / working-renter tenant base. Strengths: amenities A+, commute A+, health & safety A; Watch: crime F, cost of living F.
- Market conditions: Rents rising fast (+12.7%/yr); 177 active listings in the ZIP; 13 comparable units currently listed for rent nearby; rentals leasing fast (median 9d on market — plan ~1-2 weeks tenant-placement turnaround); solid renter incomes; 5,302 units permitted in Queens County in 2024 (4,918 in 5+ unit buildings).
- This rent runs 32% of the median local income ($88k/yr) — at the standard rent-burdened threshold; future hikes will face affordability resistance.
Forward outlook
- Local home prices are declining (-3.0%/yr); year-one equity from $2k of loan paydown is wiped out by about $9k of value loss. Plan a longer hold.
- Queens County population projected at +16% by 2050 — long-run rental-demand tailwind backs the buy-and-hold thesis.
Negotiation context
- It's been on market 30 days — a 2% lower offer ($281k) is reasonable based on typical stale-listing flexibility.
Risks & watch-outs
- Watch-outs: built in 1950 — expect roof / HVAC / electrical / plumbing capex.
- Climate carrying-cost: major wind risk, 27% chance of damaging wind over 30y; extreme-heat days projected 7→15/yr by 2055 (HVAC capex compounding) — expect insurance premiums to compound above CPI over the hold.
Questions for the listing agent
- What do current leases actually rent for vs. the listed asking? Can we see a recent rent roll and the last 12 months of T-12 income?
- Built in 1950 — when were the roof, HVAC, electrical panel, plumbing, and water heater last replaced?
- Any open or pending special assessments — roof, HVAC, plumbing, elevator, façade? What's the per-unit balance and payoff schedule, and is the seller paying it off at close or rolling it to the buyer?
- Is there a deadline driving the sale (1031 exchange, divorce, estate, relocation)? That informs how much negotiation room exists.
- Schools are B-rated — typically a magnet for longer-tenancy family renters. What's the average tenant stay here, and is there a school-zone premium baked into asking?
- Crime grade is F in this area — have there been break-ins, vandalism, or insurance claims at this property in the last 3 years? What carrier currently insures it and at what premium?
- The area grade is low — what's the realistic commute time and amenity access for the typical tenant pool here? Any planned neighborhood developments (good or bad) we should know about?
- What's the average days-on-market for RENTAL listings here right now (not sales)? A rising rental-DOM trend means longer vacancies and softer asking-rent achievability than the comps imply.
- What's the recent tenant-quality profile in this submarket — average credit score on applications, eviction rate, late-payment / NSF rate, and stable-employment percentage? A property-management company in the area should have these aggregated.
- How much new apartment / multifamily construction is in the pipeline within 1–3 miles? Heavy new supply (>2% of stock underway) typically softens rents 12–24 months out; light construction supports rent growth.
Investment metrics
- 1% rule
- 0.82% ✗
- Cap rate
- 5.76%
- Cash-on-cash
- -1.89%
- DSCR
- 0.92
- GRM
- 10.2
CMA / ARV
No comps found within radius.
Projected returns pro-forma
-3.0% appreciation · 8.0% rent growth · sell at horizon
- IRR
- -14.0%
- Equity multiple
- 0.48×
- Total profit
- $-41,799
- Equity at exit
- $42,494
- IRR
- 1.4%
- Equity multiple
- 1.12×
- Total profit
- $9,608
- Equity at exit
- $24,642
Cash invested: $79,800 (down + closing). Projections, not guarantees.
Landlord ↔ Tenant lean methodology
- Overall (CITY)
- 0 Strongly Tenant-Friendly
- State New York
- 15 Strongly Tenant-Friendly · D+10
- County
- — inherits STATE
- City New York
- 0 Strongly Tenant-Friendly · D+34
ZIP-level market 11358
- Rents YoY
- 12.7%
- Active inventory
- 177
- Price-to-rent
- 10.2×
Monthly cashflow live
- Estimated rent
- $2,334 high interval (Pro) →
- Mortgage (P&I)
- −$1,495
- Tax est. 1.5%
- −$356 /mo · $4,275/yr
- Insurance
- −$119
- HOA
- −$0
- Vacancy / Maint / Mgmt
- −$490
- Net cashflow
- $-125
Break-even live
Sensitivity live
| Price | -10% $72 | -5% $-27 | +0% $-125 | +5% $-224 | +10% $-322 |
|---|---|---|---|---|---|
| Rent | -10% $-310 | -5% $-218 | +0% $-125 | +5% $-33 | +10% $59 |
| Rate | -1.0pp $18 | -0.5pp $-53 | base $-125 | +0.5pp $-199 | +1.0pp $-274 |
UW: 25.0% down · 7.5% · 30yr · 1.5% tax · 5.0% vac · 8.0% maint · 8.0% mgmt
Financing live
Cash to close
- Down payment
- $71,250
- Closing costs
- $8,550
- Reserves months
- —
- Total cash needed
- —
Loan-product check · same deal, 3 products live
Conventional
25% down · 7.5% · 30yr
- Down + closing
- —
- Monthly P&I
- —
- Monthly cashflow
- —
- DSCR
- —
- Eligible?
- —
Personal DTI + credit; lowest rate.
DSCR
20% down · 8.5% · 30yr
- Down + closing
- —
- Monthly P&I
- —
- Monthly cashflow
- —
- DSCR
- —
- Eligible?
- —
No personal income docs; deal must DSCR.
Hard money
10% down · 12.0% · 12mo
- Down + closing
- —
- Monthly P&I
- —
- Monthly cashflow
- —
- DSCR
- —
- Eligible?
- —
Short-term bridge; refi at stabilization.
Rent comps 13 comps
| Address | Beds | Baths | Sqft | Rent | $/sqft | DOM | Units | Dist |
|---|---|---|---|---|---|---|---|---|
| 168-10 Crocheron Ave Unit 1A Flushing, NY | 1.0 | 1.0 | 750 | $2,250 | $3.00 | 19d | 1 | 0.19mi |
| 3620 168th St Flushing, NY | 1.0 | 1.0 | 700 | $2,350 | $3.36 | 8d | 2 | 0.20mi |
| 196-42 44th Ave #2 Flushing, NY | 1.0 | 1.0 | 600 | $2,200 | $3.67 | 5d | 1 | 0.67mi |
| 29-04 204th St Unit 1Floor Flushing, NY | 1.0 | 1.0 | 700 | $2,600 | $3.71 | 19d | 1 | 0.72mi |
| 4531 163rd St Unit 1 Flushing, NY | 1.0 | 1.0 | 600 | $2,250 | $3.75 | 8d | 1 | 0.72mi |
| 149-08 41st Ave Unit 3rd Floor Flushing, NY | 1.0 | 1.0 | 675 | $1,850 | $2.74 | 19d | 1 | 1.12mi |
| 14943 35th Ave Flushing, NY | 1.0 | 1.0 | 750 | $2,400 | $3.20 | 2d | 1 | 1.16mi |
| 14943 35th Ave Flushing, NY | 1.0 | 1.0 | 775 | $2,450 | $3.16 | 3d | 2 | 1.17mi |
| 149-35 Northern Blvd Unit 4Z Flushing, NY | — | 1.0 | 500 | $1,800 | $3.60 | 19d | 1 | 1.18mi |
| 40-11 214th Pl Unit 2R Bayside, NY | 1.0 | 1.0 | 650 | $2,800 | $4.31 | 5d | 1 | 1.30mi |
| 14427 Sanford Ave Unit 7G Flushing, NY | 2.0 | 1.0 | 655 | $3,500 | $5.34 | 25d | 1 | 1.38mi |
| 14424 37th Ave Unit 5B Flushing, NY | 2.0 | 1.0 | 560 | $2,800 | $5.00 | 25d | 1 | 1.46mi |
| 145-18 34th Ave Unit 8A Flushing, NY | 1.0 | 2.0 | 700 | $2,400 | $3.43 | 2d | 1 | 1.50mi |
HOA detail condo
- Monthly dues
- $0 · $0/yr
- Assessments
- None detected in remarks — confirm with the listing agent.
Listing history 2 events
-
2026-05-14status Pending
-
2026-04-14$285,000 Active
ⓘ Source: listings_history table (triggers on properties + properties_extension) + one-shot
backfill from property_details.listing_events for pre-trigger history.
Climate risk First Street
- Flood 1/10 Low FEMA zone X (unshaded) · 0% chance over 30 yrs
- Wildfire 1/10 Low
- Heat 6/10 Major 7 d/yr ≥99°F today · 15 d/yr by 30 yrs out
- Wind 6/10 Major 27% chance of damaging wind over 30 yrs
- Air quality 4/10 Moderate 6 unhealthy d/yr today · 6 by 30 yrs out
Nearby sold comps map
Loading sold comps map…
Walkable amenities ~0.75 mi
Loading nearby amenities…
Taxation est. · year 1
- Rental income
- $28,012
- − Mortgage interest
- −$15,964
- − Property taxes
- −$4,275
- − Insurance
- −$1,425
- − Repairs & maintenance
- −$2,241
- − Management
- −$2,241
- − Depreciation
- −$8,291
- Taxable loss
- −$6,425
- Est. tax savings @ 24.0%
- +$1,542
- After-tax cash flow
- $37/yr
For passive investors: Depreciation is non-cash, so a rental often shows a tax loss while cash-flowing — sheltering income. Rental losses are passive: they offset passive income freely, and up to $25,000/yr can offset ordinary (W-2) income if you actively participate and your MAGI is under $100k (phasing out to $0 by $150k); unused losses carry forward. On sale, claimed depreciation is recaptured at up to 25%, and gains may owe capital-gains tax (a 1031 exchange can defer both). Figures are a year-1 estimate at your 24.0% rate — not tax advice; consult a CPA.
Condition & rehab AI · 12 photos
This one-bedroom condo is in good condition with modern updates and a good location. It has potential for further improvements to increase its value.
Value-add opportunities
- Both Paint exterior and landscaping — Enhances curb appeal and can increase both resale and rental value.
- Resale Replace countertops with quartz or granite — Quartz or granite countertops are more durable and aesthetically pleasing, increasing resale value.
- Rental Install smart home devices — Smart home devices can attract tech-savvy renters and increase rental value.
Renovation cost estimate screening
Value-add ROI direction
- Both Paint exterior and landscaping — Enhances curb appeal and can increase both resale and rental value. ↑
- Resale Replace countertops with quartz or granite — Quartz or granite countertops are more durable and aesthetically pleasing, increasing resale value. ↑
- Rental Install smart home devices — Smart home devices can attract tech-savvy renters and increase rental value. ↑
ⓘ Cost ranges are severity-bucket heuristics (US national rule-of-thumb). Get contractor quotes + a written scope before underwriting a rehab budget.
Schools (NCES district)
No district data.
Livability — New York
- Score
- 75/100
- State rank
- #268
- US rank
- #4188
Category grades
Schools grade is shown separately in the Schools card above.
Census & demographics
- Census place
- New York, NY
- County
- Queens County · 1,914,869 people
- City population
- 7,731,280
- Metro
- New York-Newark-Jersey City, NY-NJ-PA
- Population (ZIP)
- 37,665
- Household income
- $88,165
- Rent vs Own
- Severe rent burden
- 1845.0
Population outlook (Queens County) Hauer SSP2
- Today (2025)
- 2,546,320 people
- By 2030
- 2,643,059 · +3.8%
- By 2040
- 2,815,563 · +10.6%
- By 2050
- 2,944,423 · +15.6%
- By 2075
- 3,123,338 · +22.7%
- By 2100
- 3,098,688 · +21.7%
Race, ethnicity, and origin ACS 2023
- Neighborhood character
- Diverse neighborhood (Simpson 0.65)
- Race & ethnicity
- Asian 49% White 28% Hispanic / Latino 17% Two or more races 7%
- Hispanic origin (detail)
- Mexican 1% Puerto Rican 3% Dominican 2%
- Common ancestry
- Romanian 1% Scotch-Irish 1%
- Foreign-born
- 50% · China, South Korea, Canada
- Languages at home
- 33% English-only · Chinese 25% Spanish 14% Korean 13%
Political lean MEDSL · Queens
- 2024 margin
- Strong D (+24.6) · D 62.3% · R 37.7%
- 2008→2024 swing
- -26.2pp toward R · 2008: 50.8pp · 2024: 24.6pp
- All cycles
- 2024: D+24.6 2020: D+45.2 2016: D+53.4 2012: D+58.5 2008: D+50.8
Not yet ingested
- Civics
- —
Market trends
- HPI YoY
- ▼ -593.47%
- Current HPI
- 304.3857
- Rent YoY
- ▲ 12.74%
- Metro
- New York-Newark-Jersey City, NY-NJ-PA
- State GDP YoY
- ▲ 2.60%
- F500 in state
- 92
Industry mix (Fortune 500 HQ in NY)
| Industry | F500 HQs | Revenue |
|---|---|---|
| Financial Services | 10 | $950B |
|
||
| Consumer Goods | 9 | $162B |
|
||
| Insurance | 4 | $225B |
|
||
| Telecommunications | 2 | $144B |
|
||
| Pharmaceuticals | 2 | $112B |
|
||
| Media / Entertainment | 2 | $69B |
|
||
Price history
2 events — show timeline
- 2026-05-14 Pending — OneKey® MLS as Distributed by MLS Grid
- 2026-04-14 Listed $285,000 OneKey® MLS as Distributed by MLS Grid
Cash-flow waterfall
monthlySold comps — $/sqft
last 12 mo · ≤1 miLoading sold comps…