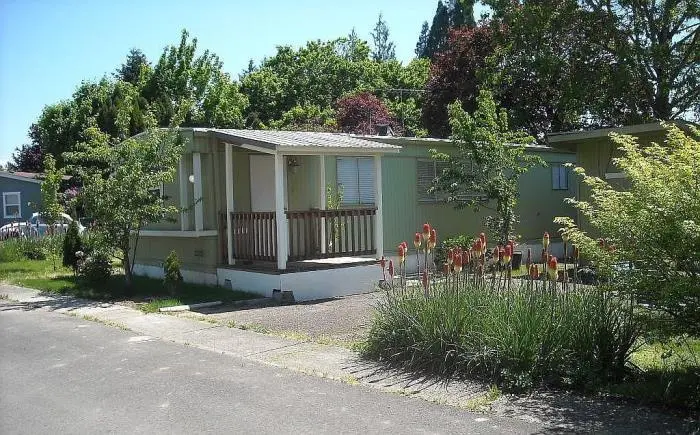
906 SW Alder St Unit 31 · Dundee, OR
Flood risk 1/10 · Minimal
- FEMA flood zone
- X (unshaded)
- Chance of flooding over 30 yrs
- 0.0%
- Est. flood insurance / yr
- $507 – $1,088
Fire risk 3/10 · Minor
- Est. fire insurance / yr
- $498 – $926
Heat risk 3/10 · Minor
- Hot days now (above 92°F)
- 7 days/yr
- Hot days in 30 yrs
- 14 days/yr
Wind risk 1/10 · Minimal
- Chance of severe wind over 30 yrs
- —
Air-quality risk 8/10 · Major
- Unhealthy air days now
- 10 days/yr
- Unhealthy air days in 30 yrs
- 11 days/yr
Risk factors via First Street. Map © Google.
Why this score? — see what drove the C grade
The composite is a weighted blend of 9 inputs, each scored 0–100. Each bar is that input's sub-score; the figure is the points it added to the 100-point composite (weight × sub-score).
- Cash flow +25.6/30.0
- DSCR +8.5/10.0
- ARV discount +7.5/15.0
- 1% rule +5.4/10.0
- Livability +3.7/5.0
- Schools +3.4/10.0
- Rent growth +2.5/5.0
- Condition / age +2.5/5.0
- Appreciation +0.0/10.0
$139,000
🖨 Deal sheet 📄 Offer letter ✓ Due diligence
Listing remarks
2 bedroom 2 bath on large treed lot master suit. This rare 2 bed 2 bath mobile is on a large 50X100 treed lot in a family park, has a large livingroom. has been totally updaded, with new kitchen, new baths laminated floors, new heat pump with ac. fenced yard has a patio with area for garden. garage. quiet safe park. new rubberized roof. laundry room. large covered front porch. 1120 sq ft. Easy private morgage only $10,000 dn. 800 payment, park is about $800 a month. NO agents without client.
Key facts
- Master suite
- New heat pump
- Large treed lot
Tags
Neighborhood map
What this means for you Summary
Snapshot
- This is a 2-bed/1.0-bath manufactured listed at $139k.
Deal economics
- At list price, monthly cash flow is $327 ($4k/yr) — positive.
- The deal already cash-flows at list — no discount required.
- Meets the 1% rule at list price ($1k rent vs $139k).
- Cap rate 9.1% vs local median 1.6% in Dundee — top-decile yield for the area; either an underpriced asset or a hidden risk that comps aren't pricing in. Stress-test before assuming the spread holds.
Location & tenants
- Location reads 73/100 on livability (#100 in OR) — a middle-class / working-renter tenant base. Strengths: crime A+, employment A+, housing A+; Watch: schools C-, amenities F, commute F.
- Newberg SD 29J (town): math 30% / reading 45% proficiency, ranked #17 of 58 in OR (top 29%) — families likely to look elsewhere, expect single-tenant / working-renter base with shorter leases.
- Market conditions: 45 active listings in the ZIP; 282 units permitted in Yamhill County in 2024 (0 in 5+ unit buildings).
Forward outlook
- Local home prices are declining (-3.0%/yr); year-one equity from $961 of loan paydown is wiped out by about $4k of value loss. Plan a longer hold.
- Yamhill County population projected at +8% by 2050 — modest demand growth; plan on rents tracking national, not racing it.
Negotiation context
- Only 5 days on market — expect competitive offers; lowballing is unlikely to land.
Questions for the listing agent
- Built in 1977 — when were the roof, HVAC, electrical panel, plumbing, and water heater last replaced?
- Is there a deadline driving the sale (1031 exchange, divorce, estate, relocation)? That informs how much negotiation room exists.
- What's the average days-on-market for RENTAL listings here right now (not sales)? A rising rental-DOM trend means longer vacancies and softer asking-rent achievability than the comps imply.
- What's the recent tenant-quality profile in this submarket — average credit score on applications, eviction rate, late-payment / NSF rate, and stable-employment percentage? A property-management company in the area should have these aggregated.
- How much new for-sale + rental construction is in the pipeline within 1–3 miles? Heavy new supply typically softens prices + rents 12–24 months out; constrained supply supports both.
Investment metrics
- 1% rule
- 1.04% ✓
- Cap rate
- 9.11%
- Cash-on-cash
- 10.07%
- DSCR
- 1.45
- GRM
- 8.0
CMA / ARV
- ARV (on-the-fly)
- $85,680
- Comps found
- 3
Show comp detail 3 sales within ~0.75 mi
| Address | Dist | Beds/Ba | Sqft | Sold | Price | $/sf | Match |
|---|---|---|---|---|---|---|---|
| 906 SW Alder St #4 | 0.00mi | 2/2.0 | 896 (-11%) | 2mo | $76,000 | $85 | 76 |
| 906 SW Alder St #23 | 0.00mi | 2/2.0 | 910 (-10%) | 9mo | $75,500 | $83 | 72 |
| 906 SW Alder St #45 | 0.00mi | 2/2.0 | 1,080 (+7%) | 16mo | $118,000 | $109 | 71 |
Match score weights: distance 35% · size 25% · config 20% · recency 20%. Top-matched comps best support the ARV.
Projected returns pro-forma
-3.0% appreciation · 3.0% rent growth · sell at horizon
- IRR
- -1.2%
- Equity multiple
- 0.95×
- Total profit
- $-1,790
- Equity at exit
- $20,725
- IRR
- 8.4%
- Equity multiple
- 1.64×
- Total profit
- $24,945
- Equity at exit
- $12,018
Cash invested: $38,920 (down + closing). Projections, not guarantees.
Landlord ↔ Tenant lean methodology
- Overall (STATE)
- 28 Tenant-Leaning
- State Oregon
- 28 Tenant-Leaning · D+6
- County
- — inherits STATE
- City
- — inherits STATE
ZIP-level market 97115
- Home prices YoY
- -23.6%
- Active inventory
- 45
- Price-to-rent
- 8.0×
Monthly cashflow live
- Estimated rent
- $1,439 medium interval (Pro) →
- Mortgage (P&I)
- −$729
- Tax from tax record
- −$24 /mo · $283/yr
- Insurance
- −$58
- HOA
- −$0
- Vacancy / Maint / Mgmt
- −$302
- Net cashflow
- $327
Break-even live
UW: 25.0% down · 7.5% · 30yr · 1.5% tax · 5.0% vac · 8.0% maint · 8.0% mgmt
Financing live
Cash to close
- Down payment
- $34,750
- Closing costs
- $4,170
- Reserves months
- —
- Total cash needed
- —
Loan-product check · same deal, 3 products live
Conventional
25% down · 7.5% · 30yr
- Down + closing
- —
- Monthly P&I
- —
- Monthly cashflow
- —
- DSCR
- —
- Eligible?
- —
Personal DTI + credit; lowest rate.
DSCR
20% down · 8.5% · 30yr
- Down + closing
- —
- Monthly P&I
- —
- Monthly cashflow
- —
- DSCR
- —
- Eligible?
- —
No personal income docs; deal must DSCR.
Hard money
10% down · 12.0% · 12mo
- Down + closing
- —
- Monthly P&I
- —
- Monthly cashflow
- —
- DSCR
- —
- Eligible?
- —
Short-term bridge; refi at stabilization.
Listing history 6 events
-
2026-06-18days on market $139,000 Active 5 DOM
-
2026-06-17days on market $139,000 Active 4 DOM
-
2026-06-16days on market $139,000 Active 3 DOM
-
2026-06-15days on market $139,000 Active 2 DOM
-
2026-06-13remarks 496-char remark
-
2026-06-13$139,000 Active 1 DOM
ⓘ Source: listings_history table (triggers on properties + properties_extension) + one-shot
backfill from property_details.listing_events for pre-trigger history.
Tax reassessment forecast OR · Resets to sale price
- Current annual tax
- $283 · $24/mo
- Projected year-2 tax
- $1,348 · $112/mo
- Expected delta
- +$1,066/yr (+$89/mo · 377.1%)
ⓘ Screening estimate from a state-policy table — verify with the county assessor before closing.
Climate risk First Street
- Flood 1/10 Low FEMA zone X (unshaded) · 0% chance over 30 yrs
- Wildfire 3/10 Moderate
- Heat 3/10 Moderate 7 d/yr ≥92°F today · 14 d/yr by 30 yrs out
- Wind 1/10 Low
- Air quality 8/10 Severe 10 unhealthy d/yr today · 11 by 30 yrs out
Nearby sold comps map
Loading sold comps map…
Walkable amenities ~0.75 mi
Loading nearby amenities…
Taxation est. · year 1
- Rental income
- $17,272
- − Mortgage interest
- −$7,786
- − Property taxes
- −$283
- − Insurance
- −$695
- − Repairs & maintenance
- −$1,382
- − Management
- −$1,382
- − Depreciation
- −$4,044
- Taxable income
- $1,701
- Est. tax owed @ 24.0%
- −$408
- After-tax cash flow
- $3,512/yr
For passive investors: Depreciation is non-cash, so a rental often shows a tax loss while cash-flowing — sheltering income. Rental losses are passive: they offset passive income freely, and up to $25,000/yr can offset ordinary (W-2) income if you actively participate and your MAGI is under $100k (phasing out to $0 by $150k); unused losses carry forward. On sale, claimed depreciation is recaptured at up to 25%, and gains may owe capital-gains tax (a 1031 exchange can defer both). Figures are a year-1 estimate at your 24.0% rate — not tax advice; consult a CPA.
Schools (NCES district)
- District
- Newberg SD 29J
- NCES district ID
- 4108720
- Math proficiency
- 30% ▼ -13.00%
- Reading proficiency
- 45% ▼ -12.00%
- Median HH income
- $62,898
- Composite
- 33.6/100
- National rank
- #5414
- State rank
- #17 of 58 in OR
Livability — Dundee
- Score
- 73/100
- State rank
- #100
- US rank
- #5385
Category grades
Schools grade is shown separately in the Schools card above.
Census & demographics
- Census place
- Dundee, OR
- Population (ZIP)
- 3,916
Population outlook (Yamhill County) Hauer SSP2
- Today (2025)
- 109,295 people
- By 2030
- 112,060 · +2.5%
- By 2040
- 115,975 · +6.1%
- By 2050
- 118,155 · +8.1%
- By 2075
- 120,968 · +10.7%
- By 2100
- 116,163 · +6.3%
Race, ethnicity, and origin ACS 2023
- Neighborhood character
- Predominantly White (69%)
- Race & ethnicity
- White 69% Hispanic / Latino 26% Two or more races 16% Asian 1%
- Hispanic origin (detail)
- Mexican 17%
- Common ancestry
- Iranian 4% Italian 4% Portuguese 3%
- Foreign-born
- 14% · Canada
- Languages at home
- 80% English-only · Spanish 19%
Political lean MEDSL · Yamhill
- 2024 margin
- Lean R (+6.1) · D 45.3% · R 51.4% · Other 3.3%
- 2008→2024 swing
- -4.8pp toward R · 2008: -1.4pp · 2024: -6.1pp
- All cycles
- 2024: R+6.1 2020: R+4.0 2016: R+8.8 2012: R+6.7 2008: R+1.4
Not yet ingested
- Civics
- —
Market trends
- HPI YoY
- ▼ -108.84%
- Current HPI
- 351.3391
- Rent YoY
- —
- Metro
- —
- State GDP YoY
- ▲ 2.05%
- F500 in state
- 2
Industry mix (Fortune 500 HQ in OR)
| Industry | F500 HQs | Revenue |
|---|---|---|
| Consumer Goods | 1 | $51B |
|
||
Price history
1 event — show timeline
- 2026-06-09 Listed $139,000 Fizber.com
Property tax history
+27.2%/yrLatest (2025): $283 · +6.9% YoY. Source: county tax records.
Cash-flow waterfall
monthlySold comps — $/sqft
last 12 mo · ≤1 miLoading sold comps…