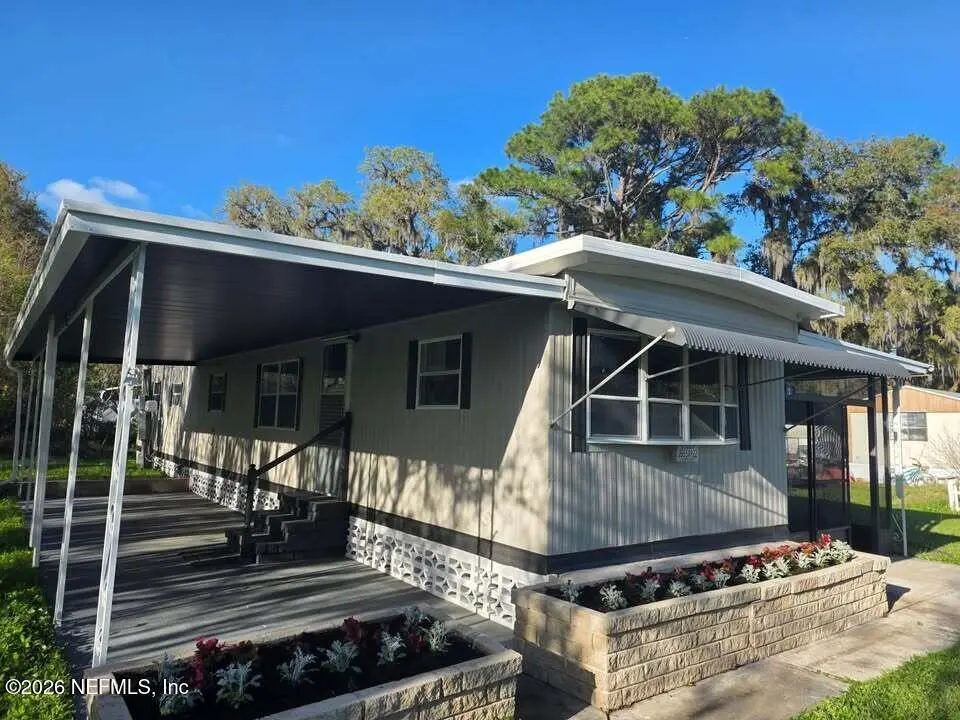
200 E Char Ln · Pomona Park, FL
Flood risk 1/10 · Minimal
- FEMA flood zone
- X (unshaded)
- Chance of flooding over 30 yrs
- 0.0%
- Est. flood insurance / yr
- $507 – $1,088
Fire risk 4/10 · Minor
- Est. fire insurance / yr
- $947 – $1,759
Heat risk 9/10 · Severe
- Hot days now (above 108°F)
- 7 days/yr
- Hot days in 30 yrs
- 21 days/yr
Wind risk 9/10 · Severe
- Chance of severe wind over 30 yrs
- 99.0%
Air-quality risk 3/10 · Minor
- Unhealthy air days now
- 3 days/yr
- Unhealthy air days in 30 yrs
- 3 days/yr
Risk factors via First Street. Map © Google.
Why this score? — see what drove the B- grade
The composite is a weighted blend of 9 inputs, each scored 0–100. Each bar is that input's sub-score; the figure is the points it added to the 100-point composite (weight × sub-score).
- Cash flow +24.8/30.0
- ARV discount +10.5/15.0
- DSCR +8.0/10.0
- Appreciation +6.4/10.0
- 1% rule +5.7/10.0
- Livability +3.1/5.0
- Schools +3.0/10.0
- Rent growth +2.5/5.0
- Condition / age +2.5/5.0
$129,900
🖨 Deal sheet 📄 Offer letter ✓ Due diligence
Listing remarks
Recently renovated and move-in ready lake-area home just seconds from Crescent Lake. Priced aggressively for a quick sale with major upgrades already completed - ideal for weekend use, seasonal living, or a low-maintenance full-time residence. No land lease - you own both the home and the land on this . 34-acre corner lot. Recently renovated and priced for a quick sale - serious inquiries only. Lake-area home just seconds from Crescent Lake - move-in ready with major upgrades completed. Situated on a . 34-acre corner lot with no land lease - you own both the home and the land. Recent renovations include: New subfloor and flooring throughout Updated kitchen with new cabinets and appliances R
Key facts
- Renovated bathroom
- Large covered porch
- Lake area home
Tags
Property features AI
Finance
- HOA & community: Homeowners association with $25 annual fee; Not a senior community
Exterior
- Parking: Off-street parking; 1-space carport
- Utilities: Septic tank; Other utilities
- Home design: Manufactured/mobile home
- Exterior features: Metal roof; Other detached/auxiliary structure on the property
Interior
- Kitchen: Dishwasher; Electric range; Microwave; Refrigerator
- Bedrooms: 2 bedrooms
- Bathrooms: 1 full bathroom
- Heating & cooling: Cooling present (other type)
- Interior features: Covered, screened patio/porch
Neighborhood map
What this means for you Summary
Snapshot
- This is a 2-bed/1.0-bath manufactured listed at $130k.
Deal economics
- At list price, monthly cash flow is $275 ($3k/yr) — positive.
- The deal already cash-flows at list — no discount required.
- Meets the 1% rule at list price ($1k rent vs $130k).
- Recommended offer: $126k (3.0% below list) — sets the bar for market timing.
- Cap rate 8.8% vs local median 2.0% in Pomona Park — top-decile yield for the area; either an underpriced asset or a hidden risk that comps aren't pricing in. Stress-test before assuming the spread holds.
Location & tenants
- Location reads 61/100 on livability (#774 in FL) — a middle-class / working-renter tenant base. Strengths: crime A+, cost of living A+, housing A+; Watch: health & safety C-, amenities F, commute F.
- Putnam (town): math 34% / reading 39% proficiency, ranked #66 of 73 in FL (top 90%) — families likely to look elsewhere, expect single-tenant / working-renter base with shorter leases; 71% free/reduced lunch — lower-income household profile, screen leases tightly.
- Zoned schools: Middleton-Burney Elementary School (math 31% / reading 30%, grade F, #1,862 of 2,144 statewide, top 88%, 1,046 students, 70% FRL); Crescent City Jr-Sr High School (math 17% / reading 34%, grade F, #499 of 667 statewide, top 75%, 1,005 students, 72% FRL) — zoned schools at 71% FRL track the district average.
- Market conditions: 143 active listings in the ZIP; 113 units permitted in Putnam County in 2024 (0 in 5+ unit buildings).
Forward outlook
- In year one you build about $5k of equity ($898 loan paydown + $4k appreciation (2.9% local appreciation)).
- Putnam County population projected at -31% by 2050 — secular population decline; favor cash flow + early exit over multi-decade hold.
- At projected returns (2.9% appreciation + 3.0% rent growth), your $36k cash investment doubles in ~5 years — after that, you're playing with house money.
- By year 8, paydown + projected appreciation supports a ~$34k cash-out refi (75% LTV) — recoverable capital for the next deal without selling this one.
Negotiation context
- It's been on market 51 days — a 3% lower offer ($126k) is reasonable based on typical stale-listing flexibility.
- Current owner paid $17k; list at $130k implies a 664% gain — meaningful room to come down on a strong offer.
Risks & watch-outs
- Climate carrying-cost: severe wind risk, 99% chance of damaging wind over 30y; extreme-heat days projected 7→21/yr by 2055 (HVAC capex compounding) — expect insurance premiums to compound above CPI over the hold.
Questions for the listing agent
- It's been on market 51 days. Have you received any prior offers? Is the seller open to a 3% concession, seller financing, or rate buy-down credit?
- Built in 1976 — when were the roof, HVAC, electrical panel, plumbing, and water heater last replaced?
- What does the HOA fee cover, when was the last increase, and are there any pending special assessments or reserve-fund shortfalls?
- Is there a deadline driving the sale (1031 exchange, divorce, estate, relocation)? That informs how much negotiation room exists.
- Schools are F-rated, which usually means shorter tenancies and higher turnover. Who's the typical renter profile here, and what's been the actual vacancy rate?
- What's the average days-on-market for RENTAL listings here right now (not sales)? A rising rental-DOM trend means longer vacancies and softer asking-rent achievability than the comps imply.
- What's the recent tenant-quality profile in this submarket — average credit score on applications, eviction rate, late-payment / NSF rate, and stable-employment percentage? A property-management company in the area should have these aggregated.
- How much new for-sale + rental construction is in the pipeline within 1–3 miles? Heavy new supply typically softens prices + rents 12–24 months out; constrained supply supports both.
Investment metrics
- 1% rule
- 1.07% ✓
- Cap rate
- 8.83%
- Cash-on-cash
- 9.07%
- DSCR
- 1.40
- GRM
- 7.8
CMA / ARV
- ARV (on-the-fly)
- $139,104
- Comps found
- 2
Show comp detail 2 sales within ~0.75 mi
| Address | Dist | Beds/Ba | Sqft | Sold | Price | $/sf | Match |
|---|---|---|---|---|---|---|---|
| 118 Char Ln | 0.09mi | 3/1.0 (+1) | 672 (0%) | 2mo | $55,000 | $82 | 90 |
| 387 Crescent Lake Shore Dr | 0.10mi | 2/1.0 | 624 (-7%) | 15mo | $129,000 | $207 | 71 |
Match score weights: distance 35% · size 25% · config 20% · recency 20%. Top-matched comps best support the ARV.
Projected returns pro-forma
2.86% appreciation · 3.0% rent growth · sell at horizon
- IRR
- 15.6%
- Equity multiple
- 1.88×
- Total profit
- $32,177
- Equity at exit
- $57,389
- IRR
- 17.4%
- Equity multiple
- 3.51×
- Total profit
- $91,189
- Equity at exit
- $87,658
Cash invested: $36,372 (down + closing). Projections, not guarantees.
Landlord ↔ Tenant lean methodology
- Overall (STATE)
- 87 Strongly Landlord-Friendly
- State Florida
- 87 Strongly Landlord-Friendly · R+3
- County
- — inherits STATE
- City
- — inherits STATE
ZIP-level market 32112
- Home prices YoY
- 1.0%
- Active inventory
- 143
- Price-to-rent
- 7.8×
Monthly cashflow live
- Estimated rent
- $1,390 medium interval (Pro) →
- Mortgage (P&I)
- −$681
- Tax from tax record
- −$86 /mo · $1,027/yr
- Insurance
- −$54
- HOA
- −$2
- Vacancy / Maint / Mgmt
- −$292
- Net cashflow
- $275
Break-even live
UW: 25.0% down · 7.5% · 30yr · 1.5% tax · 5.0% vac · 8.0% maint · 8.0% mgmt
Financing live
Cash to close
- Down payment
- $32,475
- Closing costs
- $3,897
- Reserves months
- —
- Total cash needed
- —
Loan-product check · same deal, 3 products live
Conventional
25% down · 7.5% · 30yr
- Down + closing
- —
- Monthly P&I
- —
- Monthly cashflow
- —
- DSCR
- —
- Eligible?
- —
Personal DTI + credit; lowest rate.
DSCR
20% down · 8.5% · 30yr
- Down + closing
- —
- Monthly P&I
- —
- Monthly cashflow
- —
- DSCR
- —
- Eligible?
- —
No personal income docs; deal must DSCR.
Hard money
10% down · 12.0% · 12mo
- Down + closing
- —
- Monthly P&I
- —
- Monthly cashflow
- —
- DSCR
- —
- Eligible?
- —
Short-term bridge; refi at stabilization.
HOA detail
- Monthly dues
- $2 · $24/yr
Listing history 15 events
-
2026-06-18days on market $129,900 Active 51 DOM
-
2026-06-17days on market $129,900 Active 50 DOM
-
2026-06-16days on market $129,900 Active 49 DOM
-
2026-06-15days on market $129,900 Active 48 DOM
-
2026-06-13days on market $129,900 Active 46 DOM
-
2026-06-09days on market $129,900 Active 42 DOM
-
2026-06-08days on market $129,900 Active 41 DOM
-
2026-06-07days on market $129,900 Active 40 DOM
-
2026-06-05days on market $129,900 Active 37 DOM
-
2026-06-03days on market $129,900 Active 36 DOM
-
2026-06-02days on market $129,900 Active 35 DOM
-
2026-06-01days on market $129,900 Active 34 DOM
-
2026-05-31days on market $129,900 Active 33 DOM
-
2026-04-28$129,900 Active
-
1997-08-19soldstatus $17,000
ⓘ Source: listings_history table (triggers on properties + properties_extension) + one-shot
backfill from property_details.listing_events for pre-trigger history.
Tax reassessment forecast FL · Resets to sale price
- Current annual tax
- $1,027 · $86/mo
- Projected year-2 tax
- $1,078 · $90/mo
- Expected delta
- +$51/yr (+$4/mo · 5.0%)
ⓘ Screening estimate from a state-policy table — verify with the county assessor before closing.
Climate risk First Street
- Flood 1/10 Low FEMA zone X (unshaded) · 0% chance over 30 yrs
- Wildfire 4/10 Moderate
- Heat 9/10 Extreme 7 d/yr ≥108°F today · 21 d/yr by 30 yrs out
- Wind 9/10 Extreme 99% chance of damaging wind over 30 yrs
- Air quality 3/10 Moderate 3 unhealthy d/yr today · 3 by 30 yrs out
Nearby sold comps map
Loading sold comps map…
Walkable amenities ~0.75 mi
Loading nearby amenities…
Taxation est. · year 1
- Rental income
- $16,677
- − Mortgage interest
- −$7,276
- − Property taxes
- −$1,027
- − Insurance
- −$650
- − Repairs & maintenance
- −$1,334
- − Management
- −$1,334
- − HOA
- −$24
- − Depreciation
- −$3,779
- Taxable income
- $1,253
- Est. tax owed @ 24.0%
- −$301
- After-tax cash flow
- $2,999/yr
For passive investors: Depreciation is non-cash, so a rental often shows a tax loss while cash-flowing — sheltering income. Rental losses are passive: they offset passive income freely, and up to $25,000/yr can offset ordinary (W-2) income if you actively participate and your MAGI is under $100k (phasing out to $0 by $150k); unused losses carry forward. On sale, claimed depreciation is recaptured at up to 25%, and gains may owe capital-gains tax (a 1031 exchange can defer both). Figures are a year-1 estimate at your 24.0% rate — not tax advice; consult a CPA.
Schools (NCES district)
- District
- Putnam
- NCES district ID
- 1201620
- Math proficiency
- 34% ▼ -10.00%
- Reading proficiency
- 39% ▼ -4.00%
- Median HH income
- $33,350
- Composite
- 29.99/100
- National rank
- #6361
- State rank
- #66 of 73 in FL
Livability — Pomona Park
- Score
- 61/100
- State rank
- #774
- US rank
- #17514
Category grades
Schools grade is shown separately in the Schools card above.
Census & demographics
- City population
- 2,512
- Population (ZIP)
- 8,099
Population outlook (Putnam County) Hauer SSP2
- Today (2025)
- 65,299 people
- By 2030
- 61,255 · -6.2%
- By 2040
- 52,930 · -18.9%
- By 2050
- 45,051 · -31.0%
- By 2075
- 28,720 · -56.0%
- By 2100
- 15,852 · -75.7%
Race, ethnicity, and origin ACS 2023
- Neighborhood character
- Diverse neighborhood (Simpson 0.63)
- Race & ethnicity
- White 47% Hispanic / Latino 38% Two or more races 30% Black 8% Asian 3%
- Hispanic origin (detail)
- Mexican 34% Puerto Rican 2%
- Common ancestry
- Lithuanian 2% Romanian 2% Slovak 1%
- Foreign-born
- 20% · Canada
- Languages at home
- 64% English-only · Spanish 32% Other Asian/Pacific 3%
Political lean MEDSL · Putnam
- 2024 margin
- Solid R (+47.8) · D 25.8% · R 73.6%
- 2008→2024 swing
- -28.5pp toward R · 2008: -19.3pp · 2024: -47.8pp
- All cycles
- 2024: R+47.8 2020: R+41.2 2016: R+36.6 2012: R+24.5 2008: R+19.3
Not yet ingested
- Civics
- —
Market trends
- HPI YoY
- ▲ 2.86%
- Current HPI
- 279.58
- Rent YoY
- —
- Metro
- —
- State GDP YoY
- ▲ 3.28%
- F500 in state
- 36
Industry mix (Fortune 500 HQ in FL)
| Industry | F500 HQs | Revenue |
|---|---|---|
| Industrial Technology | 2 | $29B |
|
||
| Insurance | 2 | $17B |
|
||
| Retail | 1 | $60B |
|
||
| Technology Distribution | 1 | $58B |
|
||
| Homebuilding | 1 | $35B |
|
||
| Technology Manufacturing | 1 | $35B |
|
||
Price history
+664.1% since first listed2 events — show timeline
- 2026-04-28 Listed $129,900 realMLS
- 1997-08-19 Sold (Public Records) $17,000 Public Records
Property tax history
+4.7%/yrLatest (2025): $1,027 · +9.2% YoY. Source: county tax records.
Cash-flow waterfall
monthlySold comps — $/sqft
last 12 mo · ≤1 miLoading sold comps…