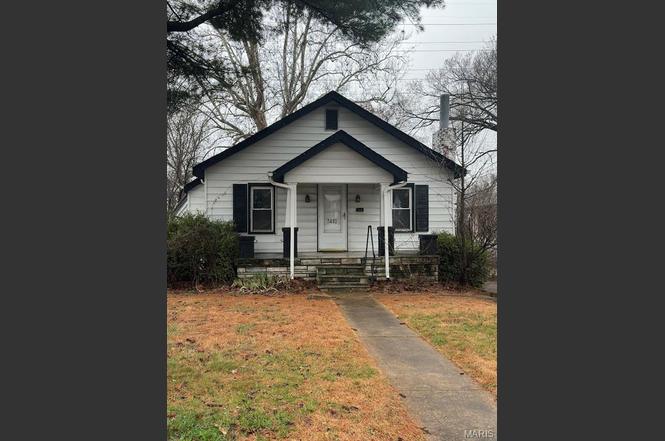
7410 Liberty Ave · University City, MO
Flood risk 1/10 · Minimal
- FEMA flood zone
- X (unshaded)
- Chance of flooding over 30 yrs
- 0.0%
- Est. flood insurance / yr
- $473 – $860
Fire risk 1/10 · Minimal
- Est. fire insurance / yr
- $1,054 – $1,958
Heat risk 5/10 · Moderate
- Hot days now (above 107°F)
- 7 days/yr
- Hot days in 30 yrs
- 21 days/yr
Wind risk 2/10 · Minimal
- Chance of severe wind over 30 yrs
- 1.0%
Air-quality risk 4/10 · Minor
- Unhealthy air days now
- 4 days/yr
- Unhealthy air days in 30 yrs
- 5 days/yr
Risk factors via First Street. Map © Google.
Why this score? — see what drove the B- grade
The composite is a weighted blend of 9 inputs, each scored 0–100. Each bar is that input's sub-score; the figure is the points it added to the 100-point composite (weight × sub-score).
- Cash flow +26.6/30.0
- ARV discount +15.0/15.0
- DSCR +9.1/10.0
- 1% rule +6.9/10.0
- Livability +3.7/5.0
- Rent growth +3.4/5.0
- Condition / age +2.5/5.0
- Schools +1.9/10.0
- Appreciation +0.0/10.0
$140,000
🖨 Deal sheet (PDF) 📄 Offer letter ✓ Due diligence
Listing remarks
Back on market through no fault of the seller. University City Occupancy has passed and ready for move in. Opportunity awaits in this 3 bedroom, 2 full bath home with great potential for buyers looking to make a property their own and take advantage of built-in sweat equity. A welcoming front porch adds charm and a great place to relax and watch the world go by. Inside, you’ll be greeted by hardwood floors adding warmth and character to the space. The generously sized kitchen offers plenty of space and opportunity to design the kitchen of your dreams. The primary bedroom includes its own full bathroom, offering added comfort and convenience. Situated on a large lot, the property offer
Key facts
- Front porch
- Fenced backyard
- Hardwood floors
Tags
Neighborhood map
What this means for you Summary
Snapshot
- This is a 2-bed/2.0-bath single-family listed at $140k.
Deal economics
- At list price, monthly cash flow is $376 ($5k/yr) — positive.
- The deal already cash-flows at list — no discount required.
- Meets the 1% rule at list price ($2k rent vs $140k).
- Cap rate 9.5% vs local median 4.4% in University City — top-decile yield for the area; either an underpriced asset or a hidden risk that comps aren't pricing in. Stress-test before assuming the spread holds.
Location & tenants
- Location reads 73/100 on livability (#84 in MO) — a middle-class / working-renter tenant base. Strengths: employment A+, housing A+, cost of living B; Watch: amenities D-, commute D-, health & safety F.
- University City (suburban): math 15% / reading 26% proficiency, ranked #297 of 324 in MO (top 92%) — low school quality limits family demand, transient renter base, plan for 1-2y turnover; 67% free/reduced lunch — lower-income household profile, screen leases tightly.
- Zoned schools: Barbara Jordan Elem. (math 8% / reading 22%, grade F, #982 of 1,115 statewide, top 89%, 310 students, 100% FRL); Brittany Woods (math 15% / reading 20%, grade F, #350 of 391 statewide, top 90%, 532 students, 100% FRL); University City Sr. High (math 5% / reading 52%, grade F, #409 of 521 statewide, top 79%, 726 students, 100% FRL) — zoned schools average 100% FRL vs 67% district-wide (32 pts higher); higher-poverty schools than district average — tighter screening recommended.
- Market conditions: Rents rising (+3.6%/yr); 163 active listings in the ZIP; 22 comparable units currently listed for rent nearby; rentals at typical pace (median 25d on market — plan ~3-4 weeks tenant-placement turnaround); 45% of comp listings sitting > 30 days — soft ceiling on asking rent; solid renter incomes; 920 units permitted in St. Louis County in 2024 (250 in 5+ unit buildings).
Forward outlook
- Local home prices are declining (-3.0%/yr); year-one equity from $968 of loan paydown is wiped out by about $4k of value loss. Plan a longer hold.
- At projected returns (-3.0% appreciation + 3.6% rent growth), your $39k cash investment doubles in ~10 years — after that, you're playing with house money.
Negotiation context
- Only 14 days on market — expect competitive offers; lowballing is unlikely to land.
- Current owner paid $120k; 17% above their basis — modest negotiation headroom, anchor on the comps not their cost.
Risks & watch-outs
- Watch-outs: built in 1924 — expect roof / HVAC / electrical / plumbing capex.
- Climate carrying-cost: extreme-heat days projected 7→21/yr by 2055 (HVAC capex compounding) — expect insurance premiums to compound above CPI over the hold.
Questions for the listing agent
- Built in 1924 — when were the roof, HVAC, electrical panel, plumbing, and water heater last replaced?
- Is there a deadline driving the sale (1031 exchange, divorce, estate, relocation)? That informs how much negotiation room exists.
- Schools are B-rated — typically a magnet for longer-tenancy family renters. What's the average tenant stay here, and is there a school-zone premium baked into asking?
- What's the average days-on-market for RENTAL listings here right now (not sales)? A rising rental-DOM trend means longer vacancies and softer asking-rent achievability than the comps imply.
- What's the recent tenant-quality profile in this submarket — average credit score on applications, eviction rate, late-payment / NSF rate, and stable-employment percentage? A property-management company in the area should have these aggregated.
- How much new for-sale + rental construction is in the pipeline within 1–3 miles? Heavy new supply typically softens prices + rents 12–24 months out; constrained supply supports both.
Investment metrics
- 1% rule
- 1.19% ✓
- Cap rate
- 9.51%
- Cash-on-cash
- 11.51%
- DSCR
- 1.51
- GRM
- 7.0
CMA / ARV
- ARV (on-the-fly)
- $223,798
- Comps found
- 12
Show comp detail 12 sales within ~0.75 mi
| Address | Dist | Beds/Ba | Sqft | Sold | Price | $/sf | Match |
|---|---|---|---|---|---|---|---|
| 1510 Westmont Pl | 0.34mi | 2/2.0 | 1,473 (-2%) | 0mo | $219,900 | $149 | 80 |
| 8220 Page Ave | 0.31mi | 2/1.0 | 1,512 (+1%) | 1mo | $99,999 | $66 | 80 |
| 7369 Trenton Ave | 0.11mi | 3/2.0 (+1) | 1,384 (-8%) | 3mo | $325,000 | $235 | 74 |
| 8109 Washington St | 0.26mi | 3/1.0 (+1) | 1,540 (+2%) | 6mo | $105,000 | $68 | 70 |
| 8103 Madison Ave | 0.30mi | 3/1.5 (+1) | 1,575 (+5%) | 2mo | $199,999 | $127 | 69 |
| 7511 Milan Ave | 0.19mi | 3/1.0 (+1) | 1,465 (-2%) | 12mo | $150,000 | $102 | 68 |
| 1550 N Jackson Ave | 0.34mi | 3/2.0 (+1) | 1,592 (+6%) | 13mo | $245,000 | $154 | 58 |
| 8000 Washington St | 0.18mi | 3/1.5 (+1) | 1,276 (-15%) | 2mo | $59,000 | $46 | 58 |
| 1310 Midland Dr | 0.61mi | 3/1.5 (+1) | 1,548 (+3%) | 2mo | $259,900 | $168 | 57 |
| 7576 Melrose Ave | 0.66mi | 2/1.0 | 1,410 (-6%) | 7mo | $214,900 | $152 | 49 |
| 1508 Quendo Ave | 0.46mi | 2/1.0 | 1,290 (-14%) | 6mo | $155,000 | $120 | 46 |
| 1311 Midland Dr | 0.59mi | 3/1.5 (+1) | 1,598 (+6%) | 11mo | $275,000 | $172 | 45 |
Match score weights: distance 35% · size 25% · config 20% · recency 20%. Top-matched comps best support the ARV.
Projected returns pro-forma
-3.0% appreciation · 3.61% rent growth · sell at horizon
- IRR
- 1.5%
- Equity multiple
- 1.06×
- Total profit
- $2,292
- Equity at exit
- $20,874
- IRR
- 11.7%
- Equity multiple
- 1.95×
- Total profit
- $37,132
- Equity at exit
- $12,105
Cash invested: $39,200 (down + closing). Projections, not guarantees.
Landlord ↔ Tenant lean methodology
- Overall (STATE)
- 81 Strongly Landlord-Friendly
- State Missouri
- 81 Strongly Landlord-Friendly · R+10
- County
- — inherits STATE
- City
- — inherits STATE
ZIP-level market 63130
- Rents YoY
- 3.6%
- Active inventory
- 163
- Price-to-rent
- 7.0×
Monthly cashflow live
- Estimated rent
- $1,666 high interval (Pro) →
- Mortgage (P&I)
- −$734
- Tax from tax record
- −$148 /mo · $1,774/yr
- Insurance
- −$58
- HOA
- −$0
- Vacancy / Maint / Mgmt
- −$350
- Net cashflow
- $376
Break-even live
Sensitivity live
| Price | -10% $455 | -5% $416 | +0% $376 | +5% $336 | +10% $297 |
|---|---|---|---|---|---|
| Rent | -10% $244 | -5% $310 | +0% $376 | +5% $442 | +10% $508 |
| Rate | -1.0pp $446 | -0.5pp $412 | base $376 | +0.5pp $340 | +1.0pp $303 |
UW: 25.0% down · 7.5% · 30yr · 1.5% tax · 5.0% vac · 8.0% maint · 8.0% mgmt
Financing live
Cash to close
- Down payment
- $35,000
- Closing costs
- $4,200
- Reserves months
- —
- Total cash needed
- —
Loan-product check · same deal, 3 products live
Conventional
25% down · 7.5% · 30yr
- Down + closing
- —
- Monthly P&I
- —
- Monthly cashflow
- —
- DSCR
- —
- Eligible?
- —
Personal DTI + credit; lowest rate.
DSCR
20% down · 8.5% · 30yr
- Down + closing
- —
- Monthly P&I
- —
- Monthly cashflow
- —
- DSCR
- —
- Eligible?
- —
No personal income docs; deal must DSCR.
Hard money
10% down · 12.0% · 12mo
- Down + closing
- —
- Monthly P&I
- —
- Monthly cashflow
- —
- DSCR
- —
- Eligible?
- —
Short-term bridge; refi at stabilization.
Rent comps 22 comps
| Address | Beds | Baths | Sqft | Rent | $/sqft | DOM | Units | Dist |
|---|---|---|---|---|---|---|---|---|
| 7430 Canton Ave Saint Louis, MO | 3.0 | 1.0 | 1075 | $1,450 | $1.35 | 25d | 1 | 0.38mi |
| 1351 N Hanley Rd Saint Louis, MO | 1.0–2.0 | 1.0–2.0 | 911 | $1,575 | $1.73 | 45d | 1 | 0.48mi |
| 7361 Melrose Ave Saint Louis, MO | 3.0 | 2.0 | 1278 | $2,095 | $1.64 | 45d | 1 | 0.65mi |
| 1108 N Hanley Rd St. Louis, MO | 3.0 | 2.0 | 1800 | $1,795 | $1.00 | 14d | 1 | 0.81mi |
| 7330 Ahern Ave Saint Louis, MO | 3.0 | 1.5 | 1872 | $2,450 | $1.31 | 45d | 1 | 0.99mi |
| 7720 Ahern Ave University City, MO | 2.0 | 1.0 | 1080 | $1,350 | $1.25 | 45d | 1 | 0.99mi |
| 1086 Wilshire Ave Saint Louis, MO | 2.0 | 1.0 | 1080 | $1,297 | $1.20 | 0d | 1 | 1.00mi |
| 7045 Plymouth Ave Saint Louis, MO | 3.0 | 2.0 | 1532 | $1,745 | $1.14 | 13d | 1 | 1.03mi |
| 7812 Drexel Dr Saint Louis, MO | 2.0 | 1.0 | 1100 | $1,450 | $1.32 | 0d | 1 | 1.15mi |
| 978 Warder Ave University City, MO | 3.0 | 1.5 | 1100 | $1,145 | $1.04 | 25d | 1 | 1.15mi |
| 6827 Melrose Ave Saint Louis, MO | 2.0 | 1.0 | 1200 | $1,300 | $1.08 | 9d | 1 | 1.22mi |
| 6913 Etzel Ave Unit 1496954P University City, MO | 3.0 | 2.0 | 1399 | $5,966 | $4.26 | 0d | 1 | 1.27mi |
| 7227 Balson Ave Saint Louis, MO | 3.0 | 2.0 | 1682 | $1,650 | $0.98 | 9d | 1 | 1.28mi |
| 7260 Dartmouth Ave Unit 1-West University City, MO | 3.0 | 2.0 | 1650 | $1,795 | $1.09 | 45d | 1 | 1.35mi |
| 7333 Amherst Ave Unit 1W University City, MO | 3.0 | 1.0 | 1600 | $2,350 | $1.47 | 45d | 1 | 1.40mi |
| 7254 Tulane Ave #1 University City, MO | 2.0 | 1.0 | 1144 | $1,600 | $1.40 | 19d | 1 | 1.40mi |
| 7350 Amherst Ave Unit 1E University City, MO | 2.0 | 1.0 | 1100 | $1,795 | $1.63 | 19d | 1 | 1.41mi |
| 7125 Dartmouth Ave Saint Louis, MO | 2.0 | 1.0 | 1242 | $1,550 | $1.25 | 45d | 1 | 1.43mi |
| 7204 Tulane Ave Unit 7204-B Tulane University City, MO | 2.0 | 1.0 | 1100 | $1,100 | $1.00 | 45d | 1 | 1.44mi |
| 7120 Dartmouth Ave Unit A University City, MO | 2.0 | 1.0 | 1200 | $1,345 | $1.12 | 4d | 1 | 1.46mi |
| 7055 Dartmouth Ave Unit 1 University City, MO | 2.0 | 1.0 | 1320 | $2,100 | $1.59 | 45d | 1 | 1.46mi |
| 7055 Dartmouth Ave Unit 2 University City, MO | 2.0 | 1.0 | 1320 | $2,100 | $1.59 | 45d | 1 | 1.46mi |
Listing history 6 events
-
2026-06-13statusdays on market $140,000 Pending 14 DOM
-
2026-06-13days on market $140,000 Active 13 DOM
-
2026-06-10status $140,000 Active 10 DOM
-
2026-03-16status Pending
-
2026-03-06$140,000 Active
-
2006-01-20soldstatus $119,900
ⓘ Source: listings_history table (triggers on properties + properties_extension) + one-shot
backfill from property_details.listing_events for pre-trigger history.
Tax reassessment forecast MO · Resets to sale price
- Current annual tax
- $1,774 · $148/mo
- Projected year-2 tax
- $1,774 · $148/mo
- Expected delta
- $0/yr ($0/mo · 0.0%)
ⓘ Screening estimate from a state-policy table — verify with the county assessor before closing.
Climate risk First Street
- Flood 1/10 Low FEMA zone X (unshaded) · 0% chance over 30 yrs
- Wildfire 1/10 Low
- Heat 5/10 Major 7 d/yr ≥107°F today · 21 d/yr by 30 yrs out
- Wind 2/10 Low 100% chance of damaging wind over 30 yrs
- Air quality 4/10 Moderate 4 unhealthy d/yr today · 5 by 30 yrs out
Nearby sold comps map
Loading sold comps map…
Walkable amenities ~0.75 mi
Loading nearby amenities…
Taxation est. · year 1
- Rental income
- $19,994
- − Mortgage interest
- −$7,842
- − Property taxes
- −$1,774
- − Insurance
- −$700
- − Repairs & maintenance
- −$1,600
- − Management
- −$1,600
- − Depreciation
- −$4,073
- Taxable income
- $2,406
- Est. tax owed @ 24.0%
- −$577
- After-tax cash flow
- $3,933/yr
For passive investors: Depreciation is non-cash, so a rental often shows a tax loss while cash-flowing — sheltering income. Rental losses are passive: they offset passive income freely, and up to $25,000/yr can offset ordinary (W-2) income if you actively participate and your MAGI is under $100k (phasing out to $0 by $150k); unused losses carry forward. On sale, claimed depreciation is recaptured at up to 25%, and gains may owe capital-gains tax (a 1031 exchange can defer both). Figures are a year-1 estimate at your 24.0% rate — not tax advice; consult a CPA.
Schools (NCES district)
- District
- University City
- NCES district ID
- 2930660
- Math proficiency
- 15% ▼ -10.00%
- Reading proficiency
- 26% ▼ -7.00%
- Median HH income
- $52,927
- Composite
- 18.57/100
- National rank
- #8910
- State rank
- #297 of 324 in MO
Livability — University City
- Score
- 73/100
- State rank
- #84
- US rank
- #5618
Category grades
Schools grade is shown separately in the Schools card above.
Census & demographics
- Census place
- University City, MO
- County
- Saint Louis County · 888,823 people
- City population
- 28,910
- Metro
- St. Louis, MO-IL
- Population (ZIP)
- 28,910
- Household income
- $85,823
- Rent vs Own
- Severe rent burden
- 893.0
Population outlook (St. Louis County) Hauer SSP2
- Today (2025)
- 1,025,227 people
- By 2030
- 1,028,023 · +0.3%
- By 2040
- 1,020,940 · -0.4%
- By 2050
- 1,007,280 · -1.8%
- By 2075
- 987,277 · -3.7%
- By 2100
- 921,984 · -10.1%
Race, ethnicity, and origin ACS 2023
- Neighborhood character
- Diverse neighborhood (Simpson 0.61)
- Race & ethnicity
- White 54% Black 31% Asian 6% Two or more races 6% Hispanic / Latino 4%
- Common ancestry
- Italian 3% Romanian 3% Lithuanian 2%
- Foreign-born
- 11% · China, Canada, Vietnam
- Languages at home
- 89% English-only · Chinese 4% Spanish 2% French/Haitian/Cajun 1%
Political lean MEDSL · St. Louis
- 2024 margin
- Strong D (+23.4) · D 60.8% · R 37.4% · Other 1.7%
- 2008→2024 swing
- +3.5pp toward D · 2008: 19.9pp · 2024: 23.4pp
- All cycles
- 2024: D+23.4 2020: D+24.0 2016: D+16.2 2012: D+13.7 2008: D+19.9
Not yet ingested
- Civics
- —
Market trends
- HPI YoY
- ▼ -436.88%
- Current HPI
- 185.599
- Rent YoY
- ▲ 3.61%
- Metro
- St. Louis, MO-IL
- State GDP YoY
- ▲ 1.84%
- F500 in state
- 20
Industry mix (Fortune 500 HQ in MO)
| Industry | F500 HQs | Revenue |
|---|---|---|
| Healthcare | 1 | $163B |
|
||
| Insurance | 1 | $21B |
|
||
| Industrial Technology | 1 | $17B |
|
||
| Retail | 1 | $16B |
|
||
| Industrial Distribution | 1 | $10B |
|
||
| Utilities | 1 | $9B |
|
||
Price history
+16.8% since first listed3 events — show timeline
- 2026-03-16 Pending — MARIS as Distributed by MLS Grid
- 2026-03-06 Listed $140,000 MARIS as Distributed by MLS Grid
- 2006-01-20 Sold (Public Records) $119,900 Public Records
Property tax history
+2.8%/yrLatest (2022): $1,774 · +1.0% YoY. Source: county tax records.
Cash-flow waterfall
monthlySold comps — $/sqft
last 12 mo · ≤1 miLoading sold comps…