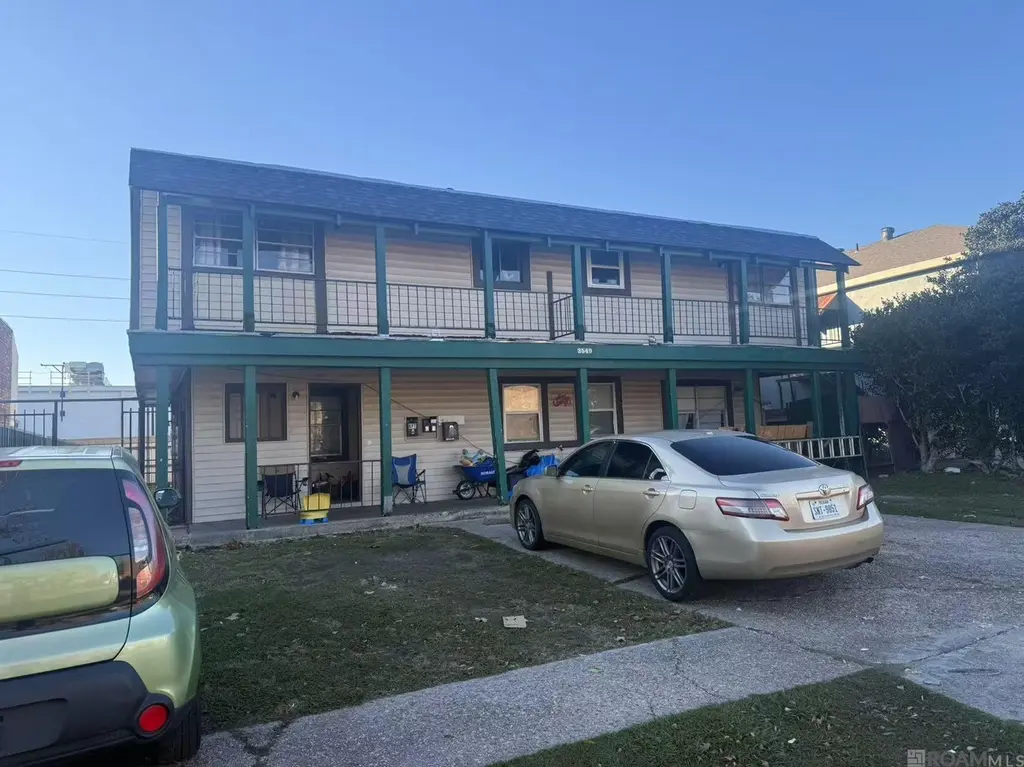
 Fourplex
3549 Martinique Ave · Kenner, LA
Flood risk 8/10 · Major
- FEMA flood zone
- AE
- Chance of flooding over 30 yrs
- 0.6%
- Est. flood insurance / yr
- $1,737 – $8,500
Fire risk 1/10 · Minimal
- Est. fire insurance / yr
- $1,269 – $2,357
Heat risk 10/10 · Severe
- Hot days now (above 108°F)
- 7 days/yr
- Hot days in 30 yrs
- 20 days/yr
Wind risk 10/10 · Severe
- Chance of severe wind over 30 yrs
- 99.0%
Air-quality risk 3/10 · Minor
- Unhealthy air days now
- 2 days/yr
- Unhealthy air days in 30 yrs
- 3 days/yr
Risk factors via First Street. Map © Google.
Why this score? — see what drove the C+ grade
The composite is a weighted blend of 9 inputs, each scored 0–100. Each bar is that input's sub-score; the figure is the points it added to the 100-point composite (weight × sub-score).
- Cash flow +30.0/30.0
- 1% rule +10.0/10.0
- DSCR +10.0/10.0
- Livability +3.9/5.0
- Schools +2.5/10.0
- Condition / age +2.5/5.0
- Rent growth +1.5/5.0
- ARV discount +0.0/15.0
- Appreciation +0.0/10.0
$399,000
🖨 Deal sheet 📄 Offer letter ✓ Due diligence
Multi-family units
County records classify this as Multi-Family (2-4 Unit). Listing-text estimate: 4 units. confirmed
Listing remarks
Fourplex apartment building in high demand area; Potential rental increase; Well established neighborhood; Easy access to major traffic; Good for investors as well as owner occupy.
Key facts
- High demand area
- 7,187 sq ft lot
- 6 parking spots
Tags
Property features AI
Exterior
- Parking: 6 parking spaces
- Utilities: Public water; Public sewer
- Home design: Residential income property; Quadruplex
- Construction: Brick, metal siding, and other exterior materials; Slab foundation
- Exterior features: 60 x 120 lot dimensions; Lot area approximately 7,187.4 sq ft
Interior
- Kitchen: Dishwasher; Disposal; Refrigerator
- Heating & cooling: Central heating; Central air conditioning
- Interior features: Dryer; Dishwasher; Disposal; Refrigerator
- Laundry & utility: Dryer
Neighborhood map
What this means for you Summary
Snapshot
- This is a 4 × 2-bed/1-bath units multifamily listed at $399k.
Deal economics
- At list price, monthly cash flow is $2k ($25k/yr) — positive. Per door: $526/mo.
- The deal already cash-flows at list — no discount required.
- Meets the 1% rule at list price ($6k rent vs $399k).
- Recommended offer: $393k (1.5% below list) — sets the bar for market timing.
- Cap rate 13.9% vs local median 5.3% in Kenner — top-decile yield for the area; either an underpriced asset or a hidden risk that comps aren't pricing in. Stress-test before assuming the spread holds.
Location & tenants
- Location reads 78/100 on livability (#6 in LA, #2,414 nationally) — a middle-class / working-renter tenant base. Strengths: cost of living A+, housing A+, health & safety A+; Watch: amenities C-, employment C-, crime D.
- Jefferson Parish (suburban): math 24% / reading 34% proficiency, ranked #44 of 98 in LA (top 45%) — low school quality limits family demand, transient renter base, plan for 1-2y turnover; 70% free/reduced lunch — lower-income household profile, screen leases tightly.
- Market conditions: Rents falling (-4.2%/yr); 292 active listings in the ZIP; 2 comparable units currently listed for rent nearby; 518 units permitted in Jefferson Parish in 2024 (43 in 5+ unit buildings).
- At $6,285/mo this rent would consume 112% of the median local household income ($67k/yr) (locally 1906% of renters already pay >50% of income on rent) — very limited rent-growth headroom before tenants either downsize or default.
Forward outlook
- Local home prices are declining (-3.0%/yr); year-one equity from $3k of loan paydown is wiped out by about $12k of value loss. Plan a longer hold.
- At projected returns (-3.0% appreciation + 0.0% rent growth), your $112k cash investment doubles in ~7 years — after that, you're playing with house money.
Negotiation context
- It's been on market 26 days — a 2% lower offer ($393k) is reasonable based on typical stale-listing flexibility.
- 13 sale attempts since 33y ago with the ask held roughly flat each time — persistent listings suggest the price (not the market) is what's stuck; bring a comps-based counter.
- Current owner paid $294k; 36% above their basis — modest negotiation headroom, anchor on the comps not their cost.
Risks & watch-outs
- Watch-outs: flood insurance adds $427/mo.
- Climate carrying-cost: in FEMA flood zone AE (mandatory federal flood insurance); severe wind risk, 99% chance of damaging wind over 30y; extreme-heat days projected 7→20/yr by 2055 (HVAC capex compounding) — expect insurance premiums to compound above CPI over the hold.
Questions for the listing agent
- Can we see the unit-by-unit rent roll, current vacancy, and any below-market leases? What's the average tenancy length?
- What capital expenditures (roof, boiler, parking lot, exteriors) have been made in the last 5 years, and what's planned in the next 2?
- What's the actual annual flood-insurance premium (NFIP or private), and is the property in a SFHA with mandatory coverage?
- Is there a deadline driving the sale (1031 exchange, divorce, estate, relocation)? That informs how much negotiation room exists.
- Crime grade is D in this area — have there been break-ins, vandalism, or insurance claims at this property in the last 3 years? What carrier currently insures it and at what premium?
- What's the average days-on-market for RENTAL listings here right now (not sales)? A rising rental-DOM trend means longer vacancies and softer asking-rent achievability than the comps imply.
- What's the recent tenant-quality profile in this submarket — average credit score on applications, eviction rate, late-payment / NSF rate, and stable-employment percentage? A property-management company in the area should have these aggregated.
- How much new apartment / multifamily construction is in the pipeline within 1–3 miles? Heavy new supply (>2% of stock underway) typically softens rents 12–24 months out; light construction supports rent growth.
Investment metrics
- 1% rule
- 1.58% ✓
- Cap rate
- 13.91%
- Cash-on-cash
- 27.19%
- DSCR
- 2.21
- GRM
- 5.3
CMA / ARV
- ARV (on-the-fly)
- $321,480
- Comps found
- 3
Show comp detail 3 sales within ~0.75 mi
| Address | Dist | Beds/Ba | Sqft | Sold | Price | $/sf | Match |
|---|---|---|---|---|---|---|---|
| 3708 Martinique St | 0.21mi | 8/4.0 | 4,000 (-5%) | 22mo | $454,000 | $114 | 62 |
| 3213 Idaho Ave | 0.43mi | —/— | 3,739 (-12%) | 15mo | $286,000 | $76 | 48 |
| 3209 Idaho Ave | 0.44mi | 6/7.5 | 3,739 (-12%) | 15mo | $256,300 | $69 | 48 |
Match score weights: distance 35% · size 25% · config 20% · recency 20%. Top-matched comps best support the ARV.
Projected returns pro-forma
-3.0% appreciation · 0.0% rent growth · sell at horizon
- IRR
- 12.0%
- Equity multiple
- 1.46×
- Total profit
- $51,158
- Equity at exit
- $59,492
- IRR
- 18.4%
- Equity multiple
- 2.31×
- Total profit
- $146,650
- Equity at exit
- $34,498
Cash invested: $111,720 (down + closing). Projections, not guarantees.
Landlord ↔ Tenant lean methodology
- Overall (STATE)
- 90 Strongly Landlord-Friendly
- State Louisiana
- 90 Strongly Landlord-Friendly · R+12
- County
- — inherits STATE
- City
- — inherits STATE
ZIP-level market 70065
- Rents YoY
- -4.2%
- Active inventory
- 292
- Price-to-rent
- 21.2×
Monthly cashflow live
- Estimated rent
- $6,285 high interval (Pro) →
- Mortgage (P&I)
- −$2,092
- Tax from tax record
- −$175 /mo · $2,098/yr
- Insurance
- −$166
- Flood insurance flood zone
- −$427 /mo · $5,118/yr
- HOA
- −$0
- Vacancy / Maint / Mgmt
- −$1,320
- Net cashflow
- $2,105
Break-even live
4-unit breakdown (identical units grouped — click to expand)
| Units | Beds | Baths | Est. rent |
|---|---|---|---|
| 4× units | 2 | 1 | $6,284 |
| #1 | 2 | 1 | $1,571 |
| #2 | 2 | 1 | $1,571 |
| #3 | 2 | 1 | $1,571 |
| #4 | 2 | 1 | $1,571 |
| Total (4 units) | $6,285 | ||
UW: 25.0% down · 7.5% · 30yr · 1.5% tax · 5.0% vac · 8.0% maint · 8.0% mgmt
Financing live
Cash to close
- Down payment
- $99,750
- Closing costs
- $11,970
- Reserves months
- —
- Total cash needed
- —
Loan-product check · same deal, 3 products live
Conventional
25% down · 7.5% · 30yr
- Down + closing
- —
- Monthly P&I
- —
- Monthly cashflow
- —
- DSCR
- —
- Eligible?
- —
Personal DTI + credit; lowest rate.
DSCR
20% down · 8.5% · 30yr
- Down + closing
- —
- Monthly P&I
- —
- Monthly cashflow
- —
- DSCR
- —
- Eligible?
- —
No personal income docs; deal must DSCR.
Hard money
10% down · 12.0% · 12mo
- Down + closing
- —
- Monthly P&I
- —
- Monthly cashflow
- —
- DSCR
- —
- Eligible?
- —
Short-term bridge; refi at stabilization.
Rent comps 2 comps
| Address | Beds | Baths | Sqft | Rent | $/sqft | DOM | Units | Dist |
|---|---|---|---|---|---|---|---|---|
| 114 Gelpi Ave Unit 1 Kenner, LA | 3.0 | 2.0 | 3000 | $2,450 | $0.82 | 44d | 1 | 0.46mi |
| 18 Rue Grenoble Kenner, LA | 3.0 | 2.0 | 3600 | $2,600 | $0.72 | 17d | 1 | 1.15mi |
Listing history 32 events
-
2026-06-18days on market $399,000 Active 26 DOM
-
2026-06-17days on market $399,000 Active 25 DOM
-
2026-06-16days on market $399,000 Active 24 DOM
-
2026-06-15days on market $399,000 Active 23 DOM
-
2026-06-13days on market $399,000 Active 21 DOM
-
2026-06-10days on market $399,000 Active 18 DOM
-
2026-06-09days on market $399,000 Active 17 DOM
-
2026-06-08days on market $399,000 Active 16 DOM
-
2026-06-07days on market $399,000 Active 15 DOM
-
2026-06-03days on market $399,000 Active 11 DOM
-
2026-06-02days on market $399,000 Active 10 DOM
-
2026-06-01days on market $399,000 Active 9 DOM
-
2026-05-31days on market $399,000 Active 8 DOM
-
2026-05-24$399,000 Active
-
2025-01-25$499,000 Active
-
2025-01-25$499,000 Active
-
2008-09-08soldstatus $294,000
-
2008-08-27soldstatus
-
2008-07-21$299,000
-
2008-07-21$299,000
-
2008-07-21$299,000
-
2008-07-21$299,000
-
2007-11-26$299,000
-
2007-11-26$299,000
-
2005-12-02soldstatus $206,000
-
2005-08-18soldstatus
-
2005-04-28$228,000
-
2005-04-28$228,000
-
1994-04-01soldstatus $82,500
-
1994-03-08soldstatus
-
1993-08-12$86,500
-
1993-08-12$86,500
ⓘ Source: listings_history table (triggers on properties + properties_extension) + one-shot
backfill from property_details.listing_events for pre-trigger history.
Tax reassessment forecast LA · Resets to sale price
- Current annual tax
- $2,098 · $175/mo
- Projected year-2 tax
- $2,194 · $183/mo
- Expected delta
- +$96/yr (+$8/mo · 4.6%)
ⓘ Screening estimate from a state-policy table — verify with the county assessor before closing.
Climate risk First Street
- Flood 8/10 Severe FEMA zone AE · 60% chance over 30 yrs
- Wildfire 1/10 Low
- Heat 10/10 Extreme 7 d/yr ≥108°F today · 20 d/yr by 30 yrs out
- Wind 10/10 Extreme 99% chance of damaging wind over 30 yrs
- Air quality 3/10 Moderate 2 unhealthy d/yr today · 3 by 30 yrs out
Nearby sold comps map
Loading sold comps map…
Walkable amenities ~0.75 mi
Loading nearby amenities…
Taxation est. · year 1
- Rental income
- $75,420
- − Mortgage interest
- −$22,350
- − Property taxes
- −$2,098
- − Insurance
- −$7,114
- − Repairs & maintenance
- −$6,034
- − Management
- −$6,034
- − Depreciation
- −$11,607
- Taxable income
- $20,183
- Est. tax owed @ 24.0%
- −$4,844
- After-tax cash flow
- $20,417/yr
For passive investors: Depreciation is non-cash, so a rental often shows a tax loss while cash-flowing — sheltering income. Rental losses are passive: they offset passive income freely, and up to $25,000/yr can offset ordinary (W-2) income if you actively participate and your MAGI is under $100k (phasing out to $0 by $150k); unused losses carry forward. On sale, claimed depreciation is recaptured at up to 25%, and gains may owe capital-gains tax (a 1031 exchange can defer both). Figures are a year-1 estimate at your 24.0% rate — not tax advice; consult a CPA.
Schools (NCES district)
- District
- Jefferson Parish
- NCES district ID
- 2200840
- Math proficiency
- 24% ▼ -36.00%
- Reading proficiency
- 34% ▼ -30.00%
- Median HH income
- $48,421
- Composite
- 25.19/100
- National rank
- #7511
- State rank
- #44 of 98 in LA
Livability — Kenner
- Score
- 78/100
- State rank
- #6
- US rank
- #2414
Category grades
Schools grade is shown separately in the Schools card above.
Census & demographics
- Census place
- Kenner, LA
- County
- Jefferson Parish · 426,999 people
- City population
- 66,707
- Metro
- New Orleans-Metairie, LA
- Population (ZIP)
- 48,936
- Household income
- $67,285
- Rent vs Own
- Severe rent burden
- 1906.0
Population outlook (Jefferson County) Hauer SSP2
- Today (2025)
- 451,696 people
- By 2030
- 455,451 · +0.8%
- By 2040
- 458,308 · +1.5%
- By 2050
- 461,031 · +2.1%
- By 2075
- 476,351 · +5.5%
- By 2100
- 499,377 · +10.6%
Race, ethnicity, and origin ACS 2023
- Neighborhood character
- Diverse neighborhood (Simpson 0.69)
- Race & ethnicity
- White 47% Hispanic / Latino 27% Two or more races 15% Black 15% Asian 6%
- Hispanic origin (detail)
- Mexican 2% Puerto Rican 3% Cuban 2%
- Common ancestry
- Lithuanian 9% Slovak 1% Italian 1%
- Foreign-born
- 19% · Canada, China, Vietnam
- Languages at home
- 72% English-only · Spanish 21% Other Indo-European 3% Arabic 1%
Political lean MEDSL · Jefferson
- 2024 margin
- R (+12.9) · D 42.5% · R 55.5% · Other 2.1%
- 2008→2024 swing
- +13.6pp toward D · 2008: -26.6pp · 2024: -12.9pp
- All cycles
- 2024: R+12.9 2020: R+11.1 2016: R+14.8 2012: R+18.4 2008: R+26.6
Not yet ingested
- Civics
- —
Market trends
- HPI YoY
- ▼ -214.79%
- Current HPI
- 139.5115
- Rent YoY
- ▼ -4.19%
- Metro
- New Orleans-Metairie, LA
- State GDP YoY
- ▲ 3.29%
- F500 in state
- 10
Industry mix (Fortune 500 HQ in LA)
| Industry | F500 HQs | Revenue |
|---|---|---|
| Telecommunications | 2 | $23B |
|
||
| Utilities | 1 | $12B |
|
||
| Wholesale / Distribution | 1 | $5B |
|
||
| Advertising | 1 | $2B |
|
||
Price history
+361.3% since first listed19 events — show timeline
- 2026-05-24 Listed $399,000 GBRMLS
- 2025-01-25 Listed $499,000 GBRMLS
- 2025-01-25 Listed $499,000 AcadianaMLS
- 2008-09-08 Sold (Public Records) $294,000 Public Records
- 2008-08-27 Sold (MLS) — GSREIN
- 2008-07-21 Listed $299,000 GSREIN
- 2008-07-21 Listed $299,000 AcadianaMLS
- 2008-07-21 Listed $299,000 GSREIN
- 2008-07-21 Listed $299,000 AcadianaMLS
- 2007-11-26 Listed $299,000 GSREIN
- 2007-11-26 Listed $299,000 AcadianaMLS
- 2005-12-02 Sold (Public Records) $206,000 Public Records
- 2005-08-18 Sold (MLS) — GSREIN
- 2005-04-28 Listed $228,000 GSREIN
- 2005-04-28 Listed $228,000 AcadianaMLS
- 1994-04-01 Sold (Public Records) $82,500 Public Records
- 1994-03-08 Sold (MLS) — GSREIN
- 1993-08-12 Listed $86,500 GSREIN
- 1993-08-12 Listed $86,500 AcadianaMLS
Property tax history
-1.6%/yrLatest (2025): $2,098 · -0.4% YoY. Source: county tax records.
Cash-flow waterfall
monthlySold comps — $/sqft
last 12 mo · ≤1 miLoading sold comps…