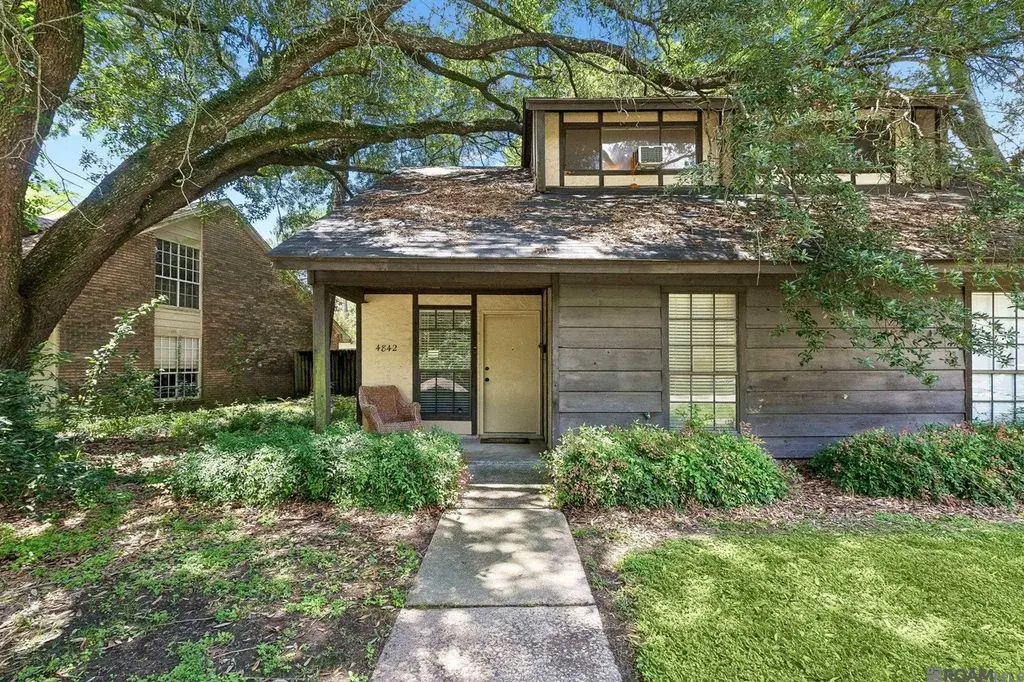
4842 Alvin Dark Ave · Baton Rouge, LA
Flood risk 1/10 · Minimal
- FEMA flood zone
- X
- Chance of flooding over 30 yrs
- 0.0%
- Est. flood insurance / yr
- $507 – $1,088
Fire risk 1/10 · Minimal
- Est. fire insurance / yr
- $1,269 – $2,357
Heat risk 8/10 · Major
- Hot days now (above 108°F)
- 7 days/yr
- Hot days in 30 yrs
- 20 days/yr
Wind risk 9/10 · Severe
- Chance of severe wind over 30 yrs
- 99.0%
Air-quality risk 2/10 · Minimal
- Unhealthy air days now
- 1 days/yr
- Unhealthy air days in 30 yrs
- 1 days/yr
Risk factors via First Street. Map © Google.
Why this score? — see what drove the B- grade
The composite is a weighted blend of 9 inputs, each scored 0–100. Each bar is that input's sub-score; the figure is the points it added to the 100-point composite (weight × sub-score).
- Cash flow +27.4/30.0
- ARV discount +11.2/15.0
- DSCR +9.6/10.0
- 1% rule +6.9/10.0
- Livability +3.7/5.0
- Rent growth +3.2/5.0
- Condition / age +2.5/5.0
- Schools +2.4/10.0
- Appreciation +0.0/10.0
$129,900
🖨 Deal sheet 📄 Offer letter ✓ Due diligence
Listing remarks MLS
Welcome to Sharlo Townhomes! ROOF REPLACED IN SEPT 2022 AND NEW AMERICAN STANDARD AC UNIT REPLACED IN 2025! Just minutes from LSU's Campus and on the LSU BUS ROUTE, this townhome is both convenient and comfortable! When you walk in, the living area greets you with soaring cathedral ceilings and loads of natural light. All appliances will remain in the kitchen, and it is accompanied by a small breakfast room that overlooks the back yard. The back offers a private shaded yard with several fruit trees and a double carport! Downstairs offers one bedroom and one bathroom, and an additional bedroom and bathroom are upstairs. Also there is a loft upstairs that could be used for an office or hangout space. Come tour this home and see yourself living here!
Key facts
- New ac unit
- Breakfast room
- Private shaded yard
Tags
Property features AI
Exterior
- Parking: 2 total parking spaces; 2-car carport
- Security: Security system
- Utilities: Cable connected
- Home design: Attached single-family residence (half duplex); Residential property
- Construction: Wood siding, frame, and brick construction; Composition roof; Slab foundation; Built with attached design
- Exterior features: Deck; Shed(s); Full wood fencing
Interior
- Kitchen: Range; Oven; Dishwasher; Garbage disposal; Microwave; Refrigerator
- Flooring: Tile; Ceramic tile; Laminate
- Bathrooms: 2 full bathrooms
- Heating & cooling: Central heating; Central air; Ceiling fans
- Interior features: Cathedral ceilings; Breakfast bar; High ceilings; Lighting
- Laundry & utility: Washer; Dryer
Neighborhood map
What this means for you Summary
Snapshot
- This is a 2-bed/2.0-bath single-family listed at $130k.
Deal economics
- At list price, monthly cash flow is $379 ($5k/yr) — positive.
- The deal already cash-flows at list — no discount required.
- Meets the 1% rule at list price ($2k rent vs $130k).
- Recommended offer: $128k (1.5% below list) — sets the bar for market timing.
- Cap rate 9.8% vs local median 4.3% in Baton Rouge — top-decile yield for the area; either an underpriced asset or a hidden risk that comps aren't pricing in. Stress-test before assuming the spread holds.
Location & tenants
- Location reads 74/100 on livability (#24 in LA, #4,535 nationally) — a middle-class / working-renter tenant base. Strengths: commute A+, cost of living A+, health & safety A+; Watch: amenities D, crime F, employment D-.
- East Baton Rouge Parish (urban): math 22% / reading 34% proficiency, ranked #47 of 98 in LA (top 48%) — low school quality limits family demand, transient renter base, plan for 1-2y turnover; 77% free/reduced lunch — lower-income household profile, screen leases tightly.
- Market conditions: Rents rising (+2.8%/yr); 315 active listings in the ZIP; 40 comparable units currently listed for rent nearby; rentals at typical pace (median 23d on market — plan ~3-4 weeks tenant-placement turnaround); 2,252 units permitted in East Baton Rouge Parish in 2024 (440 in 5+ unit buildings).
- This rent runs 39% of the median local income ($47k/yr) — at the standard rent-burdened threshold; future hikes will face affordability resistance.
Forward outlook
- Local home prices are declining (-3.0%/yr); year-one equity from $898 of loan paydown is wiped out by about $4k of value loss. Plan a longer hold.
- East Baton Rouge County population projected at +4% by 2050 — modest demand growth; plan on rents tracking national, not racing it.
- At projected returns (-3.0% appreciation + 2.8% rent growth), your $36k cash investment doubles in ~10 years — after that, you're playing with house money.
Negotiation context
- It's been on market 16 days — a 2% lower offer ($128k) is reasonable based on typical stale-listing flexibility.
- 11 sale attempts since 21y ago with the ask held roughly flat each time — persistent listings suggest the price (not the market) is what's stuck; bring a comps-based counter.
- Current owner paid $100k; 30% above their basis — modest negotiation headroom, anchor on the comps not their cost.
Risks & watch-outs
- Climate carrying-cost: severe wind risk, 99% chance of damaging wind over 30y; extreme-heat days projected 7→20/yr by 2055 (HVAC capex compounding) — expect insurance premiums to compound above CPI over the hold.
Questions for the listing agent
- Is there a deadline driving the sale (1031 exchange, divorce, estate, relocation)? That informs how much negotiation room exists.
- Crime grade is F in this area — have there been break-ins, vandalism, or insurance claims at this property in the last 3 years? What carrier currently insures it and at what premium?
- What's the average days-on-market for RENTAL listings here right now (not sales)? A rising rental-DOM trend means longer vacancies and softer asking-rent achievability than the comps imply.
- What's the recent tenant-quality profile in this submarket — average credit score on applications, eviction rate, late-payment / NSF rate, and stable-employment percentage? A property-management company in the area should have these aggregated.
- How much new for-sale + rental construction is in the pipeline within 1–3 miles? Heavy new supply typically softens prices + rents 12–24 months out; constrained supply supports both.
Investment metrics
- 1% rule
- 1.19% ✓
- Cap rate
- 9.79%
- Cash-on-cash
- 12.49%
- DSCR
- 1.56
- GRM
- 7.0
CMA / ARV
- ARV (on-the-fly)
- $141,414
- Comps found
- 12
Show comp detail 12 sales within ~0.75 mi
| Address | Dist | Beds/Ba | Sqft | Sold | Price | $/sf | Match |
|---|---|---|---|---|---|---|---|
| 2405 Brightside Dr Apt 64 | 0.39mi | 2/2.5 | 1,300 (+2%) | 0mo | $168,000 | $129 | 76 |
| 1361 Harwich Dr | 0.27mi | 3/2.0 (+1) | 1,272 (-0%) | 9mo | $210,000 | $165 | 75 |
| 1557 Sharlo Ave | 0.19mi | 2/2.0 | 1,328 (+4%) | 15mo | $134,900 | $102 | 72 |
| 1318 Sharlo Ave | 0.12mi | 2/2.0 | 1,363 (+7%) | 14mo | $156,000 | $114 | 71 |
| 2450 Brightside Dr | 0.27mi | 2/2.0 | 1,310 (+3%) | 15mo | $139,900 | $107 | 70 |
| 1270 Sharlo Ave | 0.10mi | 2/2.0 | 1,465 (+15%) | 1mo | $140,000 | $96 | 70 |
| 1550 Sharlo Ave | 0.24mi | 2/2.0 | 1,379 (+8%) | 7mo | $123,500 | $90 | 69 |
| 2142 Brightside Dr | 0.18mi | 2/2.0 | 1,379 (+8%) | 15mo | $139,900 | $101 | 66 |
| 1578 Sharlo Ave | 0.25mi | 2/2.0 | 1,333 (+5%) | 20mo | $165,000 | $124 | 64 |
| 1517 Sharlo Ave | 0.16mi | 2/2.0 | 1,444 (+13%) | 9mo | $120,000 | $83 | 63 |
| 1512 Sharlo Ave | 0.23mi | 3/2.0 (+1) | 1,355 (+6%) | 15mo | $149,900 | $111 | 62 |
| 2114 Mt Hope Aly | 0.34mi | 2/2.5 | 1,374 (+8%) | 15mo | $172,000 | $125 | 57 |
Match score weights: distance 35% · size 25% · config 20% · recency 20%. Top-matched comps best support the ARV.
Projected returns pro-forma
-3.0% appreciation · 2.79% rent growth · sell at horizon
- IRR
- 2.0%
- Equity multiple
- 1.07×
- Total profit
- $2,723
- Equity at exit
- $19,369
- IRR
- 11.3%
- Equity multiple
- 1.88×
- Total profit
- $32,045
- Equity at exit
- $11,231
Cash invested: $36,372 (down + closing). Projections, not guarantees.
Landlord ↔ Tenant lean methodology
- Overall (STATE)
- 90 Strongly Landlord-Friendly
- State Louisiana
- 90 Strongly Landlord-Friendly · R+12
- County
- — inherits STATE
- City
- — inherits STATE
ZIP-level market 70820
- Home prices YoY
- -29.9%
- Rents YoY
- 2.8%
- Active inventory
- 315
- Price-to-rent
- 7.0×
Monthly cashflow live
- Estimated rent
- $1,552 high interval (Pro) →
- Mortgage (P&I)
- −$681
- Tax from tax record
- −$112 /mo · $1,343/yr
- Insurance
- −$54
- HOA
- −$0
- Vacancy / Maint / Mgmt
- −$326
- Net cashflow
- $379
Break-even live
UW: 25.0% down · 7.5% · 30yr · 1.5% tax · 5.0% vac · 8.0% maint · 8.0% mgmt
Financing live
Cash to close
- Down payment
- $32,475
- Closing costs
- $3,897
- Reserves months
- —
- Total cash needed
- —
Loan-product check · same deal, 3 products live
Conventional
25% down · 7.5% · 30yr
- Down + closing
- —
- Monthly P&I
- —
- Monthly cashflow
- —
- DSCR
- —
- Eligible?
- —
Personal DTI + credit; lowest rate.
DSCR
20% down · 8.5% · 30yr
- Down + closing
- —
- Monthly P&I
- —
- Monthly cashflow
- —
- DSCR
- —
- Eligible?
- —
No personal income docs; deal must DSCR.
Hard money
10% down · 12.0% · 12mo
- Down + closing
- —
- Monthly P&I
- —
- Monthly cashflow
- —
- DSCR
- —
- Eligible?
- —
Short-term bridge; refi at stabilization.
Rent comps 40 comps
| Address | Beds | Baths | Sqft | Rent | $/sqft | DOM | Units | Dist |
|---|---|---|---|---|---|---|---|---|
| 2000 Brightside Dr Baton Rouge, LA | 1.0–3.0 | 1.0–2.0 | 792 | $1,252 | $1.58 | 14d | 1 | 0.13mi |
| 1274 Sharlo Ave Unit 1519871P Baton Rouge, LA | 3.0 | 2.0 | 1786 | $3,298 | $1.85 | 14d | 1 | 0.14mi |
| 4554 Y A Tittle Ave #2 Baton Rouge, LA | 2.0 | 1.0 | 900 | $825 | $0.92 | 14d | 1 | 0.19mi |
| 2073 Brightside Dr Baton Rouge, LA | 2.0 | 2.0 | 1100 | $1,200 | $1.09 | 23d | 1 | 0.21mi |
| 4521 Y a Tittle Ave Baton Rouge, LA | 3.0 | 2.0 | 1300 | $1,150 | $0.88 | 14d | 1 | 0.24mi |
| 5112 Arlington Ct Baton Rouge, LA | 3.0 | 3.0 | 1601 | $1,850 | $1.16 | 43d | 1 | 0.25mi |
| 5124 Brightside View Dr #3 Baton Rouge, LA | 2.0 | 1.5 | 1000 | $875 | $0.88 | 43d | 1 | 0.26mi |
| 5124 Brightside View Dr #4 Baton Rouge, LA | 2.0 | 1.5 | 1000 | $999 | $1.00 | 23d | 1 | 0.26mi |
| 5124 Brightside View Dr #4 Baton Rouge, LA | 2.0 | 1.0 | 1000 | $875 | $0.88 | 43d | 1 | 0.26mi |
| 1724 Brightside Dr Apt A Baton Rouge, LA | 2.0 | 1.5 | 1050 | $1,025 | $0.98 | 23d | 1 | 0.27mi |
| 1345 Harwich Dr Baton Rouge, LA | 3.0 | 2.0 | 1478 | $1,800 | $1.22 | 43d | 1 | 0.29mi |
| 2452 Brightside Dr Baton Rouge, LA | 2.0 | 2.0 | 1246 | $1,600 | $1.28 | 14d | 1 | 0.29mi |
| 1704 Brightside Dr Unit C Baton Rouge, LA | 2.0 | 2.0 | 1088 | $1,175 | $1.08 | 21d | 1 | 0.29mi |
| 4445 Alvin Dark Ave Baton Rouge, LA | 1.0–3.0 | 1.0–3.0 | 869 | $1,003 | $1.15 | 14d | 14 | 0.30mi |
| 2122 Stonehenge Ave Baton Rouge, LA | 2.0 | 1.5 | 1540 | $1,550 | $1.01 | 43d | 1 | 0.30mi |
| 1714 Brightside Dr Unit A Baton Rouge, LA | 2.0 | 1.5 | 1050 | $1,025 | $0.98 | 43d | 1 | 0.30mi |
| 5268 S Brightside View Dr Apt 2 Baton Rouge, LA | 3.0 | 2.5 | 1348 | $1,250 | $0.93 | 43d | 1 | 0.34mi |
| 1741 Brightside Dr Baton Rouge, LA | 2.0–3.0 | 2.0 | 1436 | $1,500 | $1.04 | 14d | 3 | 0.35mi |
| 1983 S Brightside View Dr Baton Rouge, LA | 2.0 | 2.0 | 1270 | $1,100 | $0.87 | 21d | 1 | 0.37mi |
| 1983 S Brightside View Dr Unit C Baton Rouge, LA | 2.0 | 2.5 | 1124 | $1,195 | $1.06 | 43d | 1 | 0.37mi |
| 1953 S Brightside View Dr Unit B Baton Rouge, LA | 2.0 | 2.5 | 1218 | $1,300 | $1.07 | 14d | 1 | 0.37mi |
| 2021 S Brightside View Dr Unit C Baton Rouge, LA | 2.0 | 2.5 | 1250 | $1,250 | $1.00 | 43d | 1 | 0.38mi |
| 1835 S Brightside View Dr Unit C Baton Rouge, LA | 2.0 | 2.5 | 1250 | $1,375 | $1.10 | 23d | 1 | 0.38mi |
| 2173 Plantation Ln Baton Rouge, LA | 2.0 | 2.0 | 1374 | $1,200 | $0.87 | 21d | 1 | 0.40mi |
| 5648 Riverstone Dr Unit 94A Baton Rouge, LA | 2.0 | 2.0 | 1603 | $1,250 | $0.78 | 21d | 1 | 0.42mi |
| 839 E Boyd Dr Unit C Baton Rouge, LA | 2.0 | 1.5 | 1080 | $1,400 | $1.30 | 18d | 1 | 0.52mi |
| 837 E Boyd Dr Unit A Baton Rouge, LA | 2.0 | 1.5 | 1080 | $1,300 | $1.20 | 18d | 1 | 0.52mi |
| 5107 Nicholson Dr Unit A30 Baton Rouge, LA | 2.0 | 2.0 | 1365 | $1,350 | $0.99 | 23d | 1 | 0.55mi |
| 5111 Nicholson Dr Unit A44 Baton Rouge, LA | 3.0 | 2.0 | 1567 | $1,650 | $1.05 | 23d | 1 | 0.57mi |
| 900 Dean Lee Dr Baton Rouge, LA | 2.0–3.0 | 2.0–3.0 | 1585 | $1,550 | $0.98 | 23d | 3 | 0.69mi |
| 900 Dean Lee Dr Baton Rouge, LA | 2.0–3.0 | 2.0–3.0 | 1585 | $1,300 | $0.82 | 43d | 3 | 0.69mi |
| 582 Jennifer Jean Dr Baton Rouge, LA | 3.0 | 2.0 | 1370 | $1,500 | $1.09 | 43d | 1 | 0.69mi |
| 5157 Etta St Unit 4G Baton Rouge, LA | 3.0 | 2.0 | 1473 | $1,650 | $1.12 | 43d | 1 | 0.71mi |
| 4441 Burbank Dr #108 Baton Rouge, LA | 3.0 | 3.0 | 1500 | $1,725 | $1.15 | 23d | 1 | 0.76mi |
| 436 Jennifer Jean Dr Baton Rouge, LA | 3.0 | 2.0 | 1100 | $1,950 | $1.77 | 14d | 1 | 0.79mi |
| 436 Jennifer Jean Dr Baton Rouge, LA | 3.0 | 2.0 | 1100 | $1,950 | $1.77 | 23d | 1 | 0.79mi |
| 4441 Burbank Dr Baton Rouge, LA | 3.0 | 2.0–3.0 | 1544 | $1,750 | $1.13 | 43d | 2 | 0.81mi |
| 4464 Highland Rd Baton Rouge, LA | 2.0 | 2.0 | 1219 | $1,675 | $1.37 | 43d | 1 | 0.96mi |
| 4264 Oxford Ave Unit 3 Baton Rouge, LA | 2.0 | 1.0 | 1000 | $1,350 | $1.35 | 43d | 1 | 1.06mi |
| 4264 Oxford Ave Unit 4 Baton Rouge, LA | 2.0 | 1.0 | 1000 | $1,295 | $1.29 | 23d | 1 | 1.06mi |
Listing history 12 events
-
2026-06-18days on market $129,900 Active 16 DOM
-
2026-06-17days on market $129,900 Active 15 DOM
-
2026-06-16days on market $129,900 Active 14 DOM
-
2026-06-15days on market $129,900 Active 13 DOM
-
2026-06-14days on market $129,900 Active 11 DOM
-
2026-06-10days on market $129,900 Active 8 DOM
-
2026-06-09days on market $129,900 Active 7 DOM
-
2026-06-08days on market $129,900 Active 6 DOM
-
2026-06-07days on market $129,900 Active 5 DOM
-
2026-06-05days on market $129,900 Active 2 DOM
-
2026-06-03remarks 699-char remark
-
2026-06-03$129,900 Active 1 DOM
ⓘ Source: listings_history table (triggers on properties + properties_extension) + one-shot
backfill from property_details.listing_events for pre-trigger history.
Tax reassessment forecast LA · Resets to sale price
- Current annual tax
- $1,343 · $112/mo
- Projected year-2 tax
- $1,343 · $112/mo
- Expected delta
- $0/yr ($0/mo · 0.0%)
ⓘ Screening estimate from a state-policy table — verify with the county assessor before closing.
Climate risk First Street
- Flood 1/10 Low FEMA zone X · 0% chance over 30 yrs
- Wildfire 1/10 Low
- Heat 8/10 Severe 7 d/yr ≥108°F today · 20 d/yr by 30 yrs out
- Wind 9/10 Extreme 99% chance of damaging wind over 30 yrs
- Air quality 2/10 Low 1 unhealthy d/yr today · 1 by 30 yrs out
Nearby sold comps map
Loading sold comps map…
Walkable amenities ~0.75 mi
Loading nearby amenities…
Taxation est. · year 1
- Rental income
- $18,619
- − Mortgage interest
- −$7,276
- − Property taxes
- −$1,343
- − Insurance
- −$650
- − Repairs & maintenance
- −$1,490
- − Management
- −$1,490
- − Depreciation
- −$3,779
- Taxable income
- $2,592
- Est. tax owed @ 24.0%
- −$622
- After-tax cash flow
- $3,920/yr
For passive investors: Depreciation is non-cash, so a rental often shows a tax loss while cash-flowing — sheltering income. Rental losses are passive: they offset passive income freely, and up to $25,000/yr can offset ordinary (W-2) income if you actively participate and your MAGI is under $100k (phasing out to $0 by $150k); unused losses carry forward. On sale, claimed depreciation is recaptured at up to 25%, and gains may owe capital-gains tax (a 1031 exchange can defer both). Figures are a year-1 estimate at your 24.0% rate — not tax advice; consult a CPA.
Schools (NCES district)
- District
- East Baton Rouge Parish
- NCES district ID
- 2200540
- Math proficiency
- 22% ▼ -36.00%
- Reading proficiency
- 34% ▼ -31.00%
- Median HH income
- $46,263
- Composite
- 24.14/100
- National rank
- #7745
- State rank
- #47 of 98 in LA
Livability — Baton Rouge
- Score
- 74/100
- State rank
- #24
- US rank
- #4535
Category grades
Schools grade is shown separately in the Schools card above.
Census & demographics
- Census place
- Baton Rouge, LA
- County
- East Baton Rouge Parish · 399,686 people
- City population
- 351,868
- Metro
- Baton Rouge, LA
- Population (ZIP)
- 23,377
- Household income
- $47,429
- Rent vs Own
- Severe rent burden
- 1879.0
Population outlook (East Baton Rouge County) Hauer SSP2
- Today (2025)
- 464,810 people
- By 2030
- 472,137 · +1.6%
- By 2040
- 480,243 · +3.3%
- By 2050
- 484,422 · +4.2%
- By 2075
- 492,069 · +5.9%
- By 2100
- 476,347 · +2.5%
Race, ethnicity, and origin ACS 2023
- Neighborhood character
- Diverse neighborhood (Simpson 0.63)
- Race & ethnicity
- White 56% Black 21% Hispanic / Latino 13% Asian 7% Two or more races 5% Native American 2%
- Hispanic origin (detail)
- Mexican 3%
- Common ancestry
- Lithuanian 7% Italian 2% Scotch-Irish 1%
- Foreign-born
- 13% · Canada, China, South Korea
- Languages at home
- 84% English-only · Spanish 9% Other Indo-European 3% Chinese 1%
Political lean MEDSL · East Baton Rouge
- 2024 margin
- D (+11.1) · D 54.5% · R 43.4% · Other 2.1%
- 2008→2024 swing
- +8.9pp toward D · 2008: 2.2pp · 2024: 11.1pp
- All cycles
- 2024: D+11.1 2020: D+13.1 2016: D+9.2 2012: D+5.2 2008: D+2.2
Not yet ingested
- Civics
- —
Market trends
- HPI YoY
- ▼ -56.10%
- Current HPI
- 131.5382
- Rent YoY
- ▲ 2.79%
- Metro
- Baton Rouge, LA
- State GDP YoY
- ▲ 3.29%
- F500 in state
- 10
Industry mix (Fortune 500 HQ in LA)
| Industry | F500 HQs | Revenue |
|---|---|---|
| Telecommunications | 2 | $23B |
|
||
| Utilities | 1 | $12B |
|
||
| Wholesale / Distribution | 1 | $5B |
|
||
| Advertising | 1 | $2B |
|
||
Price history
+44.5% since first listed21 events — show timeline
- 2026-06-02 Listed $129,900 GBRMLS
- 2026-06-02 Listed $129,900 AcadianaMLS
- 2023-05-30 Sold (Public Records) $100,000 Public Records
- 2023-05-23 Sold (MLS) — GSREIN
- 2023-05-16 Pending — GSREIN
- 2023-05-04 Contingent — GSREIN
- 2023-05-03 Price Changed $105,000 GSREIN
- 2023-04-12 Listed $105,000 AcadianaMLS
- 2023-04-12 Listed $115,000 GSREIN
- 2023-02-06 Price Changed $115,000 GSREIN
- 2023-01-07 Price Changed $120,000 GSREIN
- 2023-01-06 Listed $115,000 AcadianaMLS
- 2018-10-11 Sold (MLS) — GBRMLS
- 2018-08-07 Listed $1,000 GBRMLS
- 2015-07-16 Sold (Public Records) $112,000 Public Records
- 2015-07-10 Sold (MLS) — GBRMLS
- 2015-01-14 Listed $112,000 AcadianaMLS
- 2015-01-14 Listed $112,000 GBRMLS
- 2013-05-29 Listed $108,000 AcadianaMLS
- 2013-05-29 Listed $108,000 GBRMLS
- 2005-09-26 Listed $89,900 AcadianaMLS
Property tax history
+2.3%/yrLatest (2025): $1,343 · +4.5% YoY. Source: county tax records.
Cash-flow waterfall
monthlySold comps — $/sqft
last 12 mo · ≤1 miLoading sold comps…