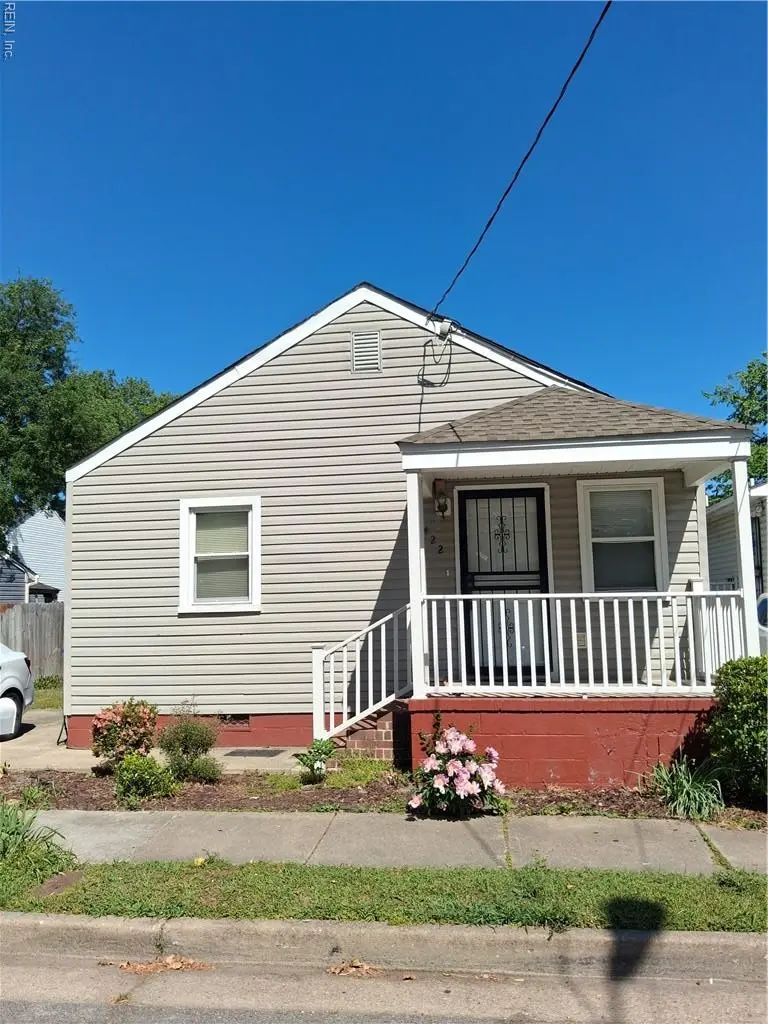
7422 Davidson St · Norfolk, VA
Flood risk 1/10 · Minimal
- FEMA flood zone
- X (unshaded)
- Chance of flooding over 30 yrs
- 0.0%
- Est. flood insurance / yr
- $507 – $1,088
Fire risk 1/10 · Minimal
- Est. fire insurance / yr
- $666 – $1,236
Heat risk 9/10 · Severe
- Hot days now (above 104°F)
- 7 days/yr
- Hot days in 30 yrs
- 16 days/yr
Wind risk 8/10 · Major
- Chance of severe wind over 30 yrs
- 80.0%
Air-quality risk 3/10 · Minor
- Unhealthy air days now
- 2 days/yr
- Unhealthy air days in 30 yrs
- 3 days/yr
Risk factors via First Street. Map © Google.
Why this score? — see what drove the C grade
The composite is a weighted blend of 9 inputs, each scored 0–100. Each bar is that input's sub-score; the figure is the points it added to the 100-point composite (weight × sub-score).
- Cash flow +18.5/30.0
- ARV discount +15.0/15.0
- DSCR +5.8/10.0
- 1% rule +4.2/10.0
- Livability +4.2/5.0
- Schools +3.5/10.0
- Rent growth +3.4/5.0
- Condition / age +2.5/5.0
- Appreciation +0.0/10.0
$170,000
🖨 Deal sheet 📄 Offer letter ✓ Due diligence
Listing remarks MLS
LOOK NO FURTHER. STOP HERE FIRST AND PREVIEW THIS 3 BEDROOM HOME. GREAT FOR FIRST TIME HOMEOWNER OR AN INVESTOR. NICE BACKYARD WITH DECK FOR ENTERTAINING. NEW HEATING SYSTEM 2025. "AS IS".
Key facts
- Built 1941
- Listed 14 days
Neighborhood map
What this means for you Summary
Snapshot
- This is a 3-bed/2.0-bath single-family listed at $170k.
Deal economics
- At list price, monthly cash flow is $161 ($2k/yr) — positive.
- The deal already cash-flows at list — no discount required.
- To meet the 1% rule (rent ≥ 1% of price), the offer needs to be $157k (7.8% below list).
- Recommended offer: $157k (7.8% below list) — sets the bar for 1% rule.
- Cap rate 7.4% vs local median 4.0% in Norfolk — top-decile yield for the area; either an underpriced asset or a hidden risk that comps aren't pricing in. Stress-test before assuming the spread holds.
Location & tenants
- Location reads 83/100 on livability (#43 in VA, #1,026 nationally) — a professional / high-income tenant draw. Strengths: amenities A+, commute A+, health & safety A+; Watch: employment C-, crime F.
- Norfolk City Public School District (urban): math 27% / reading 56% proficiency, ranked #118 of 131 in VA (top 90%) — families likely to look elsewhere, expect single-tenant / working-renter base with shorter leases.
- Market conditions: Rents rising (+3.4%/yr); 132 active listings in the ZIP; 38 comparable units currently listed for rent nearby; rentals at typical pace (median 24d on market — plan ~3-4 weeks tenant-placement turnaround); 438 units permitted in Norfolk city in 2024 (273 in 5+ unit buildings).
Forward outlook
- Local home prices are declining (-3.0%/yr); year-one equity from $1k of loan paydown is wiped out by about $5k of value loss. Plan a longer hold.
Negotiation context
- Only 14 days on market — expect competitive offers; lowballing is unlikely to land.
- Current owner paid $32k; list at $170k implies a 440% gain — meaningful room to come down on a strong offer.
Risks & watch-outs
- Watch-outs: built in 1941 — expect roof / HVAC / electrical / plumbing capex.
- Climate carrying-cost: severe wind risk, 80% chance of damaging wind over 30y; extreme-heat days projected 7→16/yr by 2055 (HVAC capex compounding) — expect insurance premiums to compound above CPI over the hold.
Questions for the listing agent
- Built in 1941 — when were the roof, HVAC, electrical panel, plumbing, and water heater last replaced?
- Is there a deadline driving the sale (1031 exchange, divorce, estate, relocation)? That informs how much negotiation room exists.
- Schools are A-rated — typically a magnet for longer-tenancy family renters. What's the average tenant stay here, and is there a school-zone premium baked into asking?
- Crime grade is F in this area — have there been break-ins, vandalism, or insurance claims at this property in the last 3 years? What carrier currently insures it and at what premium?
- What's the average days-on-market for RENTAL listings here right now (not sales)? A rising rental-DOM trend means longer vacancies and softer asking-rent achievability than the comps imply.
- What's the recent tenant-quality profile in this submarket — average credit score on applications, eviction rate, late-payment / NSF rate, and stable-employment percentage? A property-management company in the area should have these aggregated.
- How much new for-sale + rental construction is in the pipeline within 1–3 miles? Heavy new supply typically softens prices + rents 12–24 months out; constrained supply supports both.
Investment metrics
- 1% rule
- 0.92% ✗
- Cap rate
- 7.43%
- Cash-on-cash
- 4.05%
- DSCR
- 1.18
- GRM
- 9.0
CMA / ARV
- ARV (median comp)
- $254,145
- List price
- $170,000
- Delta
- -33.11%
- Verdict
- UNDERPRICED
- Comps
- 20 within 1.0 mi
Show comp detail 12 sales within ~0.75 mi
| Address | Dist | Beds/Ba | Sqft | Sold | Price | $/sf | Match |
|---|---|---|---|---|---|---|---|
| 720 Nickoles Ln | 0.45mi | 3/1.0 | 933 (+1%) | 5mo | $215,000 | $230 | 69 |
| 7450 Tyndale Ct | 0.48mi | 2/1.0 (-1) | 912 (-1%) | 1mo | $235,000 | $258 | 66 |
| 1033 Tifton St | 0.41mi | 3/1.0 | 972 (+5%) | 4mo | $260,000 | $267 | 64 |
| 864 Lasser Dr | 0.48mi | 3/1.0 | 874 (-5%) | 2mo | $160,000 | $183 | 63 |
| 7012 Selma Ave | 0.36mi | 3/1.0 | 1,000 (+8%) | 4mo | $259,750 | $260 | 62 |
| 909 Workwood Rd | 0.41mi | 3/1.0 | 1,005 (+9%) | 2mo | $270,000 | $269 | 60 |
| 7948 Merritt St | 0.43mi | 3/1.0 | 1,002 (+9%) | 4mo | $122,000 | $122 | 58 |
| 936 Widgeon Rd | 0.61mi | 3/1.0 | 960 (+4%) | 3mo | $180,000 | $188 | 58 |
| 1041 Tifton St | 0.39mi | 2/1.0 (-1) | 847 (-8%) | 6mo | $205,000 | $242 | 54 |
| 840 Workwood Rd | 0.49mi | 3/1.0 | 1,040 (+13%) | 5mo | $255,000 | $245 | 48 |
| 623 Gladstone Rd | 0.75mi | 3/1.0 | 855 (-7%) | 3mo | $256,500 | $300 | 46 |
| 741 Bancker Rd | 0.62mi | 3/2.0 | 1,052 (+14%) | 6mo | $310,000 | $295 | 43 |
Match score weights: distance 35% · size 25% · config 20% · recency 20%. Top-matched comps best support the ARV.
Projected returns pro-forma
-3.0% appreciation · 3.42% rent growth · sell at horizon
- IRR
- -9.5%
- Equity multiple
- 0.65×
- Total profit
- $-16,686
- Equity at exit
- $25,348
- IRR
- 0.4%
- Equity multiple
- 1.03×
- Total profit
- $1,252
- Equity at exit
- $14,698
Cash invested: $47,600 (down + closing). Projections, not guarantees.
Landlord ↔ Tenant lean methodology
- Overall (STATE)
- 55 Moderately Landlord-Leaning
- State Virginia
- 55 Moderately Landlord-Leaning · D+2
- County
- — inherits STATE
- City
- — inherits STATE
ZIP-level market 23513
- Home prices YoY
- -9.3%
- Rents YoY
- 3.4%
- Active inventory
- 132
- Price-to-rent
- 9.0×
Monthly cashflow live
- Estimated rent
- $1,567 high interval (Pro) →
- Mortgage (P&I)
- −$891
- Tax from tax record
- −$115 /mo · $1,384/yr
- Insurance
- −$71
- HOA
- −$0
- Vacancy / Maint / Mgmt
- −$329
- Net cashflow
- $161
Break-even live
UW: 25.0% down · 7.5% · 30yr · 1.5% tax · 5.0% vac · 8.0% maint · 8.0% mgmt
Financing live
Cash to close
- Down payment
- $42,500
- Closing costs
- $5,100
- Reserves months
- —
- Total cash needed
- —
Loan-product check · same deal, 3 products live
Conventional
25% down · 7.5% · 30yr
- Down + closing
- —
- Monthly P&I
- —
- Monthly cashflow
- —
- DSCR
- —
- Eligible?
- —
Personal DTI + credit; lowest rate.
DSCR
20% down · 8.5% · 30yr
- Down + closing
- —
- Monthly P&I
- —
- Monthly cashflow
- —
- DSCR
- —
- Eligible?
- —
No personal income docs; deal must DSCR.
Hard money
10% down · 12.0% · 12mo
- Down + closing
- —
- Monthly P&I
- —
- Monthly cashflow
- —
- DSCR
- —
- Eligible?
- —
Short-term bridge; refi at stabilization.
Rent comps 38 comps
| Address | Beds | Baths | Sqft | Rent | $/sqft | DOM | Units | Dist |
|---|---|---|---|---|---|---|---|---|
| 7128 Gregory Dr Norfolk, VA | 2.0 | 1.0 | 720 | $1,800 | $2.50 | 43d | 1 | 0.21mi |
| 7108 Gregory Dr Norfolk, VA | 2.0 | 1.0 | 720 | $1,400 | $1.94 | 43d | 1 | 0.26mi |
| 869 Bancker Rd Norfolk, VA | 2.0 | 1.0–1.5 | 910 | $1,142 | $1.26 | 43d | 1 | 0.43mi |
| 7465 Fenner St Unit 7468-2-A8 Norfolk, VA | 2.0 | 1.0 | 900 | $1,399 | $1.55 | 20d | 1 | 0.50mi |
| 7922 Old Ocean View Rd Norfolk, VA | 1.0–3.0 | 1.0–1.5 | 890 | $1,300 | $1.46 | 1d | 3 | 0.51mi |
| 7427 Tyndale Ct Unit 1 Norfolk, VA | 2.0 | 1.0 | 786 | $995 | $1.27 | 43d | 1 | 0.53mi |
| 7433 Fenner St Norfolk, VA | 1.0–2.0 | 1.0 | 715 | $1,399 | $1.96 | 14d | 7 | 0.56mi |
| 715 Easy St Unit 2 Norfolk, VA | 2.0 | 1.0 | 750 | $1,200 | $1.60 | 14d | 1 | 0.59mi |
| 837 Tifton St Norfolk, VA | 3.0 | 2.0 | 1072 | $2,300 | $2.15 | 23d | 1 | 0.60mi |
| 7474 Pennington Rd Unit 7474 Norfolk, VA | 2.0 | 1.0 | 1000 | $1,525 | $1.52 | 2d | 1 | 0.68mi |
| 7996 Diggs Rd Unit D Norfolk, VA | 3.0 | 2.0 | 950 | $1,375 | $1.45 | 43d | 1 | 0.69mi |
| 507 Ashlawn Dr Norfolk, VA | 2.0 | 1.0 | 750 | $1,395 | $1.86 | 43d | 1 | 0.88mi |
| 508 Ashlawn Dr Unit 2 Norfolk, VA | 2.0 | 1.0 | 725 | $1,250 | $1.72 | 21d | 1 | 0.89mi |
| 504 Ashlawn Dr Unit 2 Norfolk, VA | 2.0 | 1.0 | 725 | $1,250 | $1.72 | 23d | 1 | 0.90mi |
| 504 Ashlawn Dr Norfolk, VA | 2.0 | 1.0 | 725 | $1,250 | $1.72 | 21d | 1 | 0.90mi |
| 440 San Antonio Blvd Norfolk, VA | 2.0 | 1.0 | 800 | $1,535 | $1.92 | 23d | 1 | 0.92mi |
| 417 E Little Creek Rd Apt 4 Norfolk, VA | 2.0 | 1.0 | 700 | $1,050 | $1.50 | 7d | 1 | 0.94mi |
| 351 San Antonio Blvd Unit 8 Norfolk, VA | 2.0 | 1.0 | 675 | $1,250 | $1.85 | 12d | 1 | 1.07mi |
| 6340 Sewells Point Rd Apt communities Norfolk, VA | 2.0 | 1.0 | 750 | $1,099 | $1.47 | 21d | 1 | 1.10mi |
| 8231 Andrew Ln Norfolk, VA | 3.0 | 1.0 | 720 | $1,800 | $2.50 | 23d | 1 | 1.11mi |
| 6343 Chesapeake Blvd Apt communities Norfolk, VA | 2.0 | 1.0 | 750 | $1,099 | $1.47 | 21d | 1 | 1.12mi |
| 310 Naval Base Rd Norfolk, VA | 3.0 | 1.0 | 1000 | $1,850 | $1.85 | 23d | 1 | 1.14mi |
| 845 Norman Ave Norfolk, VA | 2.0 | 1.0 | 862 | $2,000 | $2.32 | 23d | 1 | 1.16mi |
| 311 Ashlawn Dr Unit 3 Norfolk, VA | 2.0 | 1.0 | 800 | $1,195 | $1.49 | 44d | 1 | 1.19mi |
| 609 Summers Dr Norfolk, VA | 3.0 | 1.0 | 998 | $1,995 | $2.00 | 4d | 1 | 1.21mi |
| 312 Ashlawn Dr Norfolk, VA | 2.0 | 1.0 | 720 | $1,200 | $1.67 | 43d | 1 | 1.22mi |
| 6450 Crescent Way Norfolk, VA | 1.0–3.0 | 1.0–2.0 | 1128 | $2,369 | $2.10 | 2d | 23 | 1.23mi |
| 6234 Chesapeake Blvd Norfolk, VA | 2.0 | 1.0 | 986 | $925 | $0.94 | 17d | 1 | 1.29mi |
| 6228 Chesapeake Blvd Unit G Norfolk, VA | 2.0 | 1.0 | 885 | $925 | $1.05 | 43d | 1 | 1.31mi |
| 6249 Alexander St Unit F Norfolk, VA | 2.0 | 1.0 | 817 | $1,195 | $1.46 | 4d | 1 | 1.31mi |
| 6249 Alexander St Unit C Norfolk, VA | 2.0 | 1.0 | 817 | $1,195 | $1.46 | 23d | 1 | 1.31mi |
| 6249 Alexander St Unit C Norfolk, VA | 2.0 | 1.0 | 817 | $1,195 | $1.46 | 17d | 1 | 1.31mi |
| 6241 Alexander St Unit F Norfolk, VA | 2.0 | 1.0 | 704 | $895 | $1.27 | 12d | 1 | 1.33mi |
| 739 Waukesha Ave Norfolk, VA | 2.0 | 1.0 | 860 | $1,800 | $2.09 | 23d | 1 | 1.34mi |
| 6225 Alexander St Unit F Norfolk, VA | 2.0 | 1.0 | 750 | $1,499 | $2.00 | 20d | 1 | 1.35mi |
| 6225 Alexander St Norfolk, VA | 2.0 | 1.0 | 750 | $1,299 | $1.73 | 43d | 1 | 1.36mi |
| 1232 Norview Ave Unit NOR1232R-EA Norfolk, VA | 3.0 | 2.0 | 1106 | $1,600 | $1.45 | 43d | 1 | 1.46mi |
| 6115 Tidewater Dr Norfolk, VA | 1.0–2.0 | 1.0–2.0 | 956 | $2,274 | $2.38 | 2d | 8 | 1.47mi |
Listing history 4 events
-
2026-05-06status Under Contract 198-char remark
Show marketing remark (198 chars)
LOOK NO FURTHER. STOP HERE FIRST AND PREVIEW THIS 3 BEDROOM HOME. GREAT FOR FIRST TIME HOMEOWNER OR AN INVESTOR. NICE BACKYARD WITH DECK FOR ENTERTAINING. NEW HEATING SYSTEM 2025. "AS IS".
-
2026-05-01price $170,000 198-char remark
Show marketing remark (198 chars)
LOOK NO FURTHER. STOP HERE FIRST AND PREVIEW THIS 3 BEDROOM HOME. GREAT FOR FIRST TIME HOMEOWNER OR AN INVESTOR. NICE BACKYARD WITH DECK FOR ENTERTAINING. NEW HEATING SYSTEM 2025. "AS IS".
-
2026-04-21$225,000 Active 198-char remark
Show marketing remark (198 chars)
LOOK NO FURTHER. STOP HERE FIRST AND PREVIEW THIS 3 BEDROOM HOME. GREAT FOR FIRST TIME HOMEOWNER OR AN INVESTOR. NICE BACKYARD WITH DECK FOR ENTERTAINING. NEW HEATING SYSTEM 2025. "AS IS".
-
1981-04-29soldstatus $31,500
ⓘ Source: listings_history table (triggers on properties + properties_extension) + one-shot
backfill from property_details.listing_events for pre-trigger history.
Tax reassessment forecast VA · Resets to sale price
- Current annual tax
- $1,384 · $115/mo
- Projected year-2 tax
- $1,394 · $116/mo
- Expected delta
- +$10/yr (+$1/mo · 0.7%)
ⓘ Screening estimate from a state-policy table — verify with the county assessor before closing.
Climate risk First Street
- Flood 1/10 Low FEMA zone X (unshaded) · 0% chance over 30 yrs
- Wildfire 1/10 Low
- Heat 9/10 Extreme 7 d/yr ≥104°F today · 16 d/yr by 30 yrs out
- Wind 8/10 Severe 80% chance of damaging wind over 30 yrs
- Air quality 3/10 Moderate 2 unhealthy d/yr today · 3 by 30 yrs out
Nearby sold comps map
Loading sold comps map…
Walkable amenities ~0.75 mi
Loading nearby amenities…
Taxation est. · year 1
- Rental income
- $18,810
- − Mortgage interest
- −$9,523
- − Property taxes
- −$1,384
- − Insurance
- −$850
- − Repairs & maintenance
- −$1,505
- − Management
- −$1,505
- − Depreciation
- −$4,945
- Taxable loss
- −$902
- Est. tax savings @ 24.0%
- +$216
- After-tax cash flow
- $2,144/yr
For passive investors: Depreciation is non-cash, so a rental often shows a tax loss while cash-flowing — sheltering income. Rental losses are passive: they offset passive income freely, and up to $25,000/yr can offset ordinary (W-2) income if you actively participate and your MAGI is under $100k (phasing out to $0 by $150k); unused losses carry forward. On sale, claimed depreciation is recaptured at up to 25%, and gains may owe capital-gains tax (a 1031 exchange can defer both). Figures are a year-1 estimate at your 24.0% rate — not tax advice; consult a CPA.
Schools (NCES district)
- District
- Norfolk City Public School District
- NCES district ID
- 5102670
- Math proficiency
- 27% ▼ -44.00%
- Reading proficiency
- 56% ▼ -10.00%
- Median HH income
- $44,358
- Composite
- 35.08/100
- National rank
- #5026
- State rank
- #118 of 131 in VA
Livability — Norfolk
- Score
- 83/100
- State rank
- #43
- US rank
- #1026
Category grades
Schools grade is shown separately in the Schools card above.
Census & demographics
- Census place
- Norfolk, VA
- County
- Norfolk City · 214,042 people
- City population
- 214,042
- Metro
- Virginia Beach-Norfolk-Newport News, VA-NC
- Population (ZIP)
- 28,628
- Household income
- $68,380
- Rent vs Own
- Severe rent burden
- 1342.0
Population outlook (Norfolk County) Hauer SSP2
- Today (2025)
- 249,032 people
- By 2030
- 252,347 · +1.3%
- By 2040
- 253,644 · +1.9%
- By 2050
- 251,913 · +1.2%
- By 2075
- 245,281 · -1.5%
- By 2100
- 219,548 · -11.8%
Race, ethnicity, and origin ACS 2023
- Neighborhood character
- Diverse neighborhood (Simpson 0.63)
- Race & ethnicity
- Black 55% White 23% Hispanic / Latino 11% Two or more races 7% Asian 5%
- Hispanic origin (detail)
- Mexican 4% Puerto Rican 3%
- Common ancestry
- Romanian 1% Slovak 1% Lithuanian 0%
- Foreign-born
- 10% · Canada
- Languages at home
- 87% English-only · Spanish 6% Tagalog/Filipino 4% French/Haitian/Cajun 1%
Political lean MEDSL · Norfolk
- 2024 margin
- Solid D (+41.5) · D 70.0% · R 28.5% · Other 1.6%
- 2008→2024 swing
- -1.4pp toward R · 2008: 43.0pp · 2024: 41.5pp
- All cycles
- 2024: D+41.5 2020: D+45.6 2016: D+42.0 2012: D+44.0 2008: D+43.0
Not yet ingested
- Civics
- —
Market trends
- HPI YoY
- ▼ -33.67%
- Current HPI
- 329.2241
- Rent YoY
- ▲ 3.42%
- Metro
- Virginia Beach-Norfolk-Newport News, VA-NC
- State GDP YoY
- ▲ 2.40%
- F500 in state
- 50
Industry mix (Fortune 500 HQ in VA)
| Industry | F500 HQs | Revenue |
|---|---|---|
| Aerospace / Defense | 4 | $236B |
|
||
| Technology / Defense | 3 | $32B |
|
||
| Financial Services | 2 | $176B |
|
||
| Utilities | 2 | $27B |
|
||
| Insurance | 2 | $25B |
|
||
| Technology | 2 | $15B |
|
||
Price history
+439.7% since first listed4 events — show timeline
- 2026-05-06 Pending — REINMLS
- 2026-05-01 Price Changed $170,000 REINMLS
- 2026-04-21 Listed $225,000 REINMLS
- 1981-04-29 Sold (Public Records) $31,500 Public Records
Property tax history
+6.9%/yrLatest (2024): $1,384 · +1.8% YoY. Source: county tax records.
Cash-flow waterfall
monthlySold comps — $/sqft
last 12 mo · ≤1 miLoading sold comps…