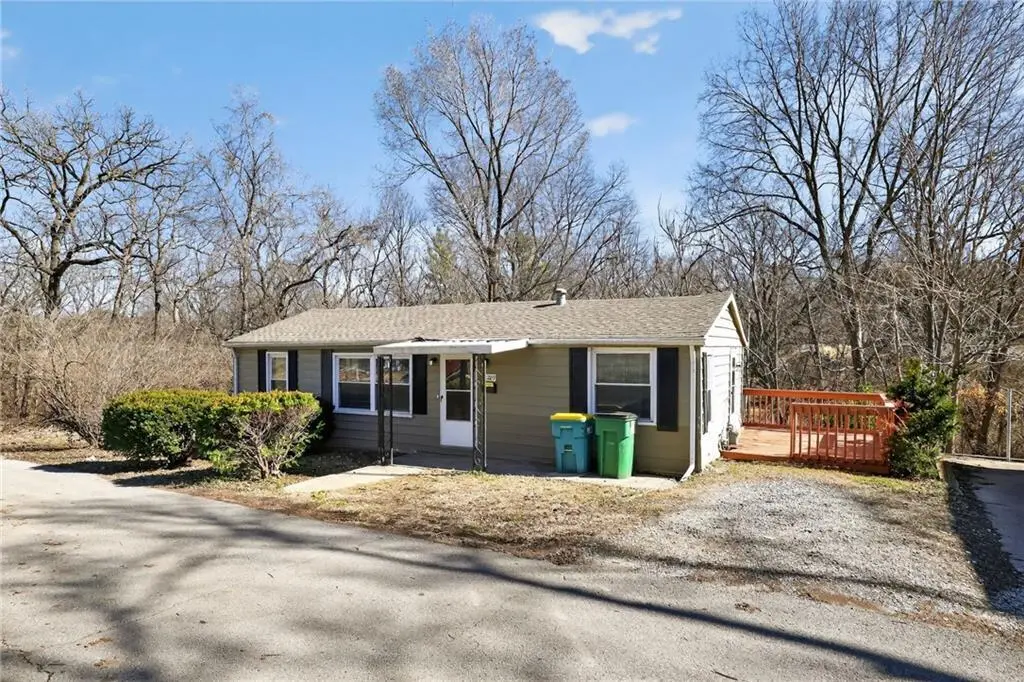
2209 S Hawthorne Ave · Independence, MO
Flood risk 9/10 · Severe
- FEMA flood zone
- X (unshaded)
- Chance of flooding over 30 yrs
- 0.99%
- Est. flood insurance / yr
- $473 – $860
Fire risk 1/10 · Minimal
- Est. fire insurance / yr
- $1,054 – $1,958
Heat risk 4/10 · Minor
- Hot days now (above 106°F)
- 7 days/yr
- Hot days in 30 yrs
- 17 days/yr
Wind risk 2/10 · Minimal
- Chance of severe wind over 30 yrs
- —
Air-quality risk 3/10 · Minor
- Unhealthy air days now
- 2 days/yr
- Unhealthy air days in 30 yrs
- 3 days/yr
Risk factors via First Street. Map © Google.
Why this score? — see what drove the C- grade
The composite is a weighted blend of 9 inputs, each scored 0–100. Each bar is that input's sub-score; the figure is the points it added to the 100-point composite (weight × sub-score).
- Cash flow +17.8/30.0
- ARV discount +12.6/15.0
- DSCR +5.6/10.0
- 1% rule +4.1/10.0
- Livability +4.1/5.0
- Rent growth +3.9/5.0
- Schools +2.7/10.0
- Condition / age +2.5/5.0
- Appreciation +0.0/10.0
$119,900
🖨 Deal sheet 📄 Offer letter ✓ Due diligence
Listing remarks MLS
Welcome to 2209 S Hawthorne Ave in Independence, MO! This 3-bedroom, 1-bath home offers a practical layout with comfortable living spaces and plenty of natural light. The full basement provides excellent storage and the opportunity for additional finished space, whether you envision a recreation room, home office, or hobby area. Conveniently located near shopping, dining, schools, and major roadways, this property presents a great opportunity for buyers looking for space, functionality, and potential.
Key facts
- Natural light
- Full basement
- Conveniently located
Tags
Neighborhood map
What this means for you Summary
Snapshot
- This is a 2-bed/1.0-bath single-family listed at $120k.
Deal economics
- At list price, monthly cash flow is $44 ($525/yr) — positive.
- The deal already cash-flows at list — no discount required.
- To meet the 1% rule (rent ≥ 1% of price), the offer needs to be $109k (9.3% below list).
- Recommended offer: $109k (9.3% below list) — sets the bar for 1% rule.
- Cap rate 7.3% vs local median 5.0% in Independence — top-decile yield for the area; either an underpriced asset or a hidden risk that comps aren't pricing in. Stress-test before assuming the spread holds.
Location & tenants
- Location reads 82/100 on livability (#10 in MO, #1,296 nationally) — a professional / high-income tenant draw. Strengths: amenities A+, commute A+, cost of living A+; Watch: schools C-, employment D+, crime F.
- Independence 30 (suburban): math 26% / reading 38% proficiency, ranked #252 of 324 in MO (top 78%) — families likely to look elsewhere, expect single-tenant / working-renter base with shorter leases.
- Market conditions: Rents rising fast (+5.4%/yr); 127 active listings in the ZIP; 22 comparable units currently listed for rent nearby; rentals at typical pace (median 24d on market — plan ~3-4 weeks tenant-placement turnaround); 41% of comp listings sitting > 30 days — soft ceiling on asking rent; 4,002 units permitted in Jackson County in 2024 (2,271 in 5+ unit buildings).
Forward outlook
- Local home prices are declining (-3.0%/yr); year-one equity from $829 of loan paydown is wiped out by about $4k of value loss. Plan a longer hold.
- Jackson County population projected at +4% by 2050 — modest demand growth; plan on rents tracking national, not racing it.
Negotiation context
- It's been on market 113 days — a 9% lower offer ($109k) is reasonable based on typical stale-listing flexibility.
- 2 sale attempts since 10y ago; this cycle's ask has dropped $25k (17%) from the opening price — seller is motivated, your offer sets the floor, not the list.
Risks & watch-outs
- Watch-outs: flood insurance adds $56/mo; built in 1956 — expect roof / HVAC / electrical / plumbing capex.
- Climate carrying-cost: severe flood risk — expect insurance premiums to compound above CPI over the hold.
Questions for the listing agent
- It's been on market 113 days. Have you received any prior offers? Is the seller open to a 9% concession, seller financing, or rate buy-down credit?
- Built in 1956 — when were the roof, HVAC, electrical panel, plumbing, and water heater last replaced?
- What's the actual annual flood-insurance premium (NFIP or private), and is the property in a SFHA with mandatory coverage?
- Why hasn't it sold? Are there any deal-killer items the seller is aware of (foundation, flood, title, zoning, code violations)?
- Is there a deadline driving the sale (1031 exchange, divorce, estate, relocation)? That informs how much negotiation room exists.
- Crime grade is F in this area — have there been break-ins, vandalism, or insurance claims at this property in the last 3 years? What carrier currently insures it and at what premium?
- What's the average days-on-market for RENTAL listings here right now (not sales)? A rising rental-DOM trend means longer vacancies and softer asking-rent achievability than the comps imply.
- What's the recent tenant-quality profile in this submarket — average credit score on applications, eviction rate, late-payment / NSF rate, and stable-employment percentage? A property-management company in the area should have these aggregated.
- How much new for-sale + rental construction is in the pipeline within 1–3 miles? Heavy new supply typically softens prices + rents 12–24 months out; constrained supply supports both.
Investment metrics
- 1% rule
- 0.91% ✗
- Cap rate
- 7.29%
- Cash-on-cash
- 3.55%
- DSCR
- 1.16
- GRM
- 9.2
CMA / ARV
- ARV (median comp)
- $135,245
- List price
- $119,900
- Delta
- -11.35%
- Verdict
- UNDERPRICED
- Comps
- 20 within 1.0 mi
Show comp detail 12 sales within ~0.75 mi
| Address | Dist | Beds/Ba | Sqft | Sold | Price | $/sf | Match |
|---|---|---|---|---|---|---|---|
| 2319 S Cedar Ave | 0.27mi | 2/1.0 | 742 (-7%) | 5mo | $134,000 | $181 | 71 |
| 1927 S Ash Ave | 0.36mi | 2/1.0 | 750 (-6%) | 7mo | $125,000 | $167 | 66 |
| 10504 E 25th Ter | 0.57mi | 2/1.0 | 768 (-4%) | 2mo | $159,000 | $207 | 65 |
| 2512 S Evanston Ave | 0.36mi | 2/1.0 | 872 (+9%) | 7mo | $130,000 | $149 | 62 |
| 2010 S Northern Blvd | 0.58mi | 2/1.0 | 864 (+8%) | 3mo | $134,900 | $156 | 57 |
| 10409 E 26th St S | 0.61mi | 2/1.0 | 864 (+8%) | 1mo | $146,900 | $170 | 57 |
| 2319 S Hawthorne Ave | 0.18mi | 3/2.0 (+1) | 918 (+15%) | 2mo | $150,000 | $163 | 56 |
| 1901 S Hardy Ave | 0.46mi | 1/1.0 (-1) | 733 (-8%) | 4mo | $97,000 | $132 | 56 |
| 2024 S Northern Blvd | 0.57mi | 2/1.0 | 864 (+8%) | 8mo | $150,000 | $174 | 53 |
| 2435 S Glenwood Ave | 0.49mi | 2/2.0 | 900 (+12%) | 2mo | $145,000 | $161 | 51 |
| 1514 S Cedar Ave | 0.63mi | 2/2.0 | 883 (+10%) | 3mo | $145,000 | $164 | 47 |
| 1815 S Ralston Ave | 0.60mi | 2/1.0 | 912 (+14%) | 3mo | $165,000 | $181 | 46 |
Match score weights: distance 35% · size 25% · config 20% · recency 20%. Top-matched comps best support the ARV.
Projected returns pro-forma
-3.0% appreciation · 5.43% rent growth · sell at horizon
- IRR
- -11.1%
- Equity multiple
- 0.59×
- Total profit
- $-13,909
- Equity at exit
- $17,877
- IRR
- 1.2%
- Equity multiple
- 1.10×
- Total profit
- $3,259
- Equity at exit
- $10,367
Cash invested: $33,572 (down + closing). Projections, not guarantees.
Landlord ↔ Tenant lean methodology
- Overall (STATE)
- 81 Strongly Landlord-Friendly
- State Missouri
- 81 Strongly Landlord-Friendly · R+10
- County
- — inherits STATE
- City
- — inherits STATE
ZIP-level market 64052
- Home prices YoY
- -34.6%
- Rents YoY
- 5.4%
- Active inventory
- 127
- Price-to-rent
- 9.2×
Monthly cashflow live
- Estimated rent
- $1,088 high interval (Pro) →
- Mortgage (P&I)
- −$629
- Tax from tax record
- −$81 /mo · $974/yr
- Insurance
- −$50
- Flood insurance flood zone
- −$56 /mo · $666/yr
- HOA
- −$0
- Vacancy / Maint / Mgmt
- −$228
- Net cashflow
- $44
Break-even live
UW: 25.0% down · 7.5% · 30yr · 1.5% tax · 5.0% vac · 8.0% maint · 8.0% mgmt
Financing live
Cash to close
- Down payment
- $29,975
- Closing costs
- $3,597
- Reserves months
- —
- Total cash needed
- —
Loan-product check · same deal, 3 products live
Conventional
25% down · 7.5% · 30yr
- Down + closing
- —
- Monthly P&I
- —
- Monthly cashflow
- —
- DSCR
- —
- Eligible?
- —
Personal DTI + credit; lowest rate.
DSCR
20% down · 8.5% · 30yr
- Down + closing
- —
- Monthly P&I
- —
- Monthly cashflow
- —
- DSCR
- —
- Eligible?
- —
No personal income docs; deal must DSCR.
Hard money
10% down · 12.0% · 12mo
- Down + closing
- —
- Monthly P&I
- —
- Monthly cashflow
- —
- DSCR
- —
- Eligible?
- —
Short-term bridge; refi at stabilization.
Rent comps 22 comps
| Address | Beds | Baths | Sqft | Rent | $/sqft | DOM | Units | Dist |
|---|---|---|---|---|---|---|---|---|
| 2222 S Overton Ave Independence, MO | 2.0 | 1.0 | 800 | $1,025 | $1.28 | 21d | 1 | 0.07mi |
| 2503 S Crescent Ave Independence, MO | 2.0 | 2.0 | 864 | $1,295 | $1.50 | 16d | 1 | 0.33mi |
| 10323 E 20th St S Independence, MO | 3.0 | 1.0 | 936 | $1,400 | $1.50 | 43d | 1 | 0.35mi |
| 1712 S Ash Ave Unit 1714-3 Independence, MO | 2.0 | 1.0 | 700 | $895 | $1.28 | 23d | 1 | 0.54mi |
| 1712 S Ash Ave Unit 1718-1 Independence, MO | 1.0 | 1.0 | 550 | $775 | $1.41 | 23d | 1 | 0.54mi |
| 1712 S Ash Ave Independence, MO | 2.0 | 1.0 | 800 | $945 | $1.18 | 43d | 1 | 0.54mi |
| 10119 E Winner Rd Unit 2 Independence, MO | 1.0 | 1.0 | 1000 | $1,045 | $1.04 | 21d | 1 | 0.57mi |
| 10714 E 19th St S Independence, MO | 2.0 | 1.0 | 1010 | $895 | $0.89 | 2d | 1 | 0.63mi |
| 10604 E 26th St S Independence, MO | 3.0 | 1.0 | 1068 | $1,610 | $1.51 | 7d | 1 | 0.67mi |
| 2702 S Glenwood Ave Independence, MO | 3.0 | 1.0 | 1056 | $1,555 | $1.47 | 23d | 1 | 0.68mi |
| 1601 Blue Ridge Blvd Independence, MO | 1.0 | 1.0 | 515 | $909 | $1.77 | 12d | 3 | 1.05mi |
| 9528 E Winner Rd Independence, MO | 1.0–3.0 | 1.0 | 730 | $999 | $1.37 | 43d | 1 | 1.07mi |
| 1810 S Vermont Ave Independence, MO | 2.0 | 1.0 | 950 | $948 | $1.00 | 43d | 1 | 1.08mi |
| 10522 E 10th St S Independence, MO | 2.0 | 1.0 | 1020 | $1,099 | $1.08 | 23d | 1 | 1.14mi |
| 10561 E Lake Dr Independence, MO | 2.0 | 1.0 | 800 | $1,000 | $1.25 | 43d | 1 | 1.18mi |
| 2912 Englewood Ter Independence, MO | 3.0 | 2.0 | 792 | $1,399 | $1.77 | 16d | 1 | 1.25mi |
| 3213 S Ash Ave Independence, MO | 2.0 | 1.0 | 879 | $1,195 | $1.36 | 7d | 1 | 1.28mi |
| 11616 E 16th St S Independence, MO | 2.0 | 1.0 | 1016 | $1,125 | $1.11 | 43d | 1 | 1.41mi |
| 600 S Glenwood Ave Unit I Independence, MO | 1.0 | 1.0 | 700 | $695 | $0.99 | 43d | 1 | 1.46mi |
| 600 S Glenwood Ave Unit E Independence, MO | 1.0 | 1.0 | 600 | $725 | $1.21 | 43d | 1 | 1.46mi |
| 600 S Glenwood Ave Unit F Independence, MO | 2.0 | 1.0 | 750 | $995 | $1.33 | 19d | 1 | 1.46mi |
| 3333 S Oxford Ave Independence, MO | 2.0 | 1.0 | 700 | $850 | $1.21 | 43d | 1 | 1.47mi |
Listing history 19 events
-
2026-06-18days on market $119,900 Active 113 DOM
-
2026-06-17days on market $119,900 Active 112 DOM
-
2026-06-16days on market $119,900 Active 111 DOM
-
2026-06-15days on market $119,900 Active 110 DOM
-
2026-06-13days on market $119,900 Active 108 DOM
-
2026-06-09days on market $119,900 Active 104 DOM
-
2026-06-08days on market $119,900 Active 103 DOM
-
2026-06-07days on market $119,900 Active 102 DOM
-
2026-06-05days on market $119,900 Active 99 DOM
-
2026-06-03days on market $119,900 Active 98 DOM
-
2026-06-02days on market $119,900 Active 97 DOM
-
2026-06-01days on market $119,900 Active 96 DOM
-
2026-05-31days on market $119,900 Active 95 DOM
-
2026-05-01price $129,900 506-char remark
Show marketing remark (506 chars)
Welcome to 2209 S Hawthorne Ave in Independence, MO! This 3-bedroom, 1-bath home offers a practical layout with comfortable living spaces and plenty of natural light. The full basement provides excellent storage and the opportunity for additional finished space, whether you envision a recreation room, home office, or hobby area. Conveniently located near shopping, dining, schools, and major roadways, this property presents a great opportunity for buyers looking for space, functionality, and potential.
-
2026-04-03price $139,900 506-char remark
Show marketing remark (506 chars)
Welcome to 2209 S Hawthorne Ave in Independence, MO! This 3-bedroom, 1-bath home offers a practical layout with comfortable living spaces and plenty of natural light. The full basement provides excellent storage and the opportunity for additional finished space, whether you envision a recreation room, home office, or hobby area. Conveniently located near shopping, dining, schools, and major roadways, this property presents a great opportunity for buyers looking for space, functionality, and potential.
-
2026-02-25$144,900 Active 506-char remark
Show marketing remark (506 chars)
Welcome to 2209 S Hawthorne Ave in Independence, MO! This 3-bedroom, 1-bath home offers a practical layout with comfortable living spaces and plenty of natural light. The full basement provides excellent storage and the opportunity for additional finished space, whether you envision a recreation room, home office, or hobby area. Conveniently located near shopping, dining, schools, and major roadways, this property presents a great opportunity for buyers looking for space, functionality, and potential.
-
2016-05-16soldstatus Sold 242-char remark
Show marketing remark (242 chars)
800 sq ft ranch with steel siding and thermal windows. Roof 5 yrs - clean and ready to move into. Deck for outside entertaining. Nice kitchen cabinets and beautiful hardwood floor in kitchen. Main floor laundry - outside entrance to basement.
-
2016-04-20status Pending 242-char remark
Show marketing remark (242 chars)
800 sq ft ranch with steel siding and thermal windows. Roof 5 yrs - clean and ready to move into. Deck for outside entertaining. Nice kitchen cabinets and beautiful hardwood floor in kitchen. Main floor laundry - outside entrance to basement.
-
2016-02-02$33,500 Active 242-char remark
Show marketing remark (242 chars)
800 sq ft ranch with steel siding and thermal windows. Roof 5 yrs - clean and ready to move into. Deck for outside entertaining. Nice kitchen cabinets and beautiful hardwood floor in kitchen. Main floor laundry - outside entrance to basement.
ⓘ Source: listings_history table (triggers on properties + properties_extension) + one-shot
backfill from property_details.listing_events for pre-trigger history.
Tax reassessment forecast MO · Resets to sale price
- Current annual tax
- $974 · $81/mo
- Projected year-2 tax
- $1,163 · $97/mo
- Expected delta
- +$189/yr (+$16/mo · 19.4%)
ⓘ Screening estimate from a state-policy table — verify with the county assessor before closing.
Climate risk First Street
- Flood 9/10 Extreme FEMA zone X (unshaded) · 99% chance over 30 yrs
- Wildfire 1/10 Low
- Heat 4/10 Moderate 7 d/yr ≥106°F today · 17 d/yr by 30 yrs out
- Wind 2/10 Low
- Air quality 3/10 Moderate 2 unhealthy d/yr today · 3 by 30 yrs out
Nearby sold comps map
Loading sold comps map…
Walkable amenities ~0.75 mi
Loading nearby amenities…
Taxation est. · year 1
- Rental income
- $13,051
- − Mortgage interest
- −$6,716
- − Property taxes
- −$974
- − Insurance
- −$1,266
- − Repairs & maintenance
- −$1,044
- − Management
- −$1,044
- − Depreciation
- −$3,488
- Taxable loss
- −$1,481
- Est. tax savings @ 24.0%
- +$355
- After-tax cash flow
- $881/yr
For passive investors: Depreciation is non-cash, so a rental often shows a tax loss while cash-flowing — sheltering income. Rental losses are passive: they offset passive income freely, and up to $25,000/yr can offset ordinary (W-2) income if you actively participate and your MAGI is under $100k (phasing out to $0 by $150k); unused losses carry forward. On sale, claimed depreciation is recaptured at up to 25%, and gains may owe capital-gains tax (a 1031 exchange can defer both). Figures are a year-1 estimate at your 24.0% rate — not tax advice; consult a CPA.
Schools (NCES district)
- District
- Independence 30
- NCES district ID
- 2915480
- Math proficiency
- 26% ▼ -8.00%
- Reading proficiency
- 38% ▼ -5.00%
- Median HH income
- $41,843
- Composite
- 27.04/100
- National rank
- #7054
- State rank
- #252 of 324 in MO
Livability — Independence
- Score
- 82/100
- State rank
- #10
- US rank
- #1296
Category grades
Schools grade is shown separately in the Schools card above.
Census & demographics
- Census place
- Independence, MO
- County
- Jackson County · 687,798 people
- City population
- 117,675
- Metro
- Kansas City, MO-KS
- Population (ZIP)
- 22,138
- Household income
- $59,007
- Rent vs Own
- Severe rent burden
- 965.0
Population outlook (Jackson County) Hauer SSP2
- Today (2025)
- 719,589 people
- By 2030
- 731,456 · +1.6%
- By 2040
- 746,689 · +3.8%
- By 2050
- 749,289 · +4.1%
- By 2075
- 736,227 · +2.3%
- By 2100
- 668,210 · -7.1%
Race, ethnicity, and origin ACS 2023
- Neighborhood character
- Diverse neighborhood (Simpson 0.56)
- Race & ethnicity
- White 62% Hispanic / Latino 23% Two or more races 15% Black 7% Asian 2%
- Hispanic origin (detail)
- Mexican 15%
- Common ancestry
- Italian 12% Slovak 2% Lithuanian 2%
- Foreign-born
- 11% · Canada, China
- Languages at home
- 85% English-only · Spanish 13% Other Asian/Pacific 1%
Political lean MEDSL · Jackson
- 2024 margin
- D (+19.3) · D 58.9% · R 39.5% · Other 1.6%
- 2008→2024 swing
- -6.1pp toward R · 2008: 25.4pp · 2024: 19.3pp
- All cycles
- 2024: D+19.3 2020: D+22.0 2016: D+16.6 2012: D+19.0 2008: D+25.4
Not yet ingested
- Civics
- —
Market trends
- HPI YoY
- ▼ -160.06%
- Current HPI
- 302.1124
- Rent YoY
- ▲ 5.43%
- Metro
- Kansas City, MO-KS
- State GDP YoY
- ▲ 1.84%
- F500 in state
- 20
Industry mix (Fortune 500 HQ in MO)
| Industry | F500 HQs | Revenue |
|---|---|---|
| Healthcare | 1 | $163B |
|
||
| Insurance | 1 | $21B |
|
||
| Industrial Technology | 1 | $17B |
|
||
| Retail | 1 | $16B |
|
||
| Industrial Distribution | 1 | $10B |
|
||
| Utilities | 1 | $9B |
|
||
Price history
+287.8% since first listed6 events — show timeline
- 2026-05-01 Price Changed $129,900 Heartland MLS as Distributed by MLS Grid
- 2026-04-03 Price Changed $139,900 Heartland MLS as Distributed by MLS Grid
- 2026-02-25 Listed $144,900 Heartland MLS as Distributed by MLS Grid
- 2016-05-16 Sold (MLS) — Heartland MLS as Distributed by MLS Grid
- 2016-04-20 Pending — Heartland MLS as Distributed by MLS Grid
- 2016-02-02 Listed $33,500 Heartland MLS as Distributed by MLS Grid
Property tax history
+4.2%/yrLatest (2025): $974 · -21.2% YoY. Source: county tax records.
Cash-flow waterfall
monthlySold comps — $/sqft
last 12 mo · ≤1 miLoading sold comps…