 10-Plex
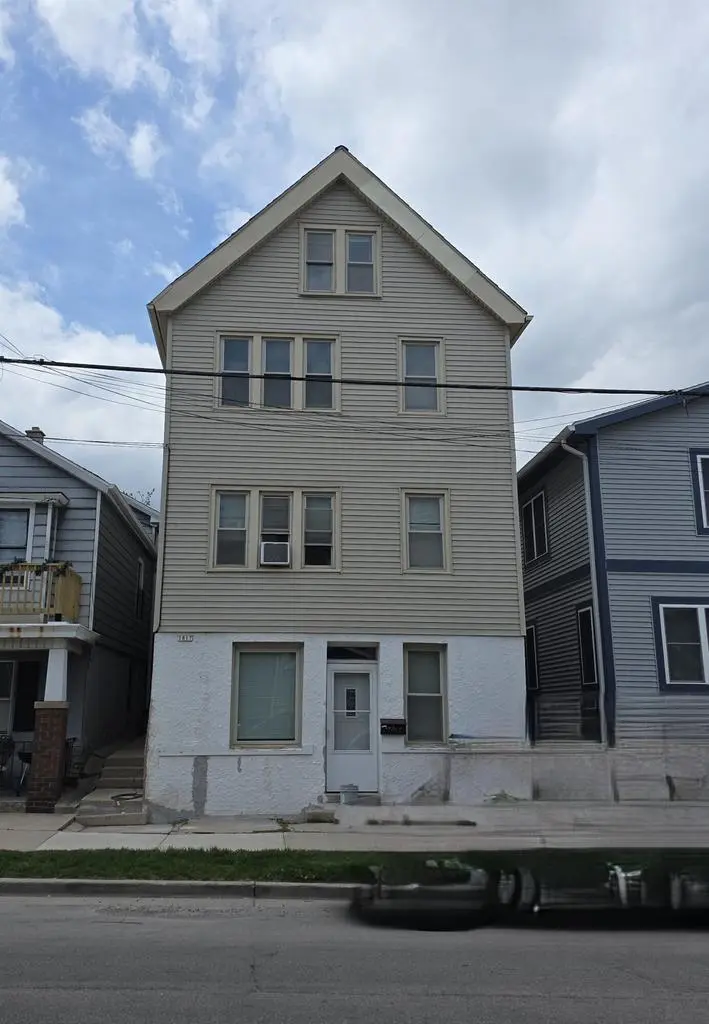
1817 N Humboldt Ave Unit 1838 N Humboldt · Milwaukee, WI
Flood risk 1/10 · Minimal
- FEMA flood zone
- X (unshaded)
- Chance of flooding over 30 yrs
- 0.0%
- Est. flood insurance / yr
- $507 – $1,088
Fire risk 1/10 · Minimal
- Est. fire insurance / yr
- $636 – $1,182
Heat risk 2/10 · Minimal
- Hot days now (above 97°F)
- 7 days/yr
- Hot days in 30 yrs
- 13 days/yr
Wind risk 2/10 · Minimal
- Chance of severe wind over 30 yrs
- —
Air-quality risk 3/10 · Minor
- Unhealthy air days now
- 3 days/yr
- Unhealthy air days in 30 yrs
- 4 days/yr
Risk factors via First Street. Map © Google.
Why this score? — see what drove the B- grade
The composite is a weighted blend of 9 inputs, each scored 0–100. Each bar is that input's sub-score; the figure is the points it added to the 100-point composite (weight × sub-score).
- Cash flow +28.2/30.0
- DSCR +10.0/10.0
- 1% rule +7.8/10.0
- ARV discount +7.5/15.0
- Livability +4.0/5.0
- Condition / age +4.0/5.0
- Rent growth +2.9/5.0
- Schools +1.2/10.0
- Appreciation +0.0/10.0
$1,260,000
🖨 Deal sheet 📄 Offer letter ✓ Due diligence
Multi-family units
County records classify this as Multi-Family (5+ Unit). Listing-text estimate: 10 units. confirmed
5+ unit building — per-unit beds/baths from public records are typically unavailable; the breakdown below (if shown) is an estimate from the listing text.
Listing remarks
Discover a premier investment opportunity with Humboldt for Sale, a 10-unit multifamily property located at 1817 & 1838 NHumboldt Ave, Milwaukee, WI 53202. Nestled in the vibrant East Side neighborhood, this property offers a strategic location justminutes from downtown Milwaukee, providing easy access to shopping, dining, and entertainment. The area is renowned for itscultural richness and strong rental demand, making it an attractive choice for investors seeking stable returns. With modernamenities and well-maintained units, Humboldt for Sale promises consistent cash flow and potential for appreciation. Wellmaintained, remodeled units, new roof, new patio, tuck pointing.
Key facts
- Modern amenities
- Strategic location
- New roof
Tags
Property features AI
Finance
- Other: Inclusions: coin-operated washer/dryer and all seller-owned appliances; Exclusions: tenants' personal property
- Financial info: 10 units in the building
Exterior
- Parking: Outdoor space for parking; Indoor parking available; Outside parking
- Utilities: Municipal water; Municipal sewer
- Home design: Multi-family property; Apartment building / Duplex+; 3-4 stories
- Construction: Less than 1/2 acre lot (approximately 0.18 acre); Zoned RT4
- Exterior features: Stucco/slate and vinyl exterior
Interior
- Heating & cooling: Forced air heating; Natural gas fuel
- Interior features: Full basement with walk-out/outer door; Basement includes laundry facilities
- Laundry & utility: Seller-owned washer; Seller-owned dryer; Seller-owned water heater
Neighborhood map
What this means for you Summary
Snapshot
- This is a 10 × 2-bed/?-bath units multifamily listed at $1.26M. Condition is rated good.
Deal economics
- At list price, monthly cash flow is $4k ($48k/yr) — positive. Per door: $399/mo.
- The deal already cash-flows at list — no discount required.
- Meets the 1% rule at list price ($16k rent vs $1.26M).
- Cap rate 10.1% vs local median 5.1% in Milwaukee — top-decile yield for the area; either an underpriced asset or a hidden risk that comps aren't pricing in. Stress-test before assuming the spread holds.
Location & tenants
- Location reads 81/100 on livability (#55 in WI, #1,534 nationally) — a professional / high-income tenant draw. Strengths: amenities A+, commute A+, cost of living A+; Watch: employment D+, schools F, crime F.
- Milwaukee School District (urban): math 10% / reading 18% proficiency, ranked #337 of 342 in WI (top 98%) — low school quality limits family demand, transient renter base, plan for 1-2y turnover; 77% free/reduced lunch — lower-income household profile, screen leases tightly.
- Market conditions: Rents rising (+1.6%/yr); 146 active listings in the ZIP; 1,017 units permitted in Milwaukee County in 2024 (803 in 5+ unit buildings).
- At $16,079/mo this rent would consume 272% of the median local household income ($71k/yr) (locally 2752% of renters already pay >50% of income on rent) — very limited rent-growth headroom before tenants either downsize or default.
Forward outlook
- Local home prices are declining (-3.0%/yr); year-one equity from $9k of loan paydown is wiped out by about $38k of value loss. Plan a longer hold.
- Milwaukee County population projected at +4% by 2050 — modest demand growth; plan on rents tracking national, not racing it.
- At projected returns (-3.0% appreciation + 1.6% rent growth), your $353k cash investment doubles in ~10 years — after that, you're playing with house money.
Negotiation context
- Only 10 days on market — expect competitive offers; lowballing is unlikely to land.
Risks & watch-outs
- Watch-outs: built in 1890 — expect roof / HVAC / electrical / plumbing capex.
Questions for the listing agent
- Can we see the unit-by-unit rent roll, current vacancy, and any below-market leases? What's the average tenancy length?
- What capital expenditures (roof, boiler, parking lot, exteriors) have been made in the last 5 years, and what's planned in the next 2?
- Built in 1890 — when were the roof, HVAC, electrical panel, plumbing, and water heater last replaced?
- Is there a deadline driving the sale (1031 exchange, divorce, estate, relocation)? That informs how much negotiation room exists.
- Schools are F-rated, which usually means shorter tenancies and higher turnover. Who's the typical renter profile here, and what's been the actual vacancy rate?
- Crime grade is F in this area — have there been break-ins, vandalism, or insurance claims at this property in the last 3 years? What carrier currently insures it and at what premium?
- What's the average days-on-market for RENTAL listings here right now (not sales)? A rising rental-DOM trend means longer vacancies and softer asking-rent achievability than the comps imply.
- What's the recent tenant-quality profile in this submarket — average credit score on applications, eviction rate, late-payment / NSF rate, and stable-employment percentage? A property-management company in the area should have these aggregated.
- How much new apartment / multifamily construction is in the pipeline within 1–3 miles? Heavy new supply (>2% of stock underway) typically softens rents 12–24 months out; light construction supports rent growth.
Investment metrics
- 1% rule
- 1.28% ✓
- Cap rate
- 10.10%
- Cash-on-cash
- 13.59%
- DSCR
- 1.60
- GRM
- 6.5
CMA / ARV
- ARV (on-the-fly)
- $777,630
- Comps found
- 4
Show comp detail 4 sales within ~0.75 mi
| Address | Dist | Beds/Ba | Sqft | Sold | Price | $/sf | Match |
|---|---|---|---|---|---|---|---|
| 1815 N Oakland Ave | 0.31mi | —/— | 6,147 (-9%) | 5mo | $750,000 | $122 | 66 |
| 2237 N Hubbard St | 0.63mi | —/— | 6,848 (+1%) | 7mo | $780,000 | $114 | 63 |
| 1502 E Royall Pl #1504 | 0.32mi | —/— | 5,894 (-13%) | 5mo | $675,000 | $115 | 59 |
| 2017 N Hubbard St #2019 | 0.54mi | —/— | 6,268 (-7%) | 17mo | $720,000 | $115 | 48 |
Match score weights: distance 35% · size 25% · config 20% · recency 20%. Top-matched comps best support the ARV.
Projected returns pro-forma
-3.0% appreciation · 1.56% rent growth · sell at horizon
- IRR
- 2.1%
- Equity multiple
- 1.08×
- Total profit
- $27,533
- Equity at exit
- $187,870
- IRR
- 10.2%
- Equity multiple
- 1.74×
- Total profit
- $261,028
- Equity at exit
- $108,942
Cash invested: $352,800 (down + closing). Projections, not guarantees.
Landlord ↔ Tenant lean methodology
- Overall (STATE)
- 73 Landlord-Friendly
- State Wisconsin
- 73 Landlord-Friendly · R+2
- County
- — inherits STATE
- City
- — inherits STATE
ZIP-level market 53202
- Rents YoY
- 1.6%
- Active inventory
- 146
- Price-to-rent
- 65.3×
Monthly cashflow live
- Estimated rent
- $16,079 high interval (Pro) →
- Mortgage (P&I)
- −$6,608
- Tax est. 1.5%
- −$1,575 /mo · $18,900/yr
- Insurance
- −$525
- HOA
- −$0
- Vacancy / Maint / Mgmt
- −$3,377
- Net cashflow
- $3,995
Break-even live
10-unit breakdown (identical units grouped — click to expand)
| Units | Beds | Baths | Est. rent |
|---|---|---|---|
| 10× units | 2 | — | $16,080 |
| #1 | 2 | — | $1,608 |
| #2 | 2 | — | $1,608 |
| #3 | 2 | — | $1,608 |
| #4 | 2 | — | $1,608 |
| #5 | 2 | — | $1,608 |
| #6 | 2 | — | $1,608 |
| #7 | 2 | — | $1,608 |
| #8 | 2 | — | $1,608 |
| #9 | 2 | — | $1,608 |
| #10 | 2 | — | $1,608 |
| Total (10 units) | $16,079 | ||
UW: 25.0% down · 7.5% · 30yr · 1.5% tax · 5.0% vac · 8.0% maint · 8.0% mgmt
Financing live
Cash to close
- Down payment
- $315,000
- Closing costs
- $37,800
- Reserves months
- —
- Total cash needed
- —
Loan-product check · same deal, 3 products live
Conventional
25% down · 7.5% · 30yr
- Down + closing
- —
- Monthly P&I
- —
- Monthly cashflow
- —
- DSCR
- —
- Eligible?
- —
Personal DTI + credit; lowest rate.
DSCR
20% down · 8.5% · 30yr
- Down + closing
- —
- Monthly P&I
- —
- Monthly cashflow
- —
- DSCR
- —
- Eligible?
- —
No personal income docs; deal must DSCR.
Hard money
10% down · 12.0% · 12mo
- Down + closing
- —
- Monthly P&I
- —
- Monthly cashflow
- —
- DSCR
- —
- Eligible?
- —
Short-term bridge; refi at stabilization.
Listing history 8 events
-
2026-06-18days on market $1,260,000 Active 10 DOM
-
2026-06-17days on market $1,260,000 Active 9 DOM
-
2026-06-16days on market $1,260,000 Active 8 DOM
-
2026-06-15days on market $1,260,000 Active 7 DOM
-
2026-06-13days on market $1,260,000 Active 5 DOM
-
2026-06-13days on market $1,260,000 Active 4 DOM
-
2026-06-08remarks 683-char remark
-
2026-06-08$1,260,000 Active 1 DOM
ⓘ Source: listings_history table (triggers on properties + properties_extension) + one-shot
backfill from property_details.listing_events for pre-trigger history.
Climate risk First Street
- Flood 1/10 Low FEMA zone X (unshaded) · 0% chance over 30 yrs
- Wildfire 1/10 Low
- Heat 2/10 Low 7 d/yr ≥97°F today · 13 d/yr by 30 yrs out
- Wind 2/10 Low
- Air quality 3/10 Moderate 3 unhealthy d/yr today · 4 by 30 yrs out
Nearby sold comps map
Loading sold comps map…
Walkable amenities ~0.75 mi
Loading nearby amenities…
Taxation est. · year 1
- Rental income
- $192,948
- − Mortgage interest
- −$70,580
- − Property taxes
- −$18,900
- − Insurance
- −$6,300
- − Repairs & maintenance
- −$15,436
- − Management
- −$15,436
- − Depreciation
- −$36,655
- Taxable income
- $29,642
- Est. tax owed @ 24.0%
- −$7,114
- After-tax cash flow
- $40,824/yr
For passive investors: Depreciation is non-cash, so a rental often shows a tax loss while cash-flowing — sheltering income. Rental losses are passive: they offset passive income freely, and up to $25,000/yr can offset ordinary (W-2) income if you actively participate and your MAGI is under $100k (phasing out to $0 by $150k); unused losses carry forward. On sale, claimed depreciation is recaptured at up to 25%, and gains may owe capital-gains tax (a 1031 exchange can defer both). Figures are a year-1 estimate at your 24.0% rate — not tax advice; consult a CPA.
Condition & rehab AI · 12 photos
This multifamily property is in good condition with recent renovations and improvements, making it a solid investment opportunity.
Value-add opportunities
- Both Landscaping and curb appeal improvements — Enhances curb appeal and could attract more tenants.
- Both Painting exterior and interior walls — Fresh paint can improve the home's appearance and value.
- Both Upgrading lighting fixtures — Modern lighting can enhance the home's ambiance and appeal to potential buyers/tenants.
- Both Adding smart home features — Smart home features can increase convenience and appeal to tech-savvy buyers/tenants.
- Both Upgrading appliances — Modern appliances can improve the home's functionality and appeal to potential buyers/tenants.
Renovation cost estimate screening
Value-add ROI direction
- Both Landscaping and curb appeal improvements — Enhances curb appeal and could attract more tenants. ↑
- Both Painting exterior and interior walls — Fresh paint can improve the home's appearance and value. ↑
- Both Upgrading lighting fixtures — Modern lighting can enhance the home's ambiance and appeal to potential buyers/tenants. ↑
- Both Adding smart home features — Smart home features can increase convenience and appeal to tech-savvy buyers/tenants. ↑
- Both Upgrading appliances — Modern appliances can improve the home's functionality and appeal to potential buyers/tenants. ↑
ⓘ Cost ranges are severity-bucket heuristics (US national rule-of-thumb). Get contractor quotes + a written scope before underwriting a rehab budget.
Schools (NCES district)
- District
- Milwaukee School District
- NCES district ID
- 5509600
- Math proficiency
- 10% ▼ -5.00%
- Reading proficiency
- 18% ▬ 0.00%
- Median HH income
- $36,339
- Composite
- 11.61/100
- National rank
- #9696
- State rank
- #337 of 342 in WI
Livability — Milwaukee
- Score
- 81/100
- State rank
- #55
- US rank
- #1534
Category grades
Schools grade is shown separately in the Schools card above.
Census & demographics
- Census place
- Milwaukee, WI
- County
- Milwaukee County · 926,379 people
- City population
- 573,768
- Metro
- Milwaukee-Waukesha, WI
- Population (ZIP)
- 25,861
- Household income
- $71,034
- Rent vs Own
- Severe rent burden
- 2752.0
Population outlook (Milwaukee County) Hauer SSP2
- Today (2025)
- 995,758 people
- By 2030
- 1,009,124 · +1.3%
- By 2040
- 1,028,128 · +3.3%
- By 2050
- 1,040,066 · +4.4%
- By 2075
- 1,057,849 · +6.2%
- By 2100
- 1,039,774 · +4.4%
Race, ethnicity, and origin ACS 2023
- Neighborhood character
- Predominantly White (75%)
- Race & ethnicity
- White 75% Black 8% Two or more races 6% Hispanic / Latino 6% Asian 5%
- Hispanic origin (detail)
- Mexican 3%
- Common ancestry
- Romanian 9% Portuguese 4% Lithuanian 2%
- Foreign-born
- 10% · Canada, South Korea
- Languages at home
- 89% English-only · Spanish 4% Other Indo-European 2% Other Asian/Pacific 1%
Political lean MEDSL · Milwaukee
- 2024 margin
- Solid D (+38.5) · D 68.3% · R 29.8% · Other 1.8%
- 2008→2024 swing
- +2.7pp toward D · 2008: 35.9pp · 2024: 38.5pp
- All cycles
- 2024: D+38.5 2020: D+39.9 2016: D+37.5 2012: D+34.6 2008: D+35.9
Not yet ingested
- Civics
- —
Market trends
- HPI YoY
- ▼ -133.46%
- Current HPI
- 226.4316
- Rent YoY
- ▲ 1.56%
- Metro
- Milwaukee-Waukesha, WI
- State GDP YoY
- ▲ 2.10%
- F500 in state
- 20
Industry mix (Fortune 500 HQ in WI)
| Industry | F500 HQs | Revenue |
|---|---|---|
| Industrial Machinery | 4 | $23B |
|
||
| Industrial Technology | 2 | $36B |
|
||
| Insurance | 1 | $36B |
|
||
| Professional Services | 1 | $19B |
|
||
| Utilities | 1 | $9B |
|
||
| Consumer Goods | 1 | $3B |
|
||
Price history
1 event — show timeline
- 2026-06-05 Listed $1,260,000 METROMLS
Cash-flow waterfall
monthlySold comps — $/sqft
last 12 mo · ≤1 miLoading sold comps…