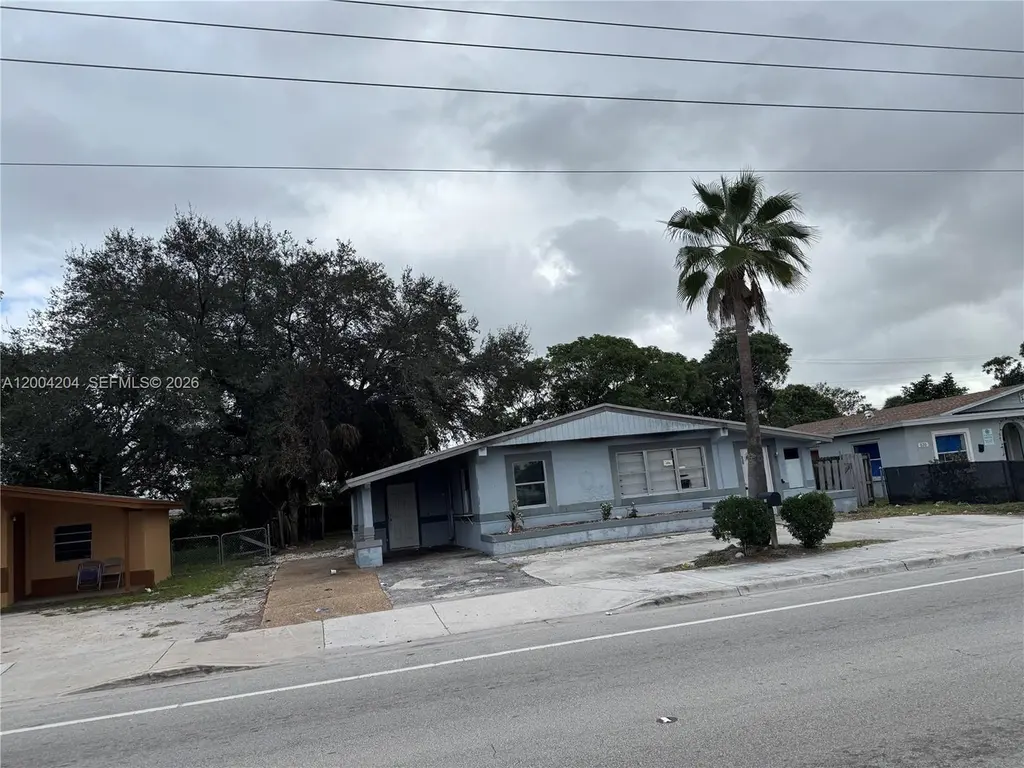
530 NW 31st Ave · Boulevard Gardens, FL
Flood risk 1/10 · Minimal
- FEMA flood zone
- X (shaded)
- Chance of flooding over 30 yrs
- 0.0%
- Est. flood insurance / yr
- $507 – $1,088
Fire risk 1/10 · Minimal
- Est. fire insurance / yr
- $947 – $1,759
Heat risk 9/10 · Severe
- Hot days now (above 105°F)
- 5 days/yr
- Hot days in 30 yrs
- 16 days/yr
Wind risk 10/10 · Severe
- Chance of severe wind over 30 yrs
- 99.0%
Air-quality risk 2/10 · Minimal
- Unhealthy air days now
- 2 days/yr
- Unhealthy air days in 30 yrs
- 2 days/yr
Risk factors via First Street. Map © Google.
Why this score? — see what drove the B- grade
The composite is a weighted blend of 9 inputs, each scored 0–100. Each bar is that input's sub-score; the figure is the points it added to the 100-point composite (weight × sub-score).
- Cash flow +24.3/30.0
- ARV discount +15.0/15.0
- 1% rule +7.8/10.0
- DSCR +7.8/10.0
- Livability +4.2/5.0
- Schools +4.1/10.0
- Rent growth +3.2/5.0
- Condition / age +2.5/5.0
- Appreciation +0.0/10.0
$224,999
🖨 Deal sheet 📄 Offer letter ✓ Due diligence
Listing remarks MLS
Seller provides $660.00 towards buyers closings costs. Seller is selling in 'As-Is' condition & will make no repairs. Seller & agent make no representations or guarantees. Seller or agent do not have any knowledge of any defects that would affect value of property. Buyer must verify all info. Seller will not pay for or provide survey. Buyer to change locks upon closing. AS-IS CONTRACT. PROOF OF FUNDS OR PRE-APPROVAL LETTER AND COPY OF ESCROW DEPOSIT CHECK REQUIRED WITH ALL OFFERS (NO EXCEPTIONS).
Key facts
- 8,294 sq ft lot
- 2 garage spots
- Built 1959
Property features AI
Exterior
- Parking: 2-car garage; Driveway with 2 covered spaces
- Utilities: Public water; Public sewer
- Home design: Single-story home; Faces north
- Construction: Block construction; Flat and tile roof; Year built unknown
- Exterior features: Fenced yard; Fruit trees; Storage shed
Interior
- Bedrooms: Includes an attic (additional flexible room)
- Flooring: Concrete flooring
- Bathrooms: 1 full bathroom
- Heating & cooling: Central heating; Electric cooling
- Interior features: First-floor entry; Bedroom on main level; Attic
Neighborhood map
What this means for you Summary
Snapshot
- This is a 3-bed/1.0-bath single-family listed at $225k.
Deal economics
- At list price, monthly cash flow is $452 ($5k/yr) — positive.
- The deal already cash-flows at list — no discount required.
- Meets the 1% rule at list price ($3k rent vs $225k).
- Recommended offer: $222k (1.5% below list) — sets the bar for market timing.
Location & tenants
- Location reads 85/100 on livability (#22 in FL, #511 nationally) — a professional / high-income tenant draw. Strengths: crime A+, commute A+, housing A+; Watch: amenities F.
- Broward (suburban): math 42% / reading 53% proficiency, ranked #46 of 73 in FL (top 63%) — families likely to look elsewhere, expect single-tenant / working-renter base with shorter leases.
- Market conditions: Rents rising (+2.8%/yr); 585 active listings in the ZIP; 40 comparable units currently listed for rent nearby; rentals at typical pace (median 22d on market — plan ~3-4 weeks tenant-placement turnaround); 2,111 units permitted in Broward County in 2024 (1,265 in 5+ unit buildings).
- At $2,878/mo this rent would consume 64% of the median local household income ($54k/yr) (locally 5068% of renters already pay >50% of income on rent) — very limited rent-growth headroom before tenants either downsize or default.
Forward outlook
- Local home prices are declining (-3.0%/yr); year-one equity from $2k of loan paydown is wiped out by about $7k of value loss. Plan a longer hold.
- Broward County population projected at +34% by 2050 — long-run rental-demand tailwind backs the buy-and-hold thesis.
Negotiation context
- It's been on market 23 days — a 2% lower offer ($222k) is reasonable based on typical stale-listing flexibility.
- 3 sale attempts since 17y ago; this cycle's ask is 5% above the opening price — seller raised mid-cycle; expect resistance to lowballs.
- Current owner paid $85k; list at $225k implies a 165% gain — meaningful room to come down on a strong offer.
Risks & watch-outs
- Watch-outs: property tax is 2.9% of price; built in 1959 — expect roof / HVAC / electrical / plumbing capex.
- Climate carrying-cost: severe wind risk, 99% chance of damaging wind over 30y; extreme-heat days projected 5→16/yr by 2055 (HVAC capex compounding) — expect insurance premiums to compound above CPI over the hold.
Questions for the listing agent
- Built in 1959 — when were the roof, HVAC, electrical panel, plumbing, and water heater last replaced?
- Property tax is high relative to price — has the assessment been appealed recently, and will the sale trigger a re-assessment?
- Is there a deadline driving the sale (1031 exchange, divorce, estate, relocation)? That informs how much negotiation room exists.
- What's the average days-on-market for RENTAL listings here right now (not sales)? A rising rental-DOM trend means longer vacancies and softer asking-rent achievability than the comps imply.
- What's the recent tenant-quality profile in this submarket — average credit score on applications, eviction rate, late-payment / NSF rate, and stable-employment percentage? A property-management company in the area should have these aggregated.
- How much new for-sale + rental construction is in the pipeline within 1–3 miles? Heavy new supply typically softens prices + rents 12–24 months out; constrained supply supports both.
Investment metrics
- 1% rule
- 1.28% ✓
- Cap rate
- 8.70%
- Cash-on-cash
- 8.60%
- DSCR
- 1.38
- GRM
- 6.5
CMA / ARV
- ARV (on-the-fly)
- $428,676
- Comps found
- 2
Show comp detail 2 sales within ~0.75 mi
| Address | Dist | Beds/Ba | Sqft | Sold | Price | $/sf | Match |
|---|---|---|---|---|---|---|---|
| 881 NW 34th Way | 0.62mi | 3/2.0 | 1,102 (+7%) | 23mo | $368,000 | $334 | 36 |
| 3571 NW 4th St | 0.65mi | 3/1.0 | 912 (-11%) | 24mo | $380,000 | $417 | 31 |
Match score weights: distance 35% · size 25% · config 20% · recency 20%. Top-matched comps best support the ARV.
Projected returns pro-forma
-3.0% appreciation · 2.78% rent growth · sell at horizon
- IRR
- -3.4%
- Equity multiple
- 0.87×
- Total profit
- $-8,127
- Equity at exit
- $33,548
- IRR
- 6.1%
- Equity multiple
- 1.45×
- Total profit
- $28,204
- Equity at exit
- $19,454
Cash invested: $63,000 (down + closing). Projections, not guarantees.
Landlord ↔ Tenant lean methodology
- Overall (STATE)
- 87 Strongly Landlord-Friendly
- State Florida
- 87 Strongly Landlord-Friendly · R+3
- County
- — inherits STATE
- City
- — inherits STATE
ZIP-level market 33311
- Rents YoY
- 2.8%
- Active inventory
- 585
- Price-to-rent
- 6.5×
Monthly cashflow live
- Estimated rent
- $2,878 high interval (Pro) →
- Mortgage (P&I)
- −$1,180
- Tax from tax record
- −$549 /mo · $6,583/yr
- Insurance
- −$94
- HOA
- −$0
- Vacancy / Maint / Mgmt
- −$604
- Net cashflow
- $452
Break-even live
UW: 25.0% down · 7.5% · 30yr · 1.5% tax · 5.0% vac · 8.0% maint · 8.0% mgmt
Financing live
Cash to close
- Down payment
- $56,250
- Closing costs
- $6,750
- Reserves months
- —
- Total cash needed
- —
Loan-product check · same deal, 3 products live
Conventional
25% down · 7.5% · 30yr
- Down + closing
- —
- Monthly P&I
- —
- Monthly cashflow
- —
- DSCR
- —
- Eligible?
- —
Personal DTI + credit; lowest rate.
DSCR
20% down · 8.5% · 30yr
- Down + closing
- —
- Monthly P&I
- —
- Monthly cashflow
- —
- DSCR
- —
- Eligible?
- —
No personal income docs; deal must DSCR.
Hard money
10% down · 12.0% · 12mo
- Down + closing
- —
- Monthly P&I
- —
- Monthly cashflow
- —
- DSCR
- —
- Eligible?
- —
Short-term bridge; refi at stabilization.
Rent comps 40 comps
| Address | Beds | Baths | Sqft | Rent | $/sqft | DOM | Units | Dist |
|---|---|---|---|---|---|---|---|---|
| 540 NW 31st Ave Fort Lauderdale, FL | 4.0 | 2.0 | 1097 | $2,900 | $2.64 | 7d | 1 | 0.04mi |
| 2900 NW 5th Ct Fort Lauderdale, FL | 4.0 | 2.0 | 1112 | $3,250 | $2.92 | 19d | 1 | 0.20mi |
| 280 NW 31st Ave Fort Lauderdale, FL | 3.0 | 2.0 | 884 | $2,700 | $3.05 | 17d | 1 | 0.21mi |
| 721 NW 33rd Ave Lauderhill, FL | 3.0 | 2.0 | 874 | $2,750 | $3.15 | 5d | 1 | 0.32mi |
| 2850 NW 7th St Fort Lauderdale, FL | 3.0 | 2.0 | 1169 | $3,000 | $2.57 | 24d | 1 | 0.33mi |
| 720 NW 33rd Ter Lauderhill, FL | 3.0 | 1.0 | 1340 | $2,560 | $1.91 | 22d | 1 | 0.35mi |
| 2804 NW 7th Ct Fort Lauderdale, FL | 3.0 | 2.0 | 1381 | $1,300 | $0.94 | 24d | 1 | 0.42mi |
| 2804 NW 7th Ct Unit 2804 Fort Lauderdale, FL | 3.0 | 2.0 | 1381 | $3,500 | $2.53 | 20d | 1 | 0.42mi |
| 3025 NW 8th Rd Fort Lauderdale, FL | 3.0 | 1.0 | 947 | $2,520 | $2.66 | 24d | 1 | 0.42mi |
| 10 NW 28th Way Fort Lauderdale, FL | 3.0 | 1.0 | 1232 | $1,950 | $1.58 | 3d | 1 | 0.44mi |
| 204 NW 28th Ave Unit 1 Fort Lauderdale, FL | 2.0 | 1.0 | 1236 | $1,850 | $1.50 | 3d | 1 | 0.45mi |
| 2810 NW 8th Ct Fort Lauderdale, FL | 3.0 | 2.0 | 1435 | $2,850 | $1.99 | 24d | 1 | 0.46mi |
| 891 NW 34th Way Lauderhill, FL | 3.0 | 2.0 | 1283 | $2,950 | $2.30 | 24d | 1 | 0.65mi |
| 2750 SW 2nd Ct Fort Lauderdale, FL | 3.0 | 1.0 | 1187 | $2,385 | $2.01 | 17d | 1 | 0.68mi |
| 2781 SW 4th St Unit 2781 Fort Lauderdale, FL | 3.0 | 2.0 | 1413 | $3,200 | $2.26 | 22d | 1 | 0.76mi |
| 2451 NW 8th Pl Unit 1 Fort Lauderdale, FL | 2.0 | 1.0 | 1250 | $1,525 | $1.22 | 22d | 1 | 0.78mi |
| 600 NW 38th Ave Lauderhill, FL | 4.0 | 2.0 | 1428 | $2,700 | $1.89 | 24d | 1 | 0.78mi |
| 2435 NW 8th Pl Unit 2 Fort Lauderdale, FL | 2.0 | 1.0 | 1250 | $1,500 | $1.20 | 22d | 1 | 0.78mi |
| 2435 NW 8th Pl Unit 2 Fort Lauderdale, FL | 2.0 | 1.0 | 1250 | $1,500 | $1.20 | 2d | 1 | 0.78mi |
| 2401 NW 7th St Fort Lauderdale, FL | 3.0 | 2.0 | 1300 | $3,600 | $2.77 | 24d | 1 | 0.79mi |
| 2911 NW 11th St Fort Lauderdale, FL | 4.0 | 2.0 | 1127 | $3,500 | $3.11 | 24d | 1 | 0.81mi |
| 2941 NW 11th Ct Fort Lauderdale, FL | 3.0 | 1.0 | 968 | $2,200 | $2.27 | 24d | 1 | 0.83mi |
| 3651 NW 8th Ct Lauderhill, FL | 3.0 | 2.0 | 1369 | $3,250 | $2.37 | 5d | 1 | 0.85mi |
| 3651 NW 8th Ct Lauderhill, FL | 3.0 | 2.0 | 1369 | $3,500 | $2.56 | 17d | 1 | 0.85mi |
| 180 Penn Way Fort Lauderdale, FL | 4.0 | 2.0 | 1378 | $3,550 | $2.58 | 7d | 1 | 0.85mi |
| 2825 SW 5th St Fort Lauderdale, FL | 3.0 | 1.0 | 1311 | $3,000 | $2.29 | 24d | 1 | 0.86mi |
| 2500 NW 9th Ct Fort Lauderdale, FL | 3.0 | 2.0 | 780 | $2,375 | $3.04 | 20d | 1 | 0.88mi |
| 2701 SW 4th Pl Fort Lauderdale, FL | 2.0 | 2.0 | 820 | $2,430 | $2.96 | 5d | 8 | 0.88mi |
| 420 SW 27th Ave Fort Lauderdale, FL | 3.0 | 1.0–2.0 | 1024 | $3,759 | $3.67 | 24d | 1 | 0.89mi |
| 2217 SW 1st Ct Unit 2217 Fort Lauderdale, FL | 3.0 | 2.0 | 1350 | $3,650 | $2.70 | 24d | 1 | 0.91mi |
| 2217 SW 1st Ct Unit 2217 Fort Lauderdale, FL | 3.0 | 2.0 | 1350 | $3,650 | $2.70 | 7d | 1 | 0.91mi |
| 3740 NW 9th St Lauderhill, FL | 3.0 | 2.0 | 1208 | $2,900 | $2.40 | 7d | 1 | 0.91mi |
| 918 NW 24th Ave Fort Lauderdale, FL | 3.0 | 1.0 | 1332 | $2,300 | $1.73 | 24d | 1 | 0.91mi |
| 1230 NW 29th Way Fort Lauderdale, FL | 3.0 | 1.0 | 1275 | $2,395 | $1.88 | 24d | 1 | 0.93mi |
| 331 NW 39th Ave #1 Plantation, FL | 4.0 | 1.0 | 1096 | $3,000 | $2.74 | 24d | 1 | 0.96mi |
| 101 SW 22nd Ave Fort Lauderdale, FL | 3.0 | 2.0 | 1010 | $7,500 | $7.43 | 17d | 1 | 0.96mi |
| 401 SW 25th Ave Fort Lauderdale, FL | 3.0 | 1.5 | 1065 | $3,200 | $3.00 | 7d | 1 | 0.99mi |
| 630 SW 28th Dr Fort Lauderdale, FL | 3.0 | 2.0 | 1467 | $3,300 | $2.25 | 24d | 1 | 1.00mi |
| 2231 NW 9th Pl Unit H Fort Lauderdale, FL | 3.0 | 2.0 | 864 | $2,700 | $3.12 | 11d | 1 | 1.00mi |
| 3860 NW 8th Pl Lauderhill, FL | 3.0 | 1.0 | 1241 | $2,700 | $2.18 | 22d | 1 | 1.01mi |
Listing history 17 events
-
2026-06-18days on market $224,999 Active 23 DOM
-
2026-06-17days on market $224,999 Active 22 DOM
-
2026-06-16days on market $224,999 Active 21 DOM
-
2026-06-15days on market $224,999 Active 20 DOM
-
2026-06-13days on market $224,999 Active 18 DOM
-
2026-06-09days on market $224,999 Active 14 DOM
-
2026-06-08days on market $224,999 Active 13 DOM
-
2026-06-07days on market $224,999 Active 12 DOM
-
2026-06-04pricestatusdays on market $224,999 Active 9 DOM
-
2026-04-28status Pending
-
2026-04-16$214,999 Active
-
2025-12-20historical
-
2025-12-03$225,000 Active
-
2010-08-06soldstatus $85,000
-
2009-05-15soldstatus $20,000 515-char remark
Show marketing remark (515 chars)
Seller provides $660.00 towards buyers closings costs. Seller is selling in 'As-Is' condition & will make no repairs. Seller & agent make no representations or guarantees. Seller or agent do not have any knowledge of any defects that would affect value of property. Buyer must verify all info. Seller will not pay for or provide survey. Buyer to change locks upon closing. AS-IS CONTRACT. PROOF OF FUNDS OR PRE-APPROVAL LETTER AND COPY OF ESCROW DEPOSIT CHECK REQUIRED WITH ALL OFFERS (NO EXCEPTIONS).
-
2009-02-20$32,200 515-char remark
Show marketing remark (515 chars)
Seller provides $660.00 towards buyers closings costs. Seller is selling in 'As-Is' condition & will make no repairs. Seller & agent make no representations or guarantees. Seller or agent do not have any knowledge of any defects that would affect value of property. Buyer must verify all info. Seller will not pay for or provide survey. Buyer to change locks upon closing. AS-IS CONTRACT. PROOF OF FUNDS OR PRE-APPROVAL LETTER AND COPY OF ESCROW DEPOSIT CHECK REQUIRED WITH ALL OFFERS (NO EXCEPTIONS).
-
1966-09-01soldstatus $10,800
ⓘ Source: listings_history table (triggers on properties + properties_extension) + one-shot
backfill from property_details.listing_events for pre-trigger history.
Tax reassessment forecast FL · Resets to sale price
- Current annual tax
- $6,583 · $549/mo
- Projected year-2 tax
- $6,583 · $549/mo
- Expected delta
- $0/yr ($0/mo · 0.0%)
ⓘ Screening estimate from a state-policy table — verify with the county assessor before closing.
Climate risk First Street
- Flood 1/10 Low FEMA zone X (shaded) · 0% chance over 30 yrs
- Wildfire 1/10 Low
- Heat 9/10 Extreme 5 d/yr ≥105°F today · 16 d/yr by 30 yrs out
- Wind 10/10 Extreme 99% chance of damaging wind over 30 yrs
- Air quality 2/10 Low 2 unhealthy d/yr today · 2 by 30 yrs out
Nearby sold comps map
Loading sold comps map…
Walkable amenities ~0.75 mi
Loading nearby amenities…
Taxation est. · year 1
- Rental income
- $34,539
- − Mortgage interest
- −$12,603
- − Property taxes
- −$6,583
- − Insurance
- −$1,125
- − Repairs & maintenance
- −$2,763
- − Management
- −$2,763
- − Depreciation
- −$6,545
- Taxable income
- $2,156
- Est. tax owed @ 24.0%
- −$517
- After-tax cash flow
- $4,901/yr
For passive investors: Depreciation is non-cash, so a rental often shows a tax loss while cash-flowing — sheltering income. Rental losses are passive: they offset passive income freely, and up to $25,000/yr can offset ordinary (W-2) income if you actively participate and your MAGI is under $100k (phasing out to $0 by $150k); unused losses carry forward. On sale, claimed depreciation is recaptured at up to 25%, and gains may owe capital-gains tax (a 1031 exchange can defer both). Figures are a year-1 estimate at your 24.0% rate — not tax advice; consult a CPA.
Schools (NCES district)
- District
- Broward
- NCES district ID
- 1200180
- Math proficiency
- 42% ▼ -18.00%
- Reading proficiency
- 53% ▼ -5.00%
- Median HH income
- $52,139
- Composite
- 40.88/100
- National rank
- #3621
- State rank
- #46 of 73 in FL
Livability — Boulevard Gardens
- Score
- 85/100
- State rank
- #22
- US rank
- #511
Category grades
Schools grade is shown separately in the Schools card above.
Census & demographics
- Census place
- Boulevard Gardens, FL
- County
- Broward County · 1,963,430 people
- Metro
- Miami-Fort Lauderdale-Pompano Beach, FL
- Population (ZIP)
- 74,898
- Household income
- $53,973
- Rent vs Own
- Severe rent burden
- 5068.0
Population outlook (Broward County) Hauer SSP2
- Today (2025)
- 2,207,033 people
- By 2030
- 2,360,704 · +7.0%
- By 2040
- 2,661,208 · +20.6%
- By 2050
- 2,946,698 · +33.5%
- By 2075
- 3,602,273 · +63.2%
- By 2100
- 3,970,984 · +79.9%
Race, ethnicity, and origin ACS 2023
- Neighborhood character
- Predominantly Black (77%)
- Race & ethnicity
- Black 77% Two or more races 9% White 9% Hispanic / Latino 9%
- Hispanic origin (detail)
- Mexican 1% Puerto Rican 2% Cuban 1%
- Common ancestry
- Hispanic 15% Lithuanian 1% Romanian 0%
- Foreign-born
- 24% · Canada, Jamaica
- Languages at home
- 78% English-only · French/Haitian/Cajun 14% Spanish 6% Other Indo-European 1%
Political lean MEDSL · Broward
- 2024 margin
- D (+17.0) · D 58.0% · R 41.0%
- 2008→2024 swing
- -17.8pp toward R · 2008: 34.7pp · 2024: 17.0pp
- All cycles
- 2024: D+17.0 2020: D+29.8 2016: D+35.0 2012: D+34.9 2008: D+34.7
Not yet ingested
- Civics
- —
Market trends
- HPI YoY
- ▼ -300.68%
- Current HPI
- 535.2504
- Rent YoY
- ▲ 2.78%
- Metro
- Miami-Fort Lauderdale-Pompano Beach, FL
- State GDP YoY
- ▲ 3.28%
- F500 in state
- 36
Industry mix (Fortune 500 HQ in FL)
| Industry | F500 HQs | Revenue |
|---|---|---|
| Industrial Technology | 2 | $29B |
|
||
| Insurance | 2 | $17B |
|
||
| Retail | 1 | $60B |
|
||
| Technology Distribution | 1 | $58B |
|
||
| Homebuilding | 1 | $35B |
|
||
| Technology Manufacturing | 1 | $35B |
|
||
Price history
+1890.7% since first listed8 events — show timeline
- 2026-04-28 Pending — MARMLS
- 2026-04-16 Listed $214,999 MARMLS
- 2025-12-20 Listing Removed — MARMLS
- 2025-12-03 Listed $225,000 MARMLS
- 2010-08-06 Sold (Public Records) $85,000 Public Records
- 2009-05-15 Sold (MLS) $20,000 MARMLS
- 2009-02-20 Listed $32,200 MARMLS
- 1966-09-01 Sold (Public Records) $10,800 Public Records
Property tax history
+9.5%/yrLatest (2025): $6,583 · +14.6% YoY. Source: county tax records.
Cash-flow waterfall
monthlySold comps — $/sqft
last 12 mo · ≤1 miLoading sold comps…