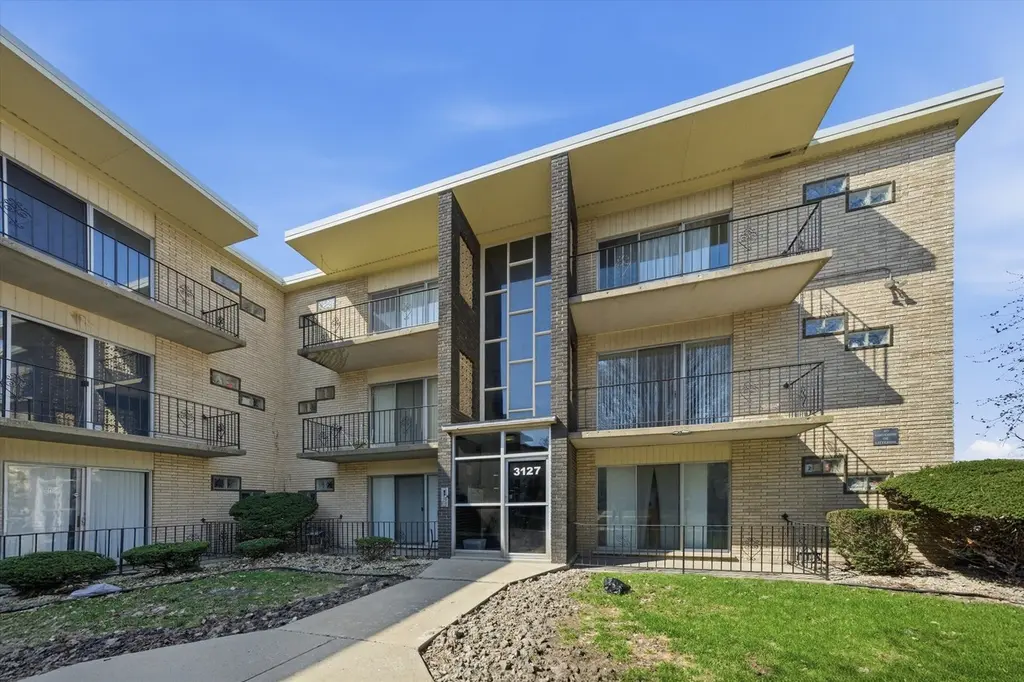
3127 Bernice Rd #5 · Lansing, IL
Flood risk 1/10 · Minimal
- FEMA flood zone
- X (unshaded)
- Chance of flooding over 30 yrs
- 0.0%
- Est. flood insurance / yr
- $507 – $1,088
Fire risk 1/10 · Minimal
- Est. fire insurance / yr
- $804 – $1,492
Heat risk 3/10 · Minor
- Hot days now (above 102°F)
- 7 days/yr
- Hot days in 30 yrs
- 15 days/yr
Wind risk 2/10 · Minimal
- Chance of severe wind over 30 yrs
- —
Air-quality risk 4/10 · Minor
- Unhealthy air days now
- 5 days/yr
- Unhealthy air days in 30 yrs
- 6 days/yr
Risk factors via First Street. Map © Google.
Why this score? — see what drove the C- grade
The composite is a weighted blend of 9 inputs, each scored 0–100. Each bar is that input's sub-score; the figure is the points it added to the 100-point composite (weight × sub-score).
- Cash flow +19.1/30.0
- 1% rule +9.6/10.0
- ARV discount +7.5/15.0
- DSCR +6.0/10.0
- Livability +3.7/5.0
- Rent growth +2.5/5.0
- Condition / age +2.5/5.0
- Schools +1.0/10.0
- Appreciation +0.0/10.0
$104,000
🖨 Deal sheet 📄 Offer letter ✓ Due diligence
Listing remarks MLS
INEXPENSIVE CONDO LOCATED CLOSE TO PUBLIC TRANSPORTATION, SHOPPING, HIGHWAYS, AND MORE. EXPRESSPATH FINANCING AVAILABLE. CALL L/A FOR DETAILS. PROOF OF FUNDS (IF CASH) OR LETTER FROM BANK/MTG. COMPANY REFLECTING MTG. COMMITMENT A MUST. ADDENDUMS REQUIRED-CAN BE ACCESSED VIA CONNECTMLS. EARNEST MONEY=CERTIFIED FUNDS.
Key facts
- $267 HOA
- Built 1968
- Listed 73 days
Property features AI
Finance
- Other: Property not currently leased; Rehab year listed as 2026; Local transit access: school bus service, commuter bus, commuter train, interstate access; Directions: South on Torrence to Bernice
- HOA & community: Monthly association fee of $267; Association covers exterior maintenance, lawn care, scavenger (trash), and snow removal; Manager off-site; Pets allowed (cats and dogs), maximum pet weight 50 lbs
Exterior
- Utilities: Water source: Lake Michigan; Public sewer; Electric: circuit breakers
- Home design: Condo (attached single); Entry level: 3rd floor; Building has 6 units; Brick construction; Estimated living area; Rehab completed in 2026 (recently rehabbed)
- Construction: Brick exterior; Built approximately 51–60 years ago; Built before 1978
- Exterior features: Balcony; Lot dimensions per survey
Interior
- Kitchen: Kitchen on main level (approx. 6 x 8)
- Bedrooms: Master bedroom on main level (approx. 12 x 12); Second bedroom on main level (approx. 10 x 12); Additional labeled bedrooms listed (bedroom 3, bedroom 4) — configuration shown as two bedrooms overall
- Bathrooms: One full bathroom
- Heating & cooling: Natural gas heating; Central air conditioning
- Interior features: Balcony/porch/lanai; Four total rooms
- Laundry & utility: Common area laundry
Neighborhood map
What this means for you Summary
Snapshot
- This is a 2-bed/1.0-bath condo listed at $104k.
Deal economics
- At list price, monthly cash flow is $110 ($1k/yr) — positive.
- The deal already cash-flows at list — no discount required.
- Meets the 1% rule at list price ($2k rent vs $104k).
- Recommended offer: $98k (6.0% below list) — sets the bar for market timing.
- Cap rate 7.6% vs local median 5.8% in Lansing — top-decile yield for the area; either an underpriced asset or a hidden risk that comps aren't pricing in. Stress-test before assuming the spread holds.
Location & tenants
- Location reads 73/100 on livability (#296 in IL) — a middle-class / working-renter tenant base. Strengths: commute A+, cost of living A+, housing A+; Watch: crime D+, health & safety D+, amenities F.
- Thornton Fractional Twp Hsd 215 (suburban): math 9% / reading 13% proficiency, ranked #563 of 620 in IL (top 91%) — low school quality limits family demand, transient renter base, plan for 1-2y turnover.
- Zoned schools: Thornton Fractnl So High School (math 11% / reading 14%, grade F, #504 of 693 statewide, top 73%, 1,927 students, 0% FRL).
- Market conditions: 132 active listings in the ZIP; 15 comparable units currently listed for rent nearby; rentals leasing fast (median 13d on market — plan ~1-2 weeks tenant-placement turnaround); solid renter incomes; 6,272 units permitted in Cook County in 2024 (4,658 in 5+ unit buildings).
Forward outlook
- Local home prices are declining (-3.0%/yr); year-one equity from $719 of loan paydown is wiped out by about $3k of value loss. Plan a longer hold.
Negotiation context
- It's been on market 73 days — a 6% lower offer ($98k) is reasonable based on typical stale-listing flexibility.
- 3 sale attempts since 19y ago with the ask held roughly flat each time — persistent listings suggest the price (not the market) is what's stuck; bring a comps-based counter.
- Current owner paid $35k; list at $104k implies a 199% gain — meaningful room to come down on a strong offer.
Risks & watch-outs
- Watch-outs: property tax is 2.7% of price.
Questions for the listing agent
- It's been on market 73 days. Have you received any prior offers? Is the seller open to a 6% concession, seller financing, or rate buy-down credit?
- Built in 1968 — when were the roof, HVAC, electrical panel, plumbing, and water heater last replaced?
- Property tax is high relative to price — has the assessment been appealed recently, and will the sale trigger a re-assessment?
- What does the HOA fee cover, when was the last increase, and are there any pending special assessments or reserve-fund shortfalls?
- Any open or pending special assessments — roof, HVAC, plumbing, elevator, façade? What's the per-unit balance and payoff schedule, and is the seller paying it off at close or rolling it to the buyer?
- Why hasn't it sold? Are there any deal-killer items the seller is aware of (foundation, flood, title, zoning, code violations)?
- Is there a deadline driving the sale (1031 exchange, divorce, estate, relocation)? That informs how much negotiation room exists.
- Schools are D-rated, which usually means shorter tenancies and higher turnover. Who's the typical renter profile here, and what's been the actual vacancy rate?
- Crime grade is D in this area — have there been break-ins, vandalism, or insurance claims at this property in the last 3 years? What carrier currently insures it and at what premium?
- What's the average days-on-market for RENTAL listings here right now (not sales)? A rising rental-DOM trend means longer vacancies and softer asking-rent achievability than the comps imply.
- What's the recent tenant-quality profile in this submarket — average credit score on applications, eviction rate, late-payment / NSF rate, and stable-employment percentage? A property-management company in the area should have these aggregated.
- How much new apartment / multifamily construction is in the pipeline within 1–3 miles? Heavy new supply (>2% of stock underway) typically softens rents 12–24 months out; light construction supports rent growth.
Investment metrics
- 1% rule
- 1.46% ✓
- Cap rate
- 7.56%
- Cash-on-cash
- 4.52%
- DSCR
- 1.20
- GRM
- 5.7
CMA / ARV
No comps found within radius.
Projected returns pro-forma
-3.0% appreciation · 3.0% rent growth · sell at horizon
- IRR
- -9.0%
- Equity multiple
- 0.67×
- Total profit
- $-9,613
- Equity at exit
- $15,507
- IRR
- 0.8%
- Equity multiple
- 1.06×
- Total profit
- $1,653
- Equity at exit
- $8,992
Cash invested: $29,120 (down + closing). Projections, not guarantees.
Landlord ↔ Tenant lean methodology
- Overall (STATE)
- 43 Moderately Tenant-Leaning
- State Illinois
- 43 Moderately Tenant-Leaning · D+7
- County
- — inherits STATE
- City
- — inherits STATE
ZIP-level market 60438
- Active inventory
- 132
- Price-to-rent
- 5.7×
Monthly cashflow live
- Estimated rent
- $1,523 high interval (Pro) →
- Mortgage (P&I)
- −$545
- Tax from tax record
- −$238 /mo · $2,852/yr
- Insurance
- −$43
- HOA
- −$267
- Vacancy / Maint / Mgmt
- −$320
- Net cashflow
- $110
Break-even live
UW: 25.0% down · 7.5% · 30yr · 1.5% tax · 5.0% vac · 8.0% maint · 8.0% mgmt
Financing live
Cash to close
- Down payment
- $26,000
- Closing costs
- $3,120
- Reserves months
- —
- Total cash needed
- —
Loan-product check · same deal, 3 products live
Conventional
25% down · 7.5% · 30yr
- Down + closing
- —
- Monthly P&I
- —
- Monthly cashflow
- —
- DSCR
- —
- Eligible?
- —
Personal DTI + credit; lowest rate.
DSCR
20% down · 8.5% · 30yr
- Down + closing
- —
- Monthly P&I
- —
- Monthly cashflow
- —
- DSCR
- —
- Eligible?
- —
No personal income docs; deal must DSCR.
Hard money
10% down · 12.0% · 12mo
- Down + closing
- —
- Monthly P&I
- —
- Monthly cashflow
- —
- DSCR
- —
- Eligible?
- —
Short-term bridge; refi at stabilization.
Rent comps 15 comps
| Address | Beds | Baths | Sqft | Rent | $/sqft | DOM | Units | Dist |
|---|---|---|---|---|---|---|---|---|
| 3069 Bernice Rd Apt 2N Lansing, IL | 3.0 | 1.0 | 950 | $1,535 | $1.62 | 21d | 1 | 0.07mi |
| 3069 Bernice Rd Apt 2S Lansing, IL | 3.0 | 1.0 | 950 | $1,535 | $1.62 | 3d | 1 | 0.07mi |
| 3023 Bernice Rd Apt 2S Lansing, IL | 3.0 | 1.0 | 1000 | $1,600 | $1.60 | 1d | 1 | 0.13mi |
| 3020 178th St Unit C1 Lansing, IL | 2.0 | 1.0 | 900 | $1,550 | $1.72 | 1d | 1 | 0.48mi |
| 3020 178th St Apt C7 Lansing, IL | 2.0 | 1.0 | 900 | $1,550 | $1.72 | 25d | 1 | 0.48mi |
| 17723 Exchange Ave Unit 17723-1N Lansing, IL | 3.0 | 2.0 | 1100 | $1,800 | $1.64 | 1d | 1 | 0.67mi |
| 3649 173rd Ct Lansing, IL | 2.0 | 2.0 | 972 | $1,357 | $1.40 | 25d | 1 | 0.74mi |
| 1539 Wentworth Ave Unit 3W Calumet City, IL | 3.0 | 1.0 | 1100 | $1,700 | $1.55 | 12d | 1 | 0.90mi |
| 2441 Indiana Ave Unit 2N Lansing, IL | 1.0 | 1.0 | 600 | $975 | $1.62 | 13d | 1 | 1.21mi |
| 2441 Indiana Ave Lansing, IL | 1.0 | 1.0 | 600 | $975 | $1.62 | 4d | 1 | 1.21mi |
| 1338 Wentworth Ave Unit 1338 Calumet City, IL | 2.0 | 1.0 | 800 | $1,430 | $1.79 | 25d | 1 | 1.29mi |
| 18335 Sherman St Unit 3 Lansing, IL | 3.0 | 1.0 | 1000 | $1,700 | $1.70 | 1d | 1 | 1.31mi |
| 17640 Rosewood Dr Unit 2A Lansing, IL | 2.0 | 1.0 | 950 | $1,475 | $1.55 | 18d | 1 | 1.42mi |
| 17754 Rosewood Dr Unit 1N Lansing, IL | 2.0 | 1.0 | 850 | $1,370 | $1.61 | 25d | 1 | 1.44mi |
| 18361 Glen Oak Ave Unit 1E Lansing, IL | 2.0 | 1.0 | 900 | $1,400 | $1.56 | 25d | 1 | 1.45mi |
HOA detail condo
- Monthly dues
- $267 · $3,204/yr
- Assessments
- None detected in remarks — confirm with the listing agent.
Listing history 19 events
-
2026-06-18days on market $104,000 Active 73 DOM
-
2026-06-17days on market $104,000 Active 72 DOM
-
2026-06-16days on market $104,000 Active 71 DOM
-
2026-06-15days on market $104,000 Active 70 DOM
-
2026-06-13days on market $104,000 Active 68 DOM
-
2026-06-09days on market $104,000 Active 64 DOM
-
2026-06-08days on market $104,000 Active 63 DOM
-
2026-06-07days on market $104,000 Active 62 DOM
-
2026-06-04days on market $104,000 Active 59 DOM
-
2026-06-03days on market $104,000 Active 58 DOM
-
2026-06-02days on market $104,000 Active 57 DOM
-
2026-06-01days on market $104,000 Active 56 DOM
-
2026-05-31days on market $104,000 Active 55 DOM
-
2026-05-21status Active
-
2026-04-15historical Contingent - Continue to Show
-
2026-04-06$104,000 Active
-
2008-04-18soldstatus $34,800 317-char remark
Show marketing remark (317 chars)
INEXPENSIVE CONDO LOCATED CLOSE TO PUBLIC TRANSPORTATION, SHOPPING, HIGHWAYS, AND MORE. EXPRESSPATH FINANCING AVAILABLE. CALL L/A FOR DETAILS. PROOF OF FUNDS (IF CASH) OR LETTER FROM BANK/MTG. COMPANY REFLECTING MTG. COMMITMENT A MUST. ADDENDUMS REQUIRED-CAN BE ACCESSED VIA CONNECTMLS. EARNEST MONEY=CERTIFIED FUNDS.
-
2008-04-11historical 317-char remark
Show marketing remark (317 chars)
INEXPENSIVE CONDO LOCATED CLOSE TO PUBLIC TRANSPORTATION, SHOPPING, HIGHWAYS, AND MORE. EXPRESSPATH FINANCING AVAILABLE. CALL L/A FOR DETAILS. PROOF OF FUNDS (IF CASH) OR LETTER FROM BANK/MTG. COMPANY REFLECTING MTG. COMMITMENT A MUST. ADDENDUMS REQUIRED-CAN BE ACCESSED VIA CONNECTMLS. EARNEST MONEY=CERTIFIED FUNDS.
-
2007-10-10$39,900 317-char remark
Show marketing remark (317 chars)
INEXPENSIVE CONDO LOCATED CLOSE TO PUBLIC TRANSPORTATION, SHOPPING, HIGHWAYS, AND MORE. EXPRESSPATH FINANCING AVAILABLE. CALL L/A FOR DETAILS. PROOF OF FUNDS (IF CASH) OR LETTER FROM BANK/MTG. COMPANY REFLECTING MTG. COMMITMENT A MUST. ADDENDUMS REQUIRED-CAN BE ACCESSED VIA CONNECTMLS. EARNEST MONEY=CERTIFIED FUNDS.
ⓘ Source: listings_history table (triggers on properties + properties_extension) + one-shot
backfill from property_details.listing_events for pre-trigger history.
Tax reassessment forecast IL · Partial reset (capped growth)
- Current annual tax
- $2,852 · $238/mo
- Projected year-2 tax
- $2,852 · $238/mo
- Expected delta
- $0/yr ($0/mo · 0.0%)
ⓘ Screening estimate from a state-policy table — verify with the county assessor before closing.
Climate risk First Street
- Flood 1/10 Low FEMA zone X (unshaded) · 0% chance over 30 yrs
- Wildfire 1/10 Low
- Heat 3/10 Moderate 7 d/yr ≥102°F today · 15 d/yr by 30 yrs out
- Wind 2/10 Low
- Air quality 4/10 Moderate 5 unhealthy d/yr today · 6 by 30 yrs out
Nearby sold comps map
Loading sold comps map…
Walkable amenities ~0.75 mi
Loading nearby amenities…
Taxation est. · year 1
- Rental income
- $18,274
- − Mortgage interest
- −$5,826
- − Property taxes
- −$2,852
- − Insurance
- −$520
- − Repairs & maintenance
- −$1,462
- − Management
- −$1,462
- − HOA
- −$3,204
- − Depreciation
- −$3,025
- Taxable loss
- −$77
- Est. tax savings @ 24.0%
- +$18
- After-tax cash flow
- $1,335/yr
For passive investors: Depreciation is non-cash, so a rental often shows a tax loss while cash-flowing — sheltering income. Rental losses are passive: they offset passive income freely, and up to $25,000/yr can offset ordinary (W-2) income if you actively participate and your MAGI is under $100k (phasing out to $0 by $150k); unused losses carry forward. On sale, claimed depreciation is recaptured at up to 25%, and gains may owe capital-gains tax (a 1031 exchange can defer both). Figures are a year-1 estimate at your 24.0% rate — not tax advice; consult a CPA.
Schools (NCES district)
- District
- Thornton Fractional Twp Hsd 215
- NCES district ID
- 1738940
- Math proficiency
- 9% ▼ -3.00%
- Reading proficiency
- 13% ▼ -3.00%
- Median HH income
- $48,207
- Composite
- 10.27/100
- National rank
- #9793
- State rank
- #563 of 620 in IL
Livability — Lansing
- Score
- 73/100
- State rank
- #296
- US rank
- #5698
Category grades
Schools grade is shown separately in the Schools card above.
Census & demographics
- Census place
- Lansing, IL
- County
- Cook County · 4,486,803 people
- City population
- 28,806
- Metro
- Chicago-Naperville-Elgin, IL-IN-WI
- Population (ZIP)
- 28,806
- Household income
- $75,681
- Rent vs Own
- Severe rent burden
- 830.0
Population outlook (Cook County) Hauer SSP2
- Today (2025)
- 5,347,519 people
- By 2030
- 5,357,703 · +0.2%
- By 2040
- 5,324,924 · -0.4%
- By 2050
- 5,230,762 · -2.2%
- By 2075
- 4,785,735 · -10.5%
- By 2100
- 4,188,836 · -21.7%
Race, ethnicity, and origin ACS 2023
- Neighborhood character
- Diverse neighborhood (Simpson 0.65)
- Race & ethnicity
- Black 51% White 25% Hispanic / Latino 18% Two or more races 7% Asian 2%
- Hispanic origin (detail)
- Mexican 15%
- Common ancestry
- Romanian 5% Iranian 3% Lithuanian 1%
- Foreign-born
- 10% · Canada
- Languages at home
- 83% English-only · Spanish 12% Vietnamese 1% French/Haitian/Cajun 1%
Political lean MEDSL · Cook
- 2024 margin
- Solid D (+42.0) · D 70.4% · R 28.4% · Other 1.2%
- 2008→2024 swing
- -11.4pp toward R · 2008: 53.4pp · 2024: 42.0pp
- All cycles
- 2024: D+42.0 2020: D+50.3 2016: D+53.0 2012: D+49.4 2008: D+53.4
Not yet ingested
- Civics
- —
Market trends
- HPI YoY
- ▼ -151.65%
- Current HPI
- 210.3398
- Rent YoY
- —
- Metro
- Chicago-Naperville-Elgin, IL-IN-WI
- State GDP YoY
- ▲ 1.59%
- F500 in state
- 60
Industry mix (Fortune 500 HQ in IL)
| Industry | F500 HQs | Revenue |
|---|---|---|
| Insurance | 4 | $201B |
|
||
| Consumer Goods | 4 | $87B |
|
||
| Industrial Machinery | 3 | $64B |
|
||
| Healthcare | 2 | $55B |
|
||
| Retail / Pharmacy | 1 | $148B |
|
||
| Agriculture / Food | 1 | $86B |
|
||
Price history
+160.7% since first listed6 events — show timeline
- 2026-05-21 Relisted — MRED as Distributed by MLS Grid
- 2026-04-15 Contingent — MRED as Distributed by MLS Grid
- 2026-04-06 Listed $104,000 MRED as Distributed by MLS Grid
- 2008-04-18 Sold (MLS) $34,800 MRED as Distributed by MLS Grid
- 2008-04-11 Listing Removed — MRED as Distributed by MLS Grid
- 2007-10-10 Listed $39,900 MRED as Distributed by MLS Grid
Property tax history
+3.0%/yrLatest (2023): $2,852 · +39.5% YoY. Source: county tax records.
Cash-flow waterfall
monthlySold comps — $/sqft
last 12 mo · ≤1 miLoading sold comps…