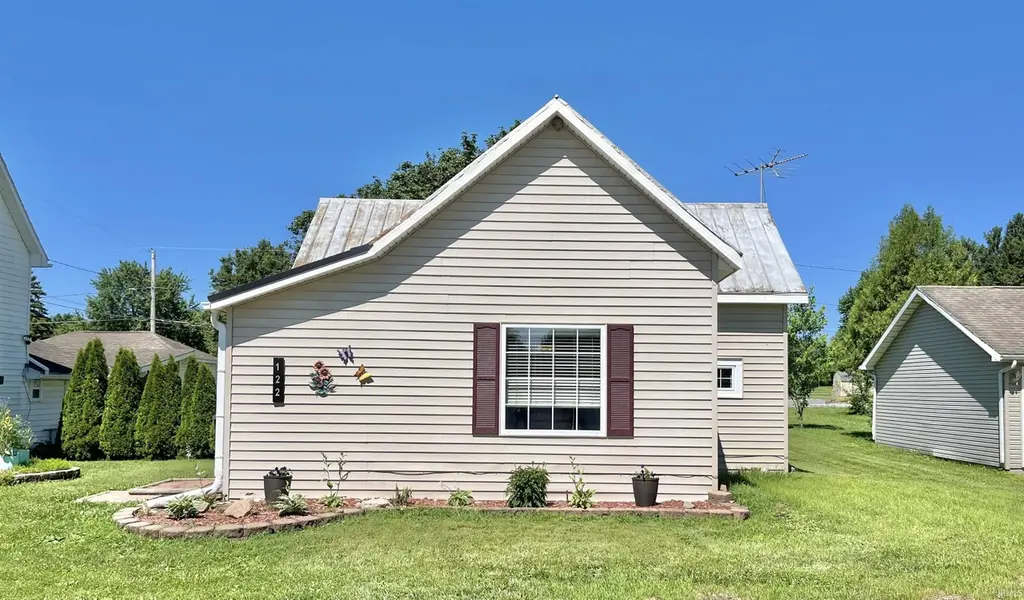
122 N Elm St · Losantville, IN
Flood risk 1/10 · Minimal
- FEMA flood zone
- X (unshaded)
- Chance of flooding over 30 yrs
- 0.0%
- Est. flood insurance / yr
- $473 – $860
Fire risk 1/10 · Minimal
- Est. fire insurance / yr
- $717 – $1,331
Heat risk 3/10 · Minor
- Hot days now (above 99°F)
- 7 days/yr
- Hot days in 30 yrs
- 18 days/yr
Wind risk 2/10 · Minimal
- Chance of severe wind over 30 yrs
- 1.0%
Air-quality risk 3/10 · Minor
- Unhealthy air days now
- 2 days/yr
- Unhealthy air days in 30 yrs
- 3 days/yr
Risk factors via First Street. Map © Google.
Why this score? — see what drove the C grade
The composite is a weighted blend of 9 inputs, each scored 0–100. Each bar is that input's sub-score; the figure is the points it added to the 100-point composite (weight × sub-score).
- Cash flow +27.7/30.0
- DSCR +9.8/10.0
- 1% rule +6.5/10.0
- Appreciation +5.0/10.0
- Livability +3.0/5.0
- Rent growth +2.5/5.0
- Condition / age +2.5/5.0
- Schools +1.7/10.0
- ARV discount +0.0/15.0
$75,000
🖨 Deal sheet (PDF) 📄 Offer letter ✓ Due diligence
Listing remarks
Check out this cozy 1 bedroom, 1 bath home nestled in a quiet neighborhood in Losantville! As you step inside, you’ll notice a lovely “cottage” type feel with tasteful updates throughout the entire home. Some of the major updates completed within the past two years include new PEX plumbing, new partial standing seam metal roof, new sump pump, and a new dehumidifier in the basement. Many cosmetic updates have also been completed such as new carpet throughout, new light fixtures, fresh paint, new flooring, beautiful butcher block countertops, a farmhouse sink, and new stainless steel appliances. Outside, you will also find a spacious storage shed perfect for storing your too
Key facts
- 4,792 sq ft lot
- Built 1890
- Listed 5 days
Property features AI
Exterior
- Parking: Gravel parking
- Utilities: Public water; Public sewer; Electric service
- Home design: Single-family residence (site-built); One story
- Construction: Vinyl siding; Metal roof
- Exterior features: Partially fenced yard with wood privacy fencing; Landscaped lot; Shed(s)
Interior
- Kitchen: Refrigerator; Electric range; Eat-in kitchen
- Bedrooms: Master bedroom on main level
- Flooring: Carpet; Laminate
- Bathrooms: 1 full bathroom (main level)
- Heating & cooling: Electric heating; Baseboard heating; Ceiling fans; Window air conditioning unit(s)
- Interior features: Walk-in closet(s); Ceiling fan(s); Eat-in kitchen; Master bedroom on main level; Basement (partial, unfinished) with sump pump; Fireplace in living room (1)
- Laundry & utility: Washer hookup on main level; Electric dryer hookup; Washer included; Dryer included; Electric water heater
Neighborhood map
What this means for you Summary
Snapshot
- This is a 1-bed/1.0-bath single-family listed at $75k.
Deal economics
- At list price, monthly cash flow is $227 ($3k/yr) — positive.
- The deal already cash-flows at list — no discount required.
- Meets the 1% rule at list price ($861 rent vs $75k).
Location & tenants
- Location reads 59/100 on livability (#570 in IN) — a working-class tenant base; expect higher turnover. Strengths: cost of living A+, housing A+; Watch: health & safety C-, crime D+, amenities F.
- Union School Corporation (rural): math 12% / reading 28% proficiency, ranked #276 of 301 in IN (top 92%) — low school quality limits family demand, transient renter base, plan for 1-2y turnover.
- Zoned schools: Union Elementary School (math 22% / reading 27%, grade F, #762 of 994 statewide, top 78%, 125 students, 64% FRL); Union Junior & High School (math 8% / reading 32%, grade F, #345 of 369 statewide, top 95%, 139 students, 63% FRL).
- Market conditions: 5 active listings in the ZIP; 19 units permitted in Randolph County in 2024 (0 in 5+ unit buildings).
Forward outlook
- In year one you build about $3k of equity ($519 loan paydown + $2k appreciation (3.0% local appreciation)).
- Randolph County population projected at -26% by 2050 — secular population decline; favor cash flow + early exit over multi-decade hold.
- At projected returns (3.0% appreciation + 3.0% rent growth), your $21k cash investment doubles in ~4 years — after that, you're playing with house money.
Negotiation context
- Only 6 days on market — expect competitive offers; lowballing is unlikely to land.
Risks & watch-outs
- Watch-outs: built in 1890 — expect roof / HVAC / electrical / plumbing capex.
Questions for the listing agent
- Built in 1890 — when were the roof, HVAC, electrical panel, plumbing, and water heater last replaced?
- Is there a deadline driving the sale (1031 exchange, divorce, estate, relocation)? That informs how much negotiation room exists.
- Schools are F-rated, which usually means shorter tenancies and higher turnover. Who's the typical renter profile here, and what's been the actual vacancy rate?
- Crime grade is D in this area — have there been break-ins, vandalism, or insurance claims at this property in the last 3 years? What carrier currently insures it and at what premium?
- What's the average days-on-market for RENTAL listings here right now (not sales)? A rising rental-DOM trend means longer vacancies and softer asking-rent achievability than the comps imply.
- What's the recent tenant-quality profile in this submarket — average credit score on applications, eviction rate, late-payment / NSF rate, and stable-employment percentage? A property-management company in the area should have these aggregated.
- How much new for-sale + rental construction is in the pipeline within 1–3 miles? Heavy new supply typically softens prices + rents 12–24 months out; constrained supply supports both.
Investment metrics
- 1% rule
- 1.15% ✓
- Cap rate
- 9.92%
- Cash-on-cash
- 12.95%
- DSCR
- 1.58
- GRM
- 7.3
CMA / ARV
- ARV (on-the-fly)
- $62,230
- Comps found
- 1
Show comp detail 1 sale within ~0.75 mi
| Address | Dist | Beds/Ba | Sqft | Sold | Price | $/sf | Match |
|---|---|---|---|---|---|---|---|
| 640 S Cherry St | 0.42mi | 1/1.0 | 924 (+4%) | 10mo | $65,000 | $70 | 66 |
Match score weights: distance 35% · size 25% · config 20% · recency 20%. Top-matched comps best support the ARV.
Projected returns pro-forma
3.0% appreciation · 3.0% rent growth · sell at horizon
- IRR
- 19.6%
- Equity multiple
- 2.12×
- Total profit
- $23,438
- Equity at exit
- $33,723
- IRR
- 20.8%
- Equity multiple
- 4.01×
- Total profit
- $63,190
- Equity at exit
- $51,972
Cash invested: $21,000 (down + closing). Projections, not guarantees.
Landlord ↔ Tenant lean methodology
- Overall (STATE)
- 90 Strongly Landlord-Friendly
- State Indiana
- 90 Strongly Landlord-Friendly · R+11
- County
- — inherits STATE
- City
- — inherits STATE
ZIP-level market 47354
- Active inventory
- 5
- Price-to-rent
- 7.3×
Monthly cashflow live
- Estimated rent
- $861 medium interval (Pro) →
- Mortgage (P&I)
- −$393
- Tax from tax record
- −$29 /mo · $353/yr
- Insurance
- −$31
- HOA
- −$0
- Vacancy / Maint / Mgmt
- −$181
- Net cashflow
- $227
Break-even live
Sensitivity live
| Price | -10% $269 | -5% $248 | +0% $227 | +5% $205 | +10% $184 |
|---|---|---|---|---|---|
| Rent | -10% $159 | -5% $193 | +0% $227 | +5% $261 | +10% $295 |
| Rate | -1.0pp $264 | -0.5pp $246 | base $227 | +0.5pp $207 | +1.0pp $187 |
UW: 25.0% down · 7.5% · 30yr · 1.5% tax · 5.0% vac · 8.0% maint · 8.0% mgmt
Financing live
Cash to close
- Down payment
- $18,750
- Closing costs
- $2,250
- Reserves months
- —
- Total cash needed
- —
Loan-product check · same deal, 3 products live
Conventional
25% down · 7.5% · 30yr
- Down + closing
- —
- Monthly P&I
- —
- Monthly cashflow
- —
- DSCR
- —
- Eligible?
- —
Personal DTI + credit; lowest rate.
DSCR
20% down · 8.5% · 30yr
- Down + closing
- —
- Monthly P&I
- —
- Monthly cashflow
- —
- DSCR
- —
- Eligible?
- —
No personal income docs; deal must DSCR.
Hard money
10% down · 12.0% · 12mo
- Down + closing
- —
- Monthly P&I
- —
- Monthly cashflow
- —
- DSCR
- —
- Eligible?
- —
Short-term bridge; refi at stabilization.
Listing history 7 events
-
2026-06-19days on market $75,000 Active 6 DOM
-
2026-06-18days on market $75,000 Active 5 DOM
-
2026-06-17days on market $75,000 Active 4 DOM
-
2026-06-16days on market $75,000 Active 3 DOM
-
2026-06-15days on market $75,000 Active 2 DOM
-
2026-06-14remarks 681-char remark
-
2026-06-14$75,000 Active 1 DOM
ⓘ Source: listings_history table (triggers on properties + properties_extension) + one-shot
backfill from property_details.listing_events for pre-trigger history.
Tax reassessment forecast IN · Partial reset (capped growth)
- Current annual tax
- $353 · $29/mo
- Projected year-2 tax
- $495 · $41/mo
- Expected delta
- +$142/yr (+$12/mo · 40.4%)
ⓘ Screening estimate from a state-policy table — verify with the county assessor before closing.
Climate risk First Street
- Flood 1/10 Low FEMA zone X (unshaded) · 0% chance over 30 yrs
- Wildfire 1/10 Low
- Heat 3/10 Moderate 7 d/yr ≥99°F today · 18 d/yr by 30 yrs out
- Wind 2/10 Low 100% chance of damaging wind over 30 yrs
- Air quality 3/10 Moderate 2 unhealthy d/yr today · 3 by 30 yrs out
Nearby sold comps map
Loading sold comps map…
Walkable amenities ~0.75 mi
Loading nearby amenities…
Taxation est. · year 1
- Rental income
- $10,337
- − Mortgage interest
- −$4,201
- − Property taxes
- −$353
- − Insurance
- −$375
- − Repairs & maintenance
- −$827
- − Management
- −$827
- − Depreciation
- −$2,182
- Taxable income
- $1,572
- Est. tax owed @ 24.0%
- −$377
- After-tax cash flow
- $2,341/yr
For passive investors: Depreciation is non-cash, so a rental often shows a tax loss while cash-flowing — sheltering income. Rental losses are passive: they offset passive income freely, and up to $25,000/yr can offset ordinary (W-2) income if you actively participate and your MAGI is under $100k (phasing out to $0 by $150k); unused losses carry forward. On sale, claimed depreciation is recaptured at up to 25%, and gains may owe capital-gains tax (a 1031 exchange can defer both). Figures are a year-1 estimate at your 24.0% rate — not tax advice; consult a CPA.
Schools (NCES district)
- District
- Union School Corporation
- NCES district ID
- 1811730
- Math proficiency
- 12% ▬ 0.00%
- Reading proficiency
- 28% ▲ 3.00%
- Median HH income
- $42,889
- Composite
- 17.17/100
- National rank
- #9108
- State rank
- #276 of 301 in IN
Livability — Losantville
- Score
- 59/100
- State rank
- #570
- US rank
- #20411
Category grades
Schools grade is shown separately in the Schools card above.
Census & demographics
- Census place
- Losantville, IN
- Population (ZIP)
- 1,122
Population outlook (Randolph County) Hauer SSP2
- Today (2025)
- 22,998 people
- By 2030
- 21,815 · -5.1%
- By 2040
- 19,360 · -15.8%
- By 2050
- 17,010 · -26.0%
- By 2075
- 12,491 · -45.7%
- By 2100
- 8,986 · -60.9%
Race, ethnicity, and origin ACS 2023
- Neighborhood character
- Predominantly White (96%)
- Race & ethnicity
- White 96% Two or more races 4% Hispanic / Latino 2%
- Common ancestry
- Slovak 10% Iranian 1% Hungarian 1%
- Languages at home
- 99% English-only · Korean 1%
Political lean MEDSL · Randolph
- 2024 margin
- Solid R (+53.7) · D 22.3% · R 75.9% · Other 1.8%
- 2008→2024 swing
- -44.9pp toward R · 2008: -8.8pp · 2024: -53.7pp
- All cycles
- 2024: R+53.7 2020: R+52.4 2016: R+48.5 2012: R+24.1 2008: R+8.8
Not yet ingested
- Civics
- —
Market trends
- HPI YoY
- —
- Current HPI
- —
- Rent YoY
- —
- Metro
- —
- State GDP YoY
- ▲ 2.90%
- F500 in state
- 18
Industry mix (Fortune 500 HQ in IN)
| Industry | F500 HQs | Revenue |
|---|---|---|
| Industrial Machinery | 2 | $37B |
|
||
| Healthcare | 1 | $177B |
|
||
| Pharmaceuticals | 1 | $45B |
|
||
| Metals / Steel | 1 | $18B |
|
||
| Agriculture | 1 | $17B |
|
||
| Packaging | 1 | $12B |
|
||
Price history
1 event — show timeline
- 2026-06-13 Listed $75,000 IRMLS
Property tax history
+7.2%/yrLatest (2024): $353 · +5.4% YoY. Source: county tax records.
Cash-flow waterfall
monthlySold comps — $/sqft
last 12 mo · ≤1 miLoading sold comps…