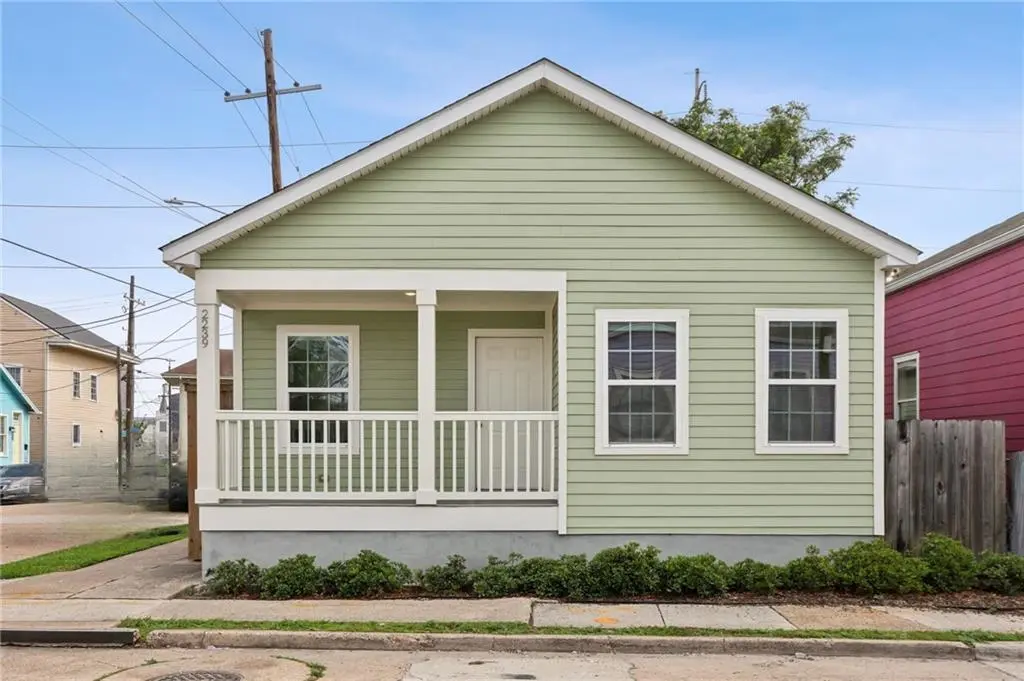
2239 Saint Andrew St · New Orleans, LA
Flood risk 8/10 · Major
- FEMA flood zone
- X
- Chance of flooding over 30 yrs
- 0.75%
- Est. flood insurance / yr
- $507 – $1,088
Fire risk 1/10 · Minimal
- Est. fire insurance / yr
- $1,269 – $2,357
Heat risk 10/10 · Severe
- Hot days now (above 108°F)
- 7 days/yr
- Hot days in 30 yrs
- 20 days/yr
Wind risk 10/10 · Severe
- Chance of severe wind over 30 yrs
- 99.0%
Air-quality risk 3/10 · Minor
- Unhealthy air days now
- 3 days/yr
- Unhealthy air days in 30 yrs
- 4 days/yr
Risk factors via First Street. Map © Google.
Why this score? — see what drove the D+ grade
The composite is a weighted blend of 9 inputs, each scored 0–100. Each bar is that input's sub-score; the figure is the points it added to the 100-point composite (weight × sub-score).
- ARV discount +13.2/15.0
- Appreciation +10.0/10.0
- Cash flow +8.7/30.0
- Rent growth +4.0/5.0
- Livability +4.0/5.0
- Condition / age +2.5/5.0
- DSCR +2.4/10.0
- 1% rule +2.1/10.0
- Schools +1.6/10.0
$269,000
🖨 Deal sheet 📄 Offer letter ✓ Due diligence
Listing remarks MLS
Move-in ready 3-bedroom, 2-bathroom single-family home on a corner lot in Central City. Inside, the layout flows well from a generous living room into a large dining area and into a well-appointed kitchen featuring gray shaker cabinets, marble countertops, and stainless steel appliances. No carpet throughout. The primary bedroom is a standout, offering two walk-in closets. One bedroom opens directly onto the front porch a covered, intimate space that feels like a natural extension of the home. Out back, a fully fenced yard with gated off-street parking for two vehicles rounds out this property nicely. Centrally located with quick access to the streetcar and the best of what New Orleans has to offer.
Key facts
- Covered front porch
- Two walk-in closets
- Fully fenced yard
Tags
Neighborhood map
What this means for you Summary
Snapshot
- This is a 2-bed/2.0-bath single-family listed at $269k.
Deal economics
- At list price, monthly cash flow is $-293 ($-4k/yr) — negative.
- To cash-flow at today's rent, offer at most $217k (19.2% below list).
- To meet the 1% rule (rent ≥ 1% of price), the offer needs to be $190k (29.3% below list).
- Recommended offer: $190k (29.3% below list) — sets the bar for 1% rule.
- Cap rate 5.3% vs local median 4.4% in New Orleans — meaningfully above typical; check what's discounted (condition, days-on-market, listing class) to confirm the premium yield is real.
Location & tenants
- Location reads 81/100 on livability (#3 in LA, #1,383 nationally) — a professional / high-income tenant draw. Strengths: amenities A+, commute A+, health & safety A+; Watch: crime C-, employment D.
- Orleans Parish (urban): math 11% / reading 27% proficiency, ranked #69 of 98 in LA (top 70%) — low school quality limits family demand, transient renter base, plan for 1-2y turnover; 68% free/reduced lunch — lower-income household profile, screen leases tightly.
- Market conditions: Rents rising fast (+6.0%/yr); 137 active listings in the ZIP; 40 comparable units currently listed for rent nearby; rentals at typical pace (median 24d on market — plan ~3-4 weeks tenant-placement turnaround); lower-income renter base — watch delinquency; 710 units permitted in Orleans Parish in 2024 (244 in 5+ unit buildings).
- At $1,901/mo this rent would consume 58% of the median local household income ($39k/yr) (locally 714% of renters already pay >50% of income on rent) — very limited rent-growth headroom before tenants either downsize or default.
Forward outlook
- In year one you build about $29k of equity ($2k loan paydown + $27k appreciation (10.0% local appreciation)).
- Orleans County population projected at +61% by 2050 — long-run rental-demand tailwind backs the buy-and-hold thesis.
- By year 2, paydown + projected appreciation supports a ~$46k cash-out refi (75% LTV) — recoverable capital for the next deal without selling this one.
Negotiation context
- It's been on market 76 days — a 6% lower offer ($253k) is reasonable based on typical stale-listing flexibility.
- 14 sale attempts since 22y ago; this cycle's ask is 13695% above the opening price — seller raised mid-cycle; expect resistance to lowballs.
- Current owner paid $100k; list at $269k implies a 170% gain — meaningful room to come down on a strong offer.
Risks & watch-outs
- Watch-outs: flood insurance adds $66/mo.
- Climate carrying-cost: severe flood risk; severe wind risk, 99% chance of damaging wind over 30y; extreme-heat days projected 7→20/yr by 2055 (HVAC capex compounding) — expect insurance premiums to compound above CPI over the hold.
Questions for the listing agent
- What do current leases actually rent for vs. the listed asking? Can we see a recent rent roll and the last 12 months of T-12 income?
- It's been on market 76 days. Have you received any prior offers? Is the seller open to a 29% concession, seller financing, or rate buy-down credit?
- What's the actual annual flood-insurance premium (NFIP or private), and is the property in a SFHA with mandatory coverage?
- Why hasn't it sold? Are there any deal-killer items the seller is aware of (foundation, flood, title, zoning, code violations)?
- Is there a deadline driving the sale (1031 exchange, divorce, estate, relocation)? That informs how much negotiation room exists.
- The area grade is low — what's the realistic commute time and amenity access for the typical tenant pool here? Any planned neighborhood developments (good or bad) we should know about?
- What's the average days-on-market for RENTAL listings here right now (not sales)? A rising rental-DOM trend means longer vacancies and softer asking-rent achievability than the comps imply.
- What's the recent tenant-quality profile in this submarket — average credit score on applications, eviction rate, late-payment / NSF rate, and stable-employment percentage? A property-management company in the area should have these aggregated.
- How much new for-sale + rental construction is in the pipeline within 1–3 miles? Heavy new supply typically softens prices + rents 12–24 months out; constrained supply supports both.
Investment metrics
- 1% rule
- 0.71% ✗
- Cap rate
- 5.28%
- Cash-on-cash
- -3.61%
- DSCR
- 0.84
- GRM
- 11.8
CMA / ARV
- ARV (median comp)
- $308,035
- List price
- $269,000
- Delta
- -12.67%
- Verdict
- UNDERPRICED
- Comps
- 20 within 1.0 mi
Show comp detail 12 sales within ~0.75 mi
| Address | Dist | Beds/Ba | Sqft | Sold | Price | $/sf | Match |
|---|---|---|---|---|---|---|---|
| 2014 Philip St | 0.31mi | 3/2.0 (+1) | 1,476 (+1%) | 3mo | $310,000 | $210 | 77 |
| 1301 S Saratoga St | 0.28mi | 3/2.0 (+1) | 1,510 (+3%) | 2mo | $250,000 | $166 | 75 |
| 1323 S Rampart St | 0.28mi | 3/2.0 (+1) | 1,477 (+1%) | 10mo | $275,000 | $186 | 73 |
| 2015 Martin Luther King Blvd | 0.22mi | 3/2.0 (+1) | 1,332 (-9%) | 3mo | $249,000 | $187 | 67 |
| 1819 Baronne St | 0.30mi | 3/2.0 (+1) | 1,375 (-6%) | 5mo | $315,000 | $229 | 67 |
| 2725 Philip St | 0.34mi | 3/2.0 (+1) | 1,404 (-4%) | 7mo | $199,000 | $142 | 66 |
| 2226 First St | 0.28mi | 2/2.0 | 1,600 (+9%) | 8mo | $285,000 | $178 | 65 |
| 2321 Seventh St | 0.63mi | 3/2.0 (+1) | 1,425 (-3%) | 2mo | $325,000 | $228 | 59 |
| 2305 Washington Ave | 0.48mi | 3/2.0 (+1) | 1,382 (-6%) | 9mo | $337,000 | $244 | 55 |
| 2410 Freret St | 0.30mi | 3/3.0 (+1) | 1,305 (-11%) | 11mo | $249,000 | $191 | 49 |
| 2917 Baronne St | 0.72mi | 3/2.5 (+1) | 1,497 (+2%) | 8mo | $370,000 | $247 | 49 |
| 3205 S Saratoga St | 0.72mi | 3/2.5 (+1) | 1,677 (+14%) | 2mo | $425,000 | $253 | 34 |
Match score weights: distance 35% · size 25% · config 20% · recency 20%. Top-matched comps best support the ARV.
Projected returns pro-forma
10.0% appreciation · 5.98% rent growth · sell at horizon
- IRR
- 21.8%
- Equity multiple
- 2.78×
- Total profit
- $133,709
- Equity at exit
- $242,337
- IRR
- 20.3%
- Equity multiple
- 6.60×
- Total profit
- $421,837
- Equity at exit
- $522,608
Cash invested: $75,320 (down + closing). Projections, not guarantees.
Landlord ↔ Tenant lean methodology
- Overall (STATE)
- 90 Strongly Landlord-Friendly
- State Louisiana
- 90 Strongly Landlord-Friendly · R+12
- County
- — inherits STATE
- City
- — inherits STATE
ZIP-level market 70113
- Rents YoY
- 6.0%
- Active inventory
- 137
- Price-to-rent
- 11.8×
Monthly cashflow live
- Estimated rent
- $1,901 high interval (Pro) →
- Mortgage (P&I)
- −$1,411
- Tax from tax record
- −$206 /mo · $2,471/yr
- Insurance
- −$112
- Flood insurance flood zone
- −$66 /mo · $798/yr
- HOA
- −$0
- Vacancy / Maint / Mgmt
- −$399
- Net cashflow
- $-293
Break-even live
UW: 25.0% down · 7.5% · 30yr · 1.5% tax · 5.0% vac · 8.0% maint · 8.0% mgmt
Financing live
Cash to close
- Down payment
- $67,250
- Closing costs
- $8,070
- Reserves months
- —
- Total cash needed
- —
Loan-product check · same deal, 3 products live
Conventional
25% down · 7.5% · 30yr
- Down + closing
- —
- Monthly P&I
- —
- Monthly cashflow
- —
- DSCR
- —
- Eligible?
- —
Personal DTI + credit; lowest rate.
DSCR
20% down · 8.5% · 30yr
- Down + closing
- —
- Monthly P&I
- —
- Monthly cashflow
- —
- DSCR
- —
- Eligible?
- —
No personal income docs; deal must DSCR.
Hard money
10% down · 12.0% · 12mo
- Down + closing
- —
- Monthly P&I
- —
- Monthly cashflow
- —
- DSCR
- —
- Eligible?
- —
Short-term bridge; refi at stabilization.
Rent comps 40 comps
| Address | Beds | Baths | Sqft | Rent | $/sqft | DOM | Units | Dist |
|---|---|---|---|---|---|---|---|---|
| 2123 S Liberty St Unit 2125 New Orleans, LA | 3.0 | 2.0 | 1500 | $2,100 | $1.40 | 3d | 1 | 0.09mi |
| 1614 Rev John Raphael Jr Way New Orleans, LA | 3.0 | 2.0 | 1000 | $1,500 | $1.50 | 23d | 1 | 0.10mi |
| 2119 Josephine St New Orleans, LA | 3.0 | 1.0 | 1017 | $950 | $0.93 | 21d | 1 | 0.12mi |
| 2032 Saint Andrew St New Orleans, LA | 3.0 | 2.0 | 1035 | $1,830 | $1.77 | 16d | 1 | 0.15mi |
| 2318 Martin Luther King Junior Blvd New Orleans, LA | 3.0 | 2.0 | 1400 | $1,700 | $1.21 | 23d | 1 | 0.16mi |
| 2231 S Liberty St New Orleans, LA | 3.0 | 3.5 | 1752 | $2,000 | $1.14 | 16d | 1 | 0.17mi |
| 1944 Jackson Ave New Orleans, LA | 3.0 | 2.5 | 1572 | $2,500 | $1.59 | 43d | 1 | 0.23mi |
| 2526 Martin Luther King Junior Blvd New Orleans, LA | 3.0 | 2.0 | 1200 | $2,200 | $1.83 | 3d | 1 | 0.23mi |
| 1848 Felicity St New Orleans, LA | 2.0 | 1.0 | 1000 | $1,300 | $1.30 | 16d | 1 | 0.26mi |
| 2225 2nd St New Orleans, LA | 3.0 | 2.0 | 1100 | $1,800 | $1.64 | 23d | 1 | 0.29mi |
| 2227 Second St New Orleans, LA | 2.0 | 2.0 | 1100 | $1,900 | $1.73 | 23d | 1 | 0.30mi |
| 1827 Baronne St Unit C New Orleans, LA | 2.0 | 1.0 | 876 | $1,450 | $1.66 | 23d | 1 | 0.30mi |
| 2403 S Saratoga St New Orleans, LA | 3.0 | 2.5 | 1600 | $2,500 | $1.56 | 23d | 1 | 0.30mi |
| 2722 Martin L King Bl New Orleans, LA | 3.0 | 2.5 | 1350 | $1,800 | $1.33 | 23d | 1 | 0.32mi |
| 1915 Philip St New Orleans, LA | 3.0 | 1.5 | 1300 | $2,450 | $1.88 | 23d | 1 | 0.32mi |
| 2818 Saint Andrew St New Orleans, LA | 2.0 | 1.0 | 900 | $1,550 | $1.72 | 23d | 1 | 0.33mi |
| 2702 Felicity St Unit 4 New Orleans, LA | 1.0 | 1.0 | 1734 | $825 | $0.48 | 3d | 1 | 0.33mi |
| 1407 Magnolia St New Orleans, LA | 3.0 | 2.0 | 1824 | $1,500 | $0.82 | 23d | 1 | 0.33mi |
| 2515 Erato St Unit 102 New Orleans, LA | 2.0 | 1.0 | 1000 | $2,100 | $2.10 | 21d | 1 | 0.33mi |
| 1809 Carondelet St New Orleans, LA | 2.0 | 2.0 | 1086 | $2,200 | $2.03 | 23d | 1 | 0.40mi |
| 1809 Carondelet St Unit 1809 New Orleans, LA | 2.0 | 2.0 | 1086 | $2,000 | $1.84 | 3d | 1 | 0.40mi |
| 1715 Jackson Ave Unit B New Orleans, LA | 2.0 | 2.0 | 1200 | $1,850 | $1.54 | 1d | 1 | 0.42mi |
| 2222 Fourth St New Orleans, LA | 2.0 | 1.5 | 937 | $1,550 | $1.65 | 23d | 1 | 0.43mi |
| 1643 Josephine St New Orleans, LA | 1.0–2.0 | 1.5–2.0 | 814 | $2,249 | $2.76 | 2d | 11 | 0.43mi |
| 2220 4th St New Orleans, LA | 1.0 | 1.0 | 937 | $1,650 | $1.76 | 23d | 1 | 0.44mi |
| 2107 Fourth St New Orleans, LA | 3.0 | 1.0 | 1292 | $1,775 | $1.37 | 16d | 1 | 0.44mi |
| 2717 Loyola Ave New Orleans, LA | 3.0 | 2.0 | 1250 | $2,300 | $1.84 | 1d | 1 | 0.46mi |
| 2717 Loyola Ave New Orleans, LA | 3.0 | 2.0 | 1232 | $2,300 | $1.87 | 23d | 1 | 0.46mi |
| 2233 Saint Charles Ave New Orleans, LA | 2.0 | 1.0–2.0 | 637 | $2,439 | $3.83 | 1d | 1 | 0.51mi |
| 1716 Saint Charles Ave Unit A New Orleans, LA | 1.0 | 1.0 | 1631 | $3,500 | $2.15 | 43d | 1 | 0.52mi |
| 2705 Dryades St New Orleans, LA | 2.0 | 1.0 | 1100 | $2,000 | $1.82 | 23d | 1 | 0.52mi |
| 1618 Philip St New Orleans, LA | 2.0 | 2.0 | 1200 | $1,950 | $1.62 | 23d | 1 | 0.52mi |
| 2100 Saint Charles Ave New Orleans, LA | 1.0–2.0 | 1.5–2.0 | 1077 | $3,500 | $3.25 | 3d | 2 | 0.53mi |
| 2100 Saint Charles Ave Unit 3M New Orleans, LA | 2.0 | 2.0 | 1425 | $3,500 | $2.46 | 43d | 1 | 0.53mi |
| 1635 2nd St New Orleans, LA | 2.0 | 1.0 | 1500 | $2,175 | $1.45 | 15d | 1 | 0.54mi |
| 2714 Dryades St Unit A New Orleans, LA | 2.0 | 2.0 | 919 | $1,500 | $1.63 | 3d | 1 | 0.55mi |
| 1524 Saint Mary St Unit A New Orleans, LA | 1.0 | 1.0 | 933 | $1,500 | $1.61 | 11d | 1 | 0.56mi |
| 1750 Saint Charles Ave #516 New Orleans, LA | 2.0 | 2.0 | 1507 | $2,600 | $1.73 | 15d | 1 | 0.56mi |
| 1520 Saint Mary St Unit E New Orleans, LA | 2.0 | 2.0 | 1381 | $2,800 | $2.03 | 43d | 1 | 0.56mi |
| 2713 Baronne St New Orleans, LA | 3.0 | 2.5 | 1600 | $2,300 | $1.44 | 23d | 1 | 0.57mi |
Listing history 40 events
-
2026-06-18days on market $269,000 Active 76 DOM
-
2026-06-17days on market $269,000 Active 75 DOM
-
2026-06-16days on market $269,000 Active 74 DOM
-
2026-06-15days on market $269,000 Active 73 DOM
-
2026-06-13days on market $269,000 Active 71 DOM
-
2026-06-10days on market $269,000 Active 68 DOM
-
2026-06-09days on market $269,000 Active 67 DOM
-
2026-06-08days on market $269,000 Active 66 DOM
-
2026-06-07days on market $269,000 Active 65 DOM
-
2026-06-05days on market $269,000 Active 62 DOM
-
2026-06-03days on market $269,000 Active 61 DOM
-
2026-06-02days on market $269,000 Active 60 DOM
-
2026-06-01days on market $269,000 Active 59 DOM
-
2026-05-31days on market $269,000 Active 58 DOM
-
2026-05-12$1,950
-
2026-05-12historical $1,995
-
2026-05-07price $1,995
-
2026-04-22price $269,000 708-char remark
Show marketing remark (708 chars)
Move-in ready 3-bedroom, 2-bathroom single-family home on a corner lot in Central City. Inside, the layout flows well from a generous living room into a large dining area and into a well-appointed kitchen featuring gray shaker cabinets, marble countertops, and stainless steel appliances. No carpet throughout. The primary bedroom is a standout, offering two walk-in closets. One bedroom opens directly onto the front porch a covered, intimate space that feels like a natural extension of the home. Out back, a fully fenced yard with gated off-street parking for two vehicles rounds out this property nicely. Centrally located with quick access to the streetcar and the best of what New Orleans has to offer.
-
2026-04-03$279,000 Active 708-char remark
Show marketing remark (708 chars)
Move-in ready 3-bedroom, 2-bathroom single-family home on a corner lot in Central City. Inside, the layout flows well from a generous living room into a large dining area and into a well-appointed kitchen featuring gray shaker cabinets, marble countertops, and stainless steel appliances. No carpet throughout. The primary bedroom is a standout, offering two walk-in closets. One bedroom opens directly onto the front porch a covered, intimate space that feels like a natural extension of the home. Out back, a fully fenced yard with gated off-street parking for two vehicles rounds out this property nicely. Centrally located with quick access to the streetcar and the best of what New Orleans has to offer.
-
2026-03-19price $2,095
-
2026-02-13historical $1,800
-
2026-02-13$1,800
-
2026-02-06$1,800
-
2020-10-01price $239,000
-
2020-09-16$239,000
-
2018-12-10historical
-
2018-10-19$229,000
-
2018-10-19$229,000 Active
-
2010-04-14soldstatus $99,705
-
2010-04-12soldstatus $20,000
-
2010-02-01$24,900
-
2010-02-01$24,900
-
2009-07-14$39,900
-
2009-07-14$39,900
-
2005-01-13soldstatus $58,900
-
2004-08-27$58,900
-
2004-08-27$58,900
-
2000-04-20soldstatus $57,571
ⓘ Source: listings_history table (triggers on properties + properties_extension) + one-shot
backfill from property_details.listing_events for pre-trigger history.
Tax reassessment forecast LA · Resets to sale price
- Current annual tax
- $2,471 · $206/mo
- Projected year-2 tax
- $2,471 · $206/mo
- Expected delta
- $0/yr ($0/mo · 0.0%)
ⓘ Screening estimate from a state-policy table — verify with the county assessor before closing.
Climate risk First Street
- Flood 8/10 Severe FEMA zone X · 75% chance over 30 yrs
- Wildfire 1/10 Low
- Heat 10/10 Extreme 7 d/yr ≥108°F today · 20 d/yr by 30 yrs out
- Wind 10/10 Extreme 99% chance of damaging wind over 30 yrs
- Air quality 3/10 Moderate 3 unhealthy d/yr today · 4 by 30 yrs out
Nearby sold comps map
Loading sold comps map…
Walkable amenities ~0.75 mi
Loading nearby amenities…
Taxation est. · year 1
- Rental income
- $22,818
- − Mortgage interest
- −$15,068
- − Property taxes
- −$2,471
- − Insurance
- −$2,142
- − Repairs & maintenance
- −$1,825
- − Management
- −$1,825
- − Depreciation
- −$7,825
- Taxable loss
- −$8,340
- Est. tax savings @ 24.0%
- +$2,002
- After-tax cash flow
- $-1,514/yr
For passive investors: Depreciation is non-cash, so a rental often shows a tax loss while cash-flowing — sheltering income. Rental losses are passive: they offset passive income freely, and up to $25,000/yr can offset ordinary (W-2) income if you actively participate and your MAGI is under $100k (phasing out to $0 by $150k); unused losses carry forward. On sale, claimed depreciation is recaptured at up to 25%, and gains may owe capital-gains tax (a 1031 exchange can defer both). Figures are a year-1 estimate at your 24.0% rate — not tax advice; consult a CPA.
Schools (NCES district)
- District
- Orleans Parish
- NCES district ID
- 2201170
- Math proficiency
- 11% ▼ -52.00%
- Reading proficiency
- 27% ▼ -46.00%
- Median HH income
- $37,011
- Composite
- 15.78/100
- National rank
- #9271
- State rank
- #69 of 98 in LA
Livability — New Orleans
- Score
- 81/100
- State rank
- #3
- US rank
- #1383
Category grades
Schools grade is shown separately in the Schools card above.
Census & demographics
- Census place
- New Orleans, LA
- County
- Orleans Parish · 338,817 people
- City population
- 338,817
- Metro
- New Orleans-Metairie, LA
- Population (ZIP)
- 9,387
- Household income
- $39,333
- Rent vs Own
- Severe rent burden
- 714.0
Population outlook (Orleans County) Hauer SSP2
- Today (2025)
- 513,025 people
- By 2030
- 575,781 · +12.2%
- By 2040
- 700,174 · +36.5%
- By 2050
- 826,541 · +61.1%
- By 2075
- 1,123,374 · +119.0%
- By 2100
- 1,355,609 · +164.2%
Race, ethnicity, and origin ACS 2023
- Neighborhood character
- Diverse neighborhood (Simpson 0.57)
- Race & ethnicity
- Black 61% White 20% Hispanic / Latino 13% Two or more races 11% Asian 2%
- Hispanic origin (detail)
- Mexican 2%
- Common ancestry
- Lithuanian 2% Portuguese 1% Slovak 1%
- Foreign-born
- 13% · Canada, Vietnam, China
- Languages at home
- 86% English-only · Spanish 11% Other Indo-European 1% Vietnamese 1%
Political lean MEDSL · Orleans
- 2024 margin
- Solid D (+67.0) · D 82.2% · R 15.2% · Other 2.7%
- 2008→2024 swing
- +6.7pp toward D · 2008: 60.3pp · 2024: 67.0pp
- All cycles
- 2024: D+67.0 2020: D+68.2 2016: D+66.2 2012: D+62.5 2008: D+60.3
Not yet ingested
- Civics
- —
Market trends
- HPI YoY
- ▲ 65.92%
- Current HPI
- 229.3968
- Rent YoY
- ▲ 5.98%
- Metro
- New Orleans-Metairie, LA
- State GDP YoY
- ▲ 3.29%
- F500 in state
- 10
Industry mix (Fortune 500 HQ in LA)
| Industry | F500 HQs | Revenue |
|---|---|---|
| Telecommunications | 2 | $23B |
|
||
| Utilities | 1 | $12B |
|
||
| Wholesale / Distribution | 1 | $5B |
|
||
| Advertising | 1 | $2B |
|
||
Price history
-96.6% since first listed26 events — show timeline
- 2026-05-12 Listed for Rent $1,950 RAAMLS
- 2026-05-12 Rental Removed $1,995 TENANTTURNER2
- 2026-05-07 Price Changed $1,995 TENANTTURNER2
- 2026-04-22 Price Changed $269,000 AcadianaMLS
- 2026-04-22 Price Changed $269,000 GSREIN
- 2026-04-03 Listed $279,000 GSREIN
- 2026-04-03 Listed $279,000 AcadianaMLS
- 2026-03-19 Price Changed $2,095 TENANTTURNER2
- 2026-02-13 Rental Removed $1,800 APPFOLIO
- 2026-02-13 Listed for Rent $1,800 TENANTTURNER2
- 2026-02-06 Listed for Rent $1,800 APPFOLIO
- 2020-10-01 Price Changed $239,000 GSREIN
- 2020-09-16 Listed $239,000 AcadianaMLS
- 2018-12-10 Listing Removed — GSREIN
- 2018-10-19 Listed $229,000 GSREIN
- 2018-10-19 Listed $229,000 AcadianaMLS
- 2010-04-14 Sold (Public Records) $99,705 Public Records
- 2010-04-12 Sold (MLS) $20,000 GSREIN
- 2010-02-01 Listed $24,900 GSREIN
- 2010-02-01 Listed $24,900 AcadianaMLS
- 2009-07-14 Listed $39,900 GSREIN
- 2009-07-14 Listed $39,900 AcadianaMLS
- 2005-01-13 Sold (MLS) $58,900 GSREIN
- 2004-08-27 Listed $58,900 AcadianaMLS
- 2004-08-27 Listed $58,900 GSREIN
- 2000-04-20 Sold (Public Records) $57,571 Public Records
Property tax history
+21.1%/yrLatest (2026): $2,471 · +1.1% YoY. Source: county tax records.
Cash-flow waterfall
monthlySold comps — $/sqft
last 12 mo · ≤1 miLoading sold comps…