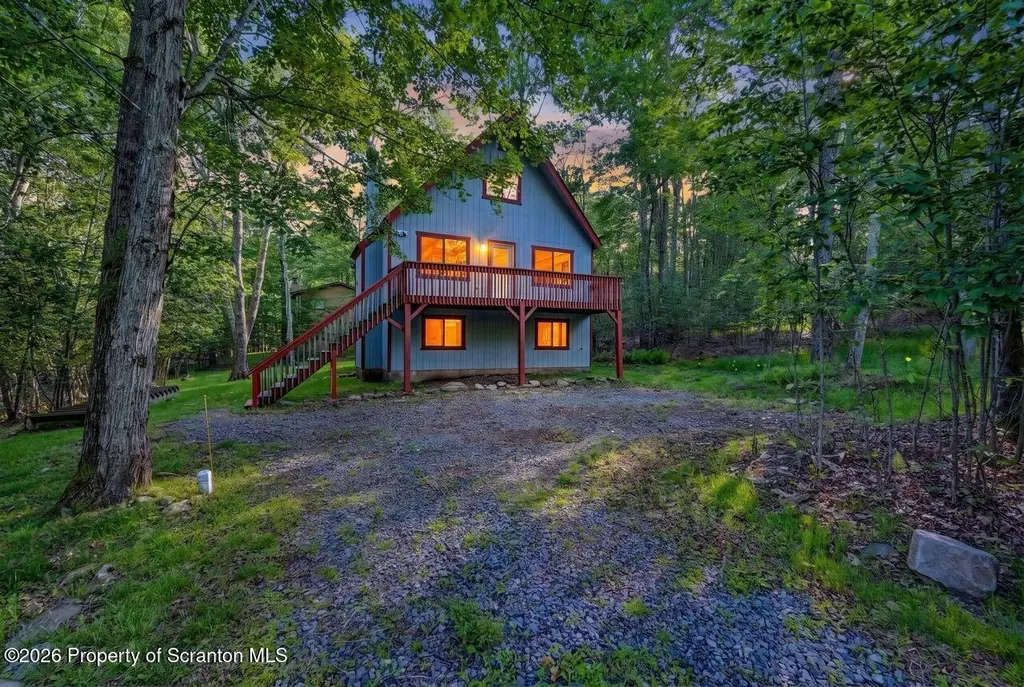
34 Fir Ln · Thornhurst, PA
Flood risk 1/10 · Minimal
- FEMA flood zone
- X (unshaded)
- Chance of flooding over 30 yrs
- 0.0%
- Est. flood insurance / yr
- $473 – $860
Fire risk 2/10 · Minimal
- Est. fire insurance / yr
- $511 – $949
Heat risk 2/10 · Minimal
- Hot days now (above 89°F)
- 7 days/yr
- Hot days in 30 yrs
- 17 days/yr
Wind risk 3/10 · Minor
- Chance of severe wind over 30 yrs
- 5.0%
Air-quality risk 2/10 · Minimal
- Unhealthy air days now
- 1 days/yr
- Unhealthy air days in 30 yrs
- 2 days/yr
Risk factors via First Street. Map © Google.
Why this score? — see what drove the B grade
The composite is a weighted blend of 9 inputs, each scored 0–100. Each bar is that input's sub-score; the figure is the points it added to the 100-point composite (weight × sub-score).
- Cash flow +23.6/30.0
- ARV discount +13.3/15.0
- Appreciation +9.2/10.0
- DSCR +7.6/10.0
- 1% rule +7.0/10.0
- Schools +5.0/10.0
- Rent growth +2.5/5.0
- Livability +2.5/5.0
- Condition / age +2.5/5.0
$179,000
🖨 Deal sheet 📄 Offer letter ✓ Due diligence
Listing remarks
Your new home or mountain retreat awaits you in Thornhurst! This chalet features an expansive floor plan with a rough-plumbed area awaiting a second bathroom! Hardwood floors, granite counters tops are already in place as well as a nicely appointed fire place in the living room and a wood stove in the basement recreation room for those cool Pocono nights. Enjoy summers in the Poconos with the large front deck and room in the backyard awaiting a new vision and purpose. Thornhurst Country Club Estates features a 9-Hole Golf Course, community swimming pool, playground, tennis, basketball courts, community clubhouse and more! Nearby is hundred of acres of PA State Game Lands as well as the Lack
Key facts
- Rough plumbed area
- Wood stove
- Fire place
Tags
Property features AI
Finance
- Other: Subdivision: Thornhurst Country Club Estates
- HOA & community: Homeowners association with an annual fee of $1,400
Exterior
- Parking: Driveway
- Utilities: Private water; Private sewer; Electricity connected (200+ amp service); Cable available
- Home design: Single-family residence; Residential property; Built in 1989
- Construction: T1-11 siding; Shingle roof; Combination foundation; Slab foundation
- Exterior features: Fire pit; Rectangular lot; Private road frontage; Gravel road surface
Interior
- Kitchen: Dishwasher; Refrigerator; Free-standing electric range; Eat-in kitchen
- Bedrooms: 3 bedrooms
- Flooring: Carpet; Hardwood
- Bathrooms: 1 full bathroom
- Heating & cooling: Baseboard heating; Wood stove; Electric heating; No central cooling
- Interior features: Beamed ceilings; Storage; Drywall; Eat-in kitchen; Fireplace (1)
- Laundry & utility: Dedicated laundry room
Neighborhood map
What this means for you Summary
Snapshot
- This is a 3-bed/1.0-bath single-family listed at $179k.
Deal economics
- At list price, monthly cash flow is $338 ($4k/yr) — positive.
- The deal already cash-flows at list — no discount required.
- Meets the 1% rule at list price ($2k rent vs $179k).
Location & tenants
- Location reads: area grade B — affects rentability + tenant quality, not the cash-flow math above.
- North Pocono SD (rural): math 45% / reading 71% proficiency, ranked #82 of 539 in PA (top 15%) — acceptable for families but not a draw, mixed tenant base, ~2y average lease.
- Market conditions: 299 active listings in the ZIP; 2 comparable units currently listed for rent nearby; 251 units permitted in Lackawanna County in 2024 (0 in 5+ unit buildings).
Forward outlook
- In year one you build about $16k of equity ($1k loan paydown + $15k appreciation (8.4% local appreciation)).
- Lackawanna County population projected to shrink 4% by 2050 — rents likely to lag national; underwrite the cash flow, not the appreciation.
- At projected returns (8.4% appreciation + 3.0% rent growth), your $50k cash investment doubles in ~3 years — after that, you're playing with house money.
- By year 3, paydown + projected appreciation supports a ~$41k cash-out refi (75% LTV) — recoverable capital for the next deal without selling this one.
Negotiation context
- Only 3 days on market — expect competitive offers; lowballing is unlikely to land.
- 7 sale attempts since 26y ago with the ask held roughly flat each time — persistent listings suggest the price (not the market) is what's stuck; bring a comps-based counter.
- Current owner paid $42k; list at $179k implies a 326% gain — meaningful room to come down on a strong offer.
Questions for the listing agent
- What does the HOA fee cover, when was the last increase, and are there any pending special assessments or reserve-fund shortfalls?
- Is there a deadline driving the sale (1031 exchange, divorce, estate, relocation)? That informs how much negotiation room exists.
- What's the average days-on-market for RENTAL listings here right now (not sales)? A rising rental-DOM trend means longer vacancies and softer asking-rent achievability than the comps imply.
- What's the recent tenant-quality profile in this submarket — average credit score on applications, eviction rate, late-payment / NSF rate, and stable-employment percentage? A property-management company in the area should have these aggregated.
- How much new for-sale + rental construction is in the pipeline within 1–3 miles? Heavy new supply typically softens prices + rents 12–24 months out; constrained supply supports both.
Investment metrics
- 1% rule
- 1.20% ✓
- Cap rate
- 8.56%
- Cash-on-cash
- 8.10%
- DSCR
- 1.36
- GRM
- 7.0
CMA / ARV
- ARV (on-the-fly)
- $205,513
- Comps found
- 10
Show comp detail 10 sales within ~0.75 mi
| Address | Dist | Beds/Ba | Sqft | Sold | Price | $/sf | Match |
|---|---|---|---|---|---|---|---|
| 15 Hawthorn Dr | 0.17mi | 3/2.0 | 1,380 (+5%) | 8mo | $195,000 | $141 | 72 |
| 22 Primrose Ln | 0.17mi | 4/1.5 (+1) | 1,240 (-5%) | 6mo | $195,000 | $157 | 71 |
| 34 Cedar Ln | 0.12mi | 2/1.5 (-1) | 1,193 (-9%) | 2mo | $105,000 | $88 | 71 |
| 91 Magnolia Dr | 0.27mi | 3/2.0 | 1,350 (+3%) | 17mo | $193,000 | $143 | 64 |
| 125 Elderberry Dr | 0.46mi | 3/2.0 | 1,350 (+3%) | 21mo | $184,000 | $136 | 52 |
| 172 Magnolia Dr | 0.32mi | 3/2.0 | 1,424 (+9%) | 20mo | $224,000 | $157 | 50 |
| 1249 Country Club Dr | 0.67mi | 3/2.0 | 1,400 (+7%) | 10mo | $255,000 | $182 | 45 |
| 314 Evergreen L 314 Dr | 0.21mi | 2/1.5 (-1) | 1,112 (-15%) | 20mo | $118,000 | $106 | 42 |
| 146 Country Club Dr | 0.74mi | 3/2.0 | 1,400 (+7%) | 10mo | $255,000 | $182 | 41 |
| 7 Fairway Ln | 0.69mi | 3/1.5 | 1,470 (+12%) | 11mo | $235,000 | $160 | 36 |
Match score weights: distance 35% · size 25% · config 20% · recency 20%. Top-matched comps best support the ARV.
Projected returns pro-forma
8.45% appreciation · 3.0% rent growth · sell at horizon
- IRR
- 27.2%
- Equity multiple
- 3.01×
- Total profit
- $100,644
- Equity at exit
- $141,570
- IRR
- 24.2%
- Equity multiple
- 6.52×
- Total profit
- $276,559
- Equity at exit
- $286,511
Cash invested: $50,120 (down + closing). Projections, not guarantees.
Landlord ↔ Tenant lean methodology
- Overall (STATE)
- 62 Landlord-Friendly
- State Pennsylvania
- 62 Landlord-Friendly · EVEN
- County
- — inherits STATE
- City
- — inherits STATE
ZIP-level market 18424
- Home prices YoY
- 2.2%
- Active inventory
- 299
- Price-to-rent
- 7.0×
Monthly cashflow live
- Estimated rent
- $2,142 medium interval (Pro) →
- Mortgage (P&I)
- −$939
- Tax est. 1.5%
- −$224 /mo · $2,685/yr
- Insurance
- −$75
- HOA
- −$117
- Vacancy / Maint / Mgmt
- −$450
- Net cashflow
- $338
Break-even live
UW: 25.0% down · 7.5% · 30yr · 1.5% tax · 5.0% vac · 8.0% maint · 8.0% mgmt
Financing live
Cash to close
- Down payment
- $44,750
- Closing costs
- $5,370
- Reserves months
- —
- Total cash needed
- —
Loan-product check · same deal, 3 products live
Conventional
25% down · 7.5% · 30yr
- Down + closing
- —
- Monthly P&I
- —
- Monthly cashflow
- —
- DSCR
- —
- Eligible?
- —
Personal DTI + credit; lowest rate.
DSCR
20% down · 8.5% · 30yr
- Down + closing
- —
- Monthly P&I
- —
- Monthly cashflow
- —
- DSCR
- —
- Eligible?
- —
No personal income docs; deal must DSCR.
Hard money
10% down · 12.0% · 12mo
- Down + closing
- —
- Monthly P&I
- —
- Monthly cashflow
- —
- DSCR
- —
- Eligible?
- —
Short-term bridge; refi at stabilization.
Rent comps 2 comps
| Address | Beds | Baths | Sqft | Rent | $/sqft | DOM | Units | Dist |
|---|---|---|---|---|---|---|---|---|
| 125 Magnolia Dr Gouldsboro, PA | 3.0 | 2.0 | 1583 | $2,000 | $1.26 | 13d | 1 | 0.34mi |
| 17 Joseph Ln Thornhurst Township, PA | 4.0 | 2.0 | 1200 | $2,295 | $1.91 | 13d | 1 | 0.40mi |
HOA detail
- Monthly dues
- $117 · $1,404/yr
- Likely covers
- pool
Listing history 4 events
-
2026-06-18days on market $179,000 Active 3 DOM
-
2026-06-17days on market $179,000 Active 2 DOM
-
2026-06-15remarks 699-char remark
-
2026-06-15$179,000 Active 1 DOM
ⓘ Source: listings_history table (triggers on properties + properties_extension) + one-shot
backfill from property_details.listing_events for pre-trigger history.
Climate risk First Street
- Flood 1/10 Low FEMA zone X (unshaded) · 0% chance over 30 yrs
- Wildfire 2/10 Low
- Heat 2/10 Low 7 d/yr ≥89°F today · 17 d/yr by 30 yrs out
- Wind 3/10 Moderate 5% chance of damaging wind over 30 yrs
- Air quality 2/10 Low 1 unhealthy d/yr today · 2 by 30 yrs out
Nearby sold comps map
Loading sold comps map…
Walkable amenities ~0.75 mi
Loading nearby amenities…
Taxation est. · year 1
- Rental income
- $25,709
- − Mortgage interest
- −$10,027
- − Property taxes
- −$2,685
- − Insurance
- −$895
- − Repairs & maintenance
- −$2,057
- − Management
- −$2,057
- − HOA
- −$1,404
- − Depreciation
- −$5,207
- Taxable income
- $1,377
- Est. tax owed @ 24.0%
- −$331
- After-tax cash flow
- $3,731/yr
For passive investors: Depreciation is non-cash, so a rental often shows a tax loss while cash-flowing — sheltering income. Rental losses are passive: they offset passive income freely, and up to $25,000/yr can offset ordinary (W-2) income if you actively participate and your MAGI is under $100k (phasing out to $0 by $150k); unused losses carry forward. On sale, claimed depreciation is recaptured at up to 25%, and gains may owe capital-gains tax (a 1031 exchange can defer both). Figures are a year-1 estimate at your 24.0% rate — not tax advice; consult a CPA.
Schools (NCES district)
- District
- North Pocono SD
- NCES district ID
- 4217310
- Math proficiency
- 45% ▼ -9.00%
- Reading proficiency
- 71% ▼ -2.00%
- Median HH income
- $59,555
- Composite
- 50.23/100
- National rank
- #1894
- State rank
- #82 of 539 in PA
Livability — Thornhurst
No livability data for this city. (Only ~50 U.S. cities are tracked.)
Census & demographics
- Population (ZIP)
- 5,076
Population outlook (Lackawanna County) Hauer SSP2
- Today (2025)
- 210,652 people
- By 2030
- 208,623 · -1.0%
- By 2040
- 203,980 · -3.2%
- By 2050
- 201,069 · -4.5%
- By 2075
- 205,026 · -2.7%
- By 2100
- 210,851 · +0.1%
Race, ethnicity, and origin ACS 2023
- Neighborhood character
- Predominantly White (89%)
- Race & ethnicity
- White 89% Two or more races 6% Hispanic / Latino 5% Black 1%
- Hispanic origin (detail)
- Puerto Rican 2% Dominican 1% Salvadoran 1%
- Common ancestry
- Romanian 11% Iranian 6% Scotch-Irish 3%
- Foreign-born
- 3% · Canada, Dominican Republic
- Languages at home
- 97% English-only · Spanish 2% Other Indo-European 1%
Political lean MEDSL · Lackawanna
- 2024 margin
- Toss-up / Even · D 51.0% · R 48.3%
- 2008→2024 swing
- -23.2pp toward R · 2008: 26.0pp · 2024: 2.8pp
- All cycles
- 2024: D+2.8 2020: D+8.4 2016: D+3.4 2012: D+27.4 2008: D+26.0
Not yet ingested
- Civics
- —
Market trends
- HPI YoY
- ▲ 8.45%
- Current HPI
- 399.903
- Rent YoY
- —
- Metro
- —
- State GDP YoY
- ▲ 1.68%
- F500 in state
- 34
Industry mix (Fortune 500 HQ in PA)
| Industry | F500 HQs | Revenue |
|---|---|---|
| Healthcare | 2 | $309B |
|
||
| Insurance | 2 | $27B |
|
||
| Telecommunications / Media | 1 | $124B |
|
||
| Industrial Distribution | 1 | $22B |
|
||
| Financial Services | 1 | $20B |
|
||
| Chemicals / Materials | 1 | $18B |
|
||
Price history
+198.8% since first listed14 events — show timeline
- 2026-06-15 Listed $179,000 GSBR as distributed by MLS GRID
- 2018-06-04 Sold (MLS) $42,000 GSBR as distributed by MLS GRID
- 2016-06-07 Sold (Public Records) $83,000 Public Records
- 2013-09-06 Sold (MLS) $25,000 PMAR
- 2013-03-13 Listed $29,900 PMAR
- 2008-07-09 Listed $134,900 GSBR as distributed by MLS GRID
- 2007-07-02 Listed $134,900 PMAR
- 2005-08-08 Sold (Public Records) $118,000 Public Records
- 2005-08-08 Sold (MLS) $118,000 PMAR
- 2005-05-12 Listed $114,900 PMAR
- 2001-08-01 Sold (Public Records) $63,600 Public Records
- 2001-01-01 Listing Removed — GLVRMLS
- 2000-08-14 Listed $59,900 GLVRMLS
- 2000-08-14 Listed $59,900 PMAR
Property tax history
+28.9%/yrLatest (2026): $48,701 · +1169.8% YoY. Source: county tax records.
Cash-flow waterfall
monthlySold comps — $/sqft
last 12 mo · ≤1 miLoading sold comps…