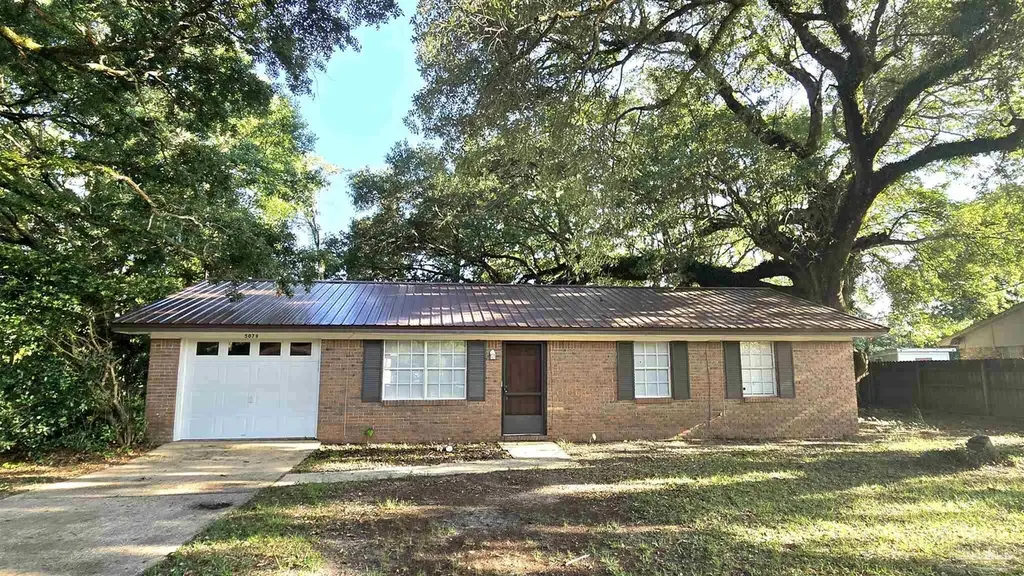
5079 Pennington Ln · Pea Ridge, FL
Flood risk 1/10 · Minimal
- FEMA flood zone
- X (unshaded)
- Chance of flooding over 30 yrs
- 0.0%
- Est. flood insurance / yr
- $507 – $1,088
Fire risk 4/10 · Minor
- Est. fire insurance / yr
- $947 – $1,759
Heat risk 9/10 · Severe
- Hot days now (above 105°F)
- 7 days/yr
- Hot days in 30 yrs
- 22 days/yr
Wind risk 9/10 · Severe
- Chance of severe wind over 30 yrs
- 99.0%
Air-quality risk 1/10 · Minimal
- Unhealthy air days now
- 0 days/yr
- Unhealthy air days in 30 yrs
- 0 days/yr
Risk factors via First Street. Map © Google.
Why this score? — see what drove the D+ grade
The composite is a weighted blend of 9 inputs, each scored 0–100. Each bar is that input's sub-score; the figure is the points it added to the 100-point composite (weight × sub-score).
- Cash flow +21.5/30.0
- DSCR +6.9/10.0
- Schools +5.3/10.0
- 1% rule +4.4/10.0
- Livability +3.5/5.0
- Rent growth +3.2/5.0
- Condition / age +2.5/5.0
- ARV discount +0.0/15.0
- Appreciation +0.0/10.0
$190,000
🖨 Deal sheet 📄 Offer letter ✓ Due diligence
Listing remarks MLS
HURRY!!!! WILL NOT LAST LONG. CONVENIENT TO SHOPPING AND SCHOOLS. LOCATED ON DEAD END STREET. GREAT FIRST TIME FAMILY HOME.
Key facts
- Mature oak trees
- Eat in kitchen
- Sliding glass doors
Tags
Property features AI
Finance
- HOA & community: No association
Exterior
- Parking: Attached garage (1 covered space, total 1 parking space)
- Utilities: Aluminum electrical wiring; Septic tank
- Home design: One-story brick home; Slab foundation; Metal roof; Resale property; Homestead exempt
- Construction: Brick construction; Slab foundation; Metal roof; One level
- Exterior features: Patio; Rain gutters; Chain link fencing around the backyard; Paved, county-maintained road access
Interior
- Kitchen: Laminate counters; Built-in microwave; Dishwasher; Electric water heater
- Bedrooms: Primary bedroom on the first floor; Additional bedrooms on the first floor
- Flooring: Tile; Carpet; Laminate
- Bathrooms: Two full bathrooms
- Heating & cooling: Central heating; Central air; Ceiling fans for cooling
- Interior features: Baseboards; Ceiling fan(s); Storm door(s); Some blinds
- Laundry & utility: Washer/Dryer hookups
Neighborhood map
What this means for you Summary
Snapshot
- This is a 3-bed/2.0-bath single-family listed at $190k.
Deal economics
- At list price, monthly cash flow is $284 ($3k/yr) — positive.
- The deal already cash-flows at list — no discount required.
- To meet the 1% rule (rent ≥ 1% of price), the offer needs to be $178k (6.3% below list).
- Recommended offer: $178k (6.3% below list) — sets the bar for 1% rule.
- Cap rate 8.1% vs local median 4.5% in Pea Ridge — top-decile yield for the area; either an underpriced asset or a hidden risk that comps aren't pricing in. Stress-test before assuming the spread holds.
Location & tenants
- Location reads 69/100 on livability (#459 in FL) — a middle-class / working-renter tenant base. Strengths: cost of living A+, housing A+, crime A-; Watch: schools D-, amenities F, commute F.
- Santa Rosa (suburban): math 63% / reading 60% proficiency, ranked #8 of 73 in FL (top 11%) — acceptable for families but not a draw, mixed tenant base, ~2y average lease.
- Market conditions: Rents rising (+2.7%/yr); 665 active listings in the ZIP; 3 comparable units currently listed for rent nearby; rentals at typical pace (median 14d on market — plan ~3-4 weeks tenant-placement turnaround); solid renter incomes; 1,983 units permitted in Santa Rosa County in 2024 (128 in 5+ unit buildings).
Forward outlook
- Local home prices are declining (-3.0%/yr); year-one equity from $1k of loan paydown is wiped out by about $6k of value loss. Plan a longer hold.
- Santa Rosa County population projected at +31% by 2050 — long-run rental-demand tailwind backs the buy-and-hold thesis.
Negotiation context
- It's been on market 16 days — a 2% lower offer ($187k) is reasonable based on typical stale-listing flexibility.
- 2 sale attempts since 22y ago with the ask held roughly flat each time — persistent listings suggest the price (not the market) is what's stuck; bring a comps-based counter.
- Current owner paid $82k; list at $190k implies a 132% gain — meaningful room to come down on a strong offer.
Risks & watch-outs
- Climate carrying-cost: severe wind risk, 99% chance of damaging wind over 30y; extreme-heat days projected 7→22/yr by 2055 (HVAC capex compounding) — expect insurance premiums to compound above CPI over the hold.
Questions for the listing agent
- Built in 1972 — when were the roof, HVAC, electrical panel, plumbing, and water heater last replaced?
- Is there a deadline driving the sale (1031 exchange, divorce, estate, relocation)? That informs how much negotiation room exists.
- Schools are D-rated, which usually means shorter tenancies and higher turnover. Who's the typical renter profile here, and what's been the actual vacancy rate?
- The area grade is low — what's the realistic commute time and amenity access for the typical tenant pool here? Any planned neighborhood developments (good or bad) we should know about?
- What's the average days-on-market for RENTAL listings here right now (not sales)? A rising rental-DOM trend means longer vacancies and softer asking-rent achievability than the comps imply.
- What's the recent tenant-quality profile in this submarket — average credit score on applications, eviction rate, late-payment / NSF rate, and stable-employment percentage? A property-management company in the area should have these aggregated.
- How much new for-sale + rental construction is in the pipeline within 1–3 miles? Heavy new supply typically softens prices + rents 12–24 months out; constrained supply supports both.
Investment metrics
- 1% rule
- 0.94% ✗
- Cap rate
- 8.09%
- Cash-on-cash
- 6.41%
- DSCR
- 1.29
- GRM
- 8.9
CMA / ARV
- ARV (on-the-fly)
- $128,520
- Comps found
- 3
Show comp detail 3 sales within ~0.75 mi
| Address | Dist | Beds/Ba | Sqft | Sold | Price | $/sf | Match |
|---|---|---|---|---|---|---|---|
| 4727 Cyril Dr | 0.16mi | 3/2.0 | 1,080 (0%) | 4mo | $100,000 | $93 | 89 |
| 4697 Cyril Dr | 0.22mi | 3/2.0 | 1,080 (0%) | 3mo | $210,000 | $194 | 87 |
| 4531 Sunrise Dr | 0.71mi | 3/1.0 | 1,008 (-7%) | 5mo | $120,000 | $119 | 48 |
Match score weights: distance 35% · size 25% · config 20% · recency 20%. Top-matched comps best support the ARV.
Projected returns pro-forma
-3.0% appreciation · 2.72% rent growth · sell at horizon
- IRR
- -6.8%
- Equity multiple
- 0.75×
- Total profit
- $-13,267
- Equity at exit
- $28,330
- IRR
- 2.5%
- Equity multiple
- 1.18×
- Total profit
- $9,361
- Equity at exit
- $16,428
Cash invested: $53,200 (down + closing). Projections, not guarantees.
Landlord ↔ Tenant lean methodology
- Overall (STATE)
- 87 Strongly Landlord-Friendly
- State Florida
- 87 Strongly Landlord-Friendly · R+3
- County
- — inherits STATE
- City
- — inherits STATE
ZIP-level market 32571
- Home prices YoY
- -17.7%
- Rents YoY
- 2.7%
- Active inventory
- 665
- Price-to-rent
- 8.9×
Monthly cashflow live
- Estimated rent
- $1,780 medium interval (Pro) →
- Mortgage (P&I)
- −$996
- Tax from tax record
- −$46 /mo · $551/yr
- Insurance
- −$79
- HOA
- −$0
- Vacancy / Maint / Mgmt
- −$374
- Net cashflow
- $284
Break-even live
UW: 25.0% down · 7.5% · 30yr · 1.5% tax · 5.0% vac · 8.0% maint · 8.0% mgmt
Financing live
Cash to close
- Down payment
- $47,500
- Closing costs
- $5,700
- Reserves months
- —
- Total cash needed
- —
Loan-product check · same deal, 3 products live
Conventional
25% down · 7.5% · 30yr
- Down + closing
- —
- Monthly P&I
- —
- Monthly cashflow
- —
- DSCR
- —
- Eligible?
- —
Personal DTI + credit; lowest rate.
DSCR
20% down · 8.5% · 30yr
- Down + closing
- —
- Monthly P&I
- —
- Monthly cashflow
- —
- DSCR
- —
- Eligible?
- —
No personal income docs; deal must DSCR.
Hard money
10% down · 12.0% · 12mo
- Down + closing
- —
- Monthly P&I
- —
- Monthly cashflow
- —
- DSCR
- —
- Eligible?
- —
Short-term bridge; refi at stabilization.
Rent comps 3 comps
| Address | Beds | Baths | Sqft | Rent | $/sqft | DOM | Units | Dist |
|---|---|---|---|---|---|---|---|---|
| 4933 Bell Ridge Ln Milton, FL | 1.0–3.0 | 1.0–2.0 | 865 | $1,437 | $1.66 | 14d | 8 | 0.86mi |
| 4496 Fiske St Milton, FL | 3.0 | 2.0 | 1418 | $1,850 | $1.30 | 14d | 1 | 1.08mi |
| 5385 E Avenida de Golf Milton, FL | 2.0 | 1.0 | 792 | $1,200 | $1.52 | 14d | 1 | 1.33mi |
Listing history 12 events
-
2026-06-18days on market $190,000 Active 16 DOM
-
2026-06-17days on market $190,000 Active 15 DOM
-
2026-06-16days on market $190,000 Active 14 DOM
-
2026-06-15days on market $190,000 Active 13 DOM
-
2026-06-14days on market $190,000 Active 11 DOM
-
2026-06-10statusdays on market $190,000 Active 8 DOM
-
2026-05-18status Pending
-
2026-05-11$190,000 Active
-
2004-09-08soldstatus $82,000
-
2004-09-03soldstatus $82,000 126-char remark
Show marketing remark (126 chars)
HURRY!!!! WILL NOT LAST LONG. CONVENIENT TO SHOPPING AND SCHOOLS. LOCATED ON DEAD END STREET. GREAT FIRST TIME FAMILY HOME.
-
2004-07-10$81,900 126-char remark
Show marketing remark (126 chars)
HURRY!!!! WILL NOT LAST LONG. CONVENIENT TO SHOPPING AND SCHOOLS. LOCATED ON DEAD END STREET. GREAT FIRST TIME FAMILY HOME.
-
1986-01-01soldstatus $38,000
ⓘ Source: listings_history table (triggers on properties + properties_extension) + one-shot
backfill from property_details.listing_events for pre-trigger history.
Tax reassessment forecast FL · Resets to sale price
- Current annual tax
- $551 · $46/mo
- Projected year-2 tax
- $1,577 · $131/mo
- Expected delta
- +$1,026/yr (+$86/mo · 186.2%)
ⓘ Screening estimate from a state-policy table — verify with the county assessor before closing.
Climate risk First Street
- Flood 1/10 Low FEMA zone X (unshaded) · 0% chance over 30 yrs
- Wildfire 4/10 Moderate
- Heat 9/10 Extreme 7 d/yr ≥105°F today · 22 d/yr by 30 yrs out
- Wind 9/10 Extreme 99% chance of damaging wind over 30 yrs
- Air quality 1/10 Low 0 unhealthy d/yr today · 0 by 30 yrs out
Nearby sold comps map
Loading sold comps map…
Walkable amenities ~0.75 mi
Loading nearby amenities…
Taxation est. · year 1
- Rental income
- $21,355
- − Mortgage interest
- −$10,643
- − Property taxes
- −$551
- − Insurance
- −$950
- − Repairs & maintenance
- −$1,708
- − Management
- −$1,708
- − Depreciation
- −$5,527
- Taxable income
- $267
- Est. tax owed @ 24.0%
- −$64
- After-tax cash flow
- $3,349/yr
For passive investors: Depreciation is non-cash, so a rental often shows a tax loss while cash-flowing — sheltering income. Rental losses are passive: they offset passive income freely, and up to $25,000/yr can offset ordinary (W-2) income if you actively participate and your MAGI is under $100k (phasing out to $0 by $150k); unused losses carry forward. On sale, claimed depreciation is recaptured at up to 25%, and gains may owe capital-gains tax (a 1031 exchange can defer both). Figures are a year-1 estimate at your 24.0% rate — not tax advice; consult a CPA.
Schools (NCES district)
- District
- Santa Rosa
- NCES district ID
- 1201650
- Math proficiency
- 63% ▼ -6.00%
- Reading proficiency
- 60% ▼ -5.00%
- Median HH income
- $58,161
- Composite
- 53.12/100
- National rank
- #1511
- State rank
- #8 of 73 in FL
Livability — Pea Ridge
- Score
- 69/100
- State rank
- #459
- US rank
- #8316
Category grades
Schools grade is shown separately in the Schools card above.
Census & demographics
- Census place
- Pea Ridge, FL
- County
- Santa Rosa County · 194,764 people
- Metro
- Pensacola-Ferry Pass-Brent, FL
- Population (ZIP)
- 42,171
- Household income
- $87,617
- Rent vs Own
- Severe rent burden
- 301.0
Population outlook (Santa Rosa County) Hauer SSP2
- Today (2025)
- 195,978 people
- By 2030
- 209,782 · +7.0%
- By 2040
- 235,293 · +20.1%
- By 2050
- 256,408 · +30.8%
- By 2075
- 298,074 · +52.1%
- By 2100
- 303,216 · +54.7%
Race, ethnicity, and origin ACS 2023
- Neighborhood character
- Predominantly White (80%)
- Race & ethnicity
- White 80% Two or more races 9% Hispanic / Latino 6% Black 4% Asian 2%
- Hispanic origin (detail)
- Mexican 3%
- Common ancestry
- Lithuanian 4% Italian 3% Slovak 2%
- Foreign-born
- 6% · Canada, South Korea
- Languages at home
- 93% English-only · Spanish 2% Other Indo-European 1% Russian/Polish/Slavic 1%
Political lean MEDSL · Santa Rosa
- 2024 margin
- Solid R (+51.0) · D 24.1% · R 75.0%
- 2008→2024 swing
- -3.0pp toward R · 2008: -47.9pp · 2024: -51.0pp
- All cycles
- 2024: R+51.0 2020: R+46.5 2016: R+53.5 2012: R+52.6 2008: R+47.9
Not yet ingested
- Civics
- —
Market trends
- HPI YoY
- ▼ -62.39%
- Current HPI
- 290.2953
- Rent YoY
- ▲ 2.72%
- Metro
- Pensacola-Ferry Pass-Brent, FL
- State GDP YoY
- ▲ 3.28%
- F500 in state
- 36
Industry mix (Fortune 500 HQ in FL)
| Industry | F500 HQs | Revenue |
|---|---|---|
| Industrial Technology | 2 | $29B |
|
||
| Insurance | 2 | $17B |
|
||
| Retail | 1 | $60B |
|
||
| Technology Distribution | 1 | $58B |
|
||
| Homebuilding | 1 | $35B |
|
||
| Technology Manufacturing | 1 | $35B |
|
||
Price history
+400.0% since first listed6 events — show timeline
- 2026-05-18 Pending — PARMLS
- 2026-05-11 Listed $190,000 PARMLS
- 2004-09-08 Sold (Public Records) $82,000 Public Records
- 2004-09-03 Sold (MLS) $82,000 PARMLS
- 2004-07-10 Listed $81,900 PARMLS
- 1986-01-01 Sold (Public Records) $38,000 Public Records
Property tax history
+0.4%/yrLatest (2025): $551 · +2.1% YoY. Source: county tax records.
Cash-flow waterfall
monthlySold comps — $/sqft
last 12 mo · ≤1 miLoading sold comps…