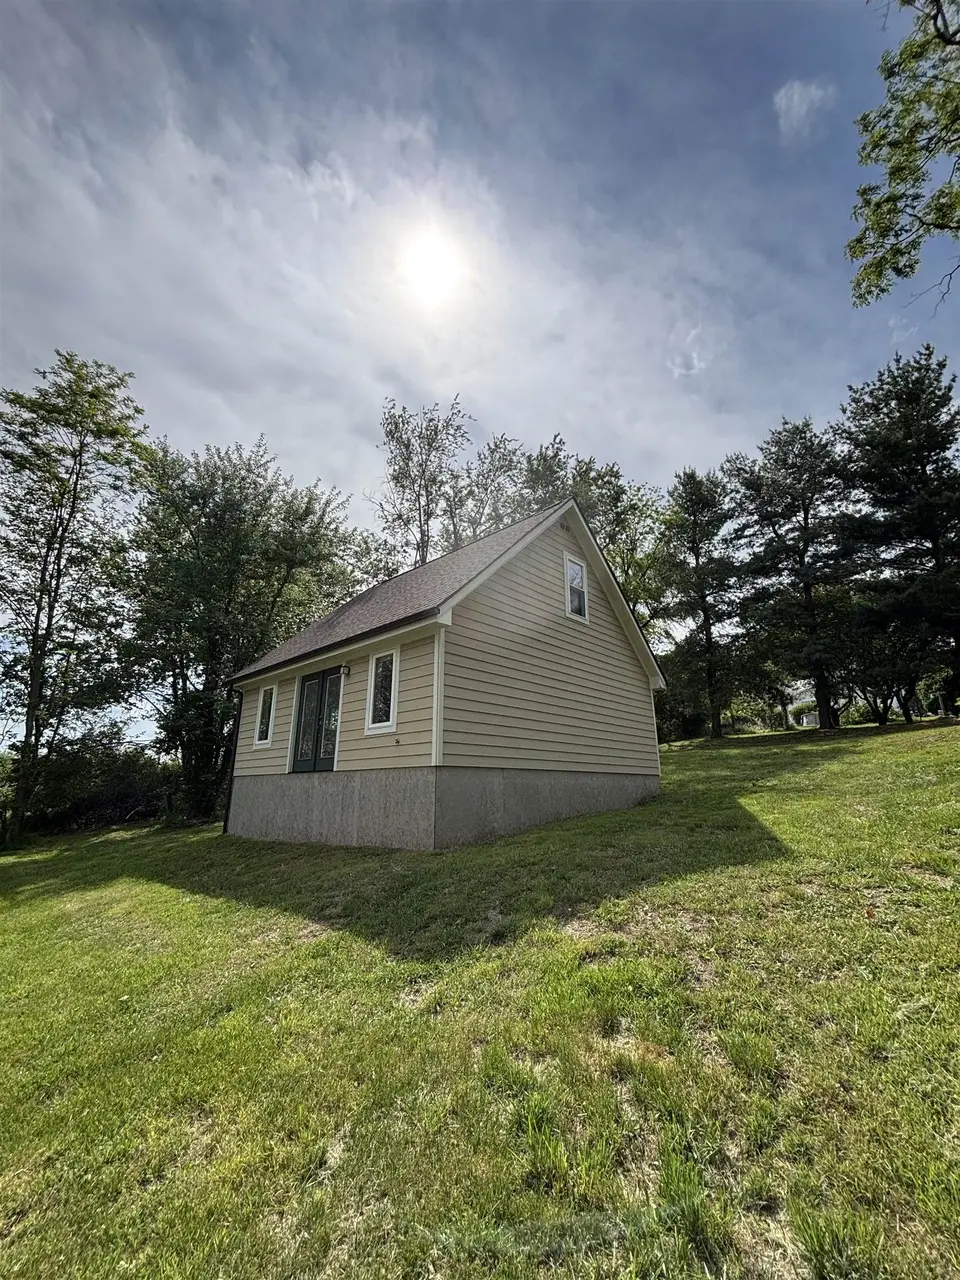
2198 Raphine Rd · Fairfield, VA
Flood risk 3/10 · Minor
- FEMA flood zone
- X (unshaded)
- Chance of flooding over 30 yrs
- 0.1%
- Est. flood insurance / yr
- $507 – $1,088
Fire risk 4/10 · Minor
- Est. fire insurance / yr
- $666 – $1,236
Heat risk 4/10 · Minor
- Hot days now (above 99°F)
- 7 days/yr
- Hot days in 30 yrs
- 18 days/yr
Wind risk 2/10 · Minimal
- Chance of severe wind over 30 yrs
- 1.0%
Air-quality risk 1/10 · Minimal
- Unhealthy air days now
- 0 days/yr
- Unhealthy air days in 30 yrs
- 0 days/yr
Risk factors via First Street. Map © Google.
Why this score? — see what drove the B grade
The composite is a weighted blend of 9 inputs, each scored 0–100. Each bar is that input's sub-score; the figure is the points it added to the 100-point composite (weight × sub-score).
- Cash flow +30.0/30.0
- DSCR +10.0/10.0
- 1% rule +8.5/10.0
- Appreciation +7.4/10.0
- Schools +4.7/10.0
- ARV discount +4.0/15.0
- Rent growth +2.5/5.0
- Livability +2.5/5.0
- Condition / age +2.5/5.0
$125,000
🖨 Deal sheet (PDF) 📄 Offer letter ✓ Due diligence
Listing remarks
This property offers exceptional potential and sits on just over one acre with a spacious yard. This property includes an older residence as well as an adorable newer home. With a few finishing touches, the newer home could make an excellent investment opportunity or starter home. The older residence previously utilized a septic system; however, the newer home is not currently connected to a septic system. Buyers are encouraged to investigate whether the existing septic system is operational and whether it may be connected to the newer home, or determine what steps may be necessary to establish a functioning septic system. Buyers should also conduct their own due diligence regarding permits
Key facts
- 1.01 acre lot
- Built 1900
- Listed 10 days
Property features AI
Exterior
- Utilities: Public water; Septic tank; Fiber optic available
- Home design: Detached property; Two-story
- Construction: Stick-built construction; Pillar/post/pier foundation
- Exterior features: Lot about 1.01 acres; Fiber optic service available
Interior
- Bathrooms: One half bath
- Heating & cooling: Wall furnace heating; Ductless cooling
- Interior features: Two levels; Above-grade finished area approximately 1,056 (owner provided)
Neighborhood map
What this means for you Summary
Snapshot
- This is a 3-bed/1.0-bath other listed at $125k.
Deal economics
- At list price, monthly cash flow is $591 ($7k/yr) — positive.
- The deal already cash-flows at list — no discount required.
- Meets the 1% rule at list price ($2k rent vs $125k).
- Cap rate 12.0% vs local median 1.8% in Fairfield — top-decile yield for the area; either an underpriced asset or a hidden risk that comps aren't pricing in. Stress-test before assuming the spread holds.
Location & tenants
- Location reads: area grade B — affects rentability + tenant quality, not the cash-flow math above.
- Rockbridge County Public School District (town): math 43% / reading 67% proficiency, ranked #80 of 131 in VA (top 61%) — acceptable for families but not a draw, mixed tenant base, ~2y average lease.
- Zoned schools: Fairfield Elementary (math 47% / reading 52%, grade D, #742 of 1,108 statewide, top 70%, 235 students, 75% FRL); Maury River Middle (math 38% / reading 63%, grade C, #226 of 342 statewide, top 67%, 502 students, 70% FRL); Rockbridge County High (math 52% / reading 82%, grade B, #185 of 319 statewide, top 61%, 994 students, 66% FRL) — zoned schools average 71% FRL vs 37% district-wide (33 pts higher); higher-poverty schools than district average — tighter screening recommended.
- Market conditions: 28 active listings in the ZIP; 85 units permitted in Rockbridge County in 2024 (0 in 5+ unit buildings).
Forward outlook
- In year one you build about $7k of equity ($864 loan paydown + $6k appreciation (4.8% local appreciation)).
- Rockbridge County population projected at -11% by 2050 — secular population decline; favor cash flow + early exit over multi-decade hold.
- At projected returns (4.8% appreciation + 3.0% rent growth), your $35k cash investment doubles in ~3 years — after that, you're playing with house money.
- By year 6, paydown + projected appreciation supports a ~$36k cash-out refi (75% LTV) — recoverable capital for the next deal without selling this one.
Negotiation context
- Only 10 days on market — expect competitive offers; lowballing is unlikely to land.
- 3 sale attempts since 9y ago with the ask held roughly flat each time — persistent listings suggest the price (not the market) is what's stuck; bring a comps-based counter.
- Current owner paid $20k; list at $125k implies a 525% gain — meaningful room to come down on a strong offer.
Risks & watch-outs
- Watch-outs: built in 1900 — expect roof / HVAC / electrical / plumbing capex.
Questions for the listing agent
- Built in 1900 — when were the roof, HVAC, electrical panel, plumbing, and water heater last replaced?
- Is there a deadline driving the sale (1031 exchange, divorce, estate, relocation)? That informs how much negotiation room exists.
- What's the average days-on-market for RENTAL listings here right now (not sales)? A rising rental-DOM trend means longer vacancies and softer asking-rent achievability than the comps imply.
- What's the recent tenant-quality profile in this submarket — average credit score on applications, eviction rate, late-payment / NSF rate, and stable-employment percentage? A property-management company in the area should have these aggregated.
- How much new for-sale + rental construction is in the pipeline within 1–3 miles? Heavy new supply typically softens prices + rents 12–24 months out; constrained supply supports both.
Investment metrics
- 1% rule
- 1.35% ✓
- Cap rate
- 11.97%
- Cash-on-cash
- 20.28%
- DSCR
- 1.90
- GRM
- 6.2
CMA / ARV
- ARV (median comp)
- $115,985
- List price
- $125,000
- Delta
- 7.77%
- Verdict
- FAIR
- Comps
- 3 within 2.0 mi
Projected returns pro-forma
4.75% appreciation · 3.0% rent growth · sell at horizon
- IRR
- 30.0%
- Equity multiple
- 2.85×
- Total profit
- $64,644
- Equity at exit
- $68,942
- IRR
- 28.9%
- Equity multiple
- 5.68×
- Total profit
- $163,647
- Equity at exit
- $117,447
Cash invested: $35,000 (down + closing). Projections, not guarantees.
Landlord ↔ Tenant lean methodology
- Overall (STATE)
- 55 Moderately Landlord-Leaning
- State Virginia
- 55 Moderately Landlord-Leaning · D+2
- County
- — inherits STATE
- City
- — inherits STATE
ZIP-level market 24472
- Home prices YoY
- 2.6%
- Active inventory
- 28
- Price-to-rent
- 6.2×
Monthly cashflow live
- Estimated rent
- $1,684 medium interval (Pro) →
- Mortgage (P&I)
- −$656
- Tax from tax record
- −$32 /mo · $380/yr
- Insurance
- −$52
- HOA
- −$0
- Vacancy / Maint / Mgmt
- −$354
- Net cashflow
- $591
Break-even live
Sensitivity live
| Price | -10% $662 | -5% $627 | +0% $591 | +5% $556 | +10% $521 |
|---|---|---|---|---|---|
| Rent | -10% $458 | -5% $525 | +0% $591 | +5% $658 | +10% $724 |
| Rate | -1.0pp $654 | -0.5pp $623 | base $591 | +0.5pp $559 | +1.0pp $526 |
UW: 25.0% down · 7.5% · 30yr · 1.5% tax · 5.0% vac · 8.0% maint · 8.0% mgmt
Financing live
Cash to close
- Down payment
- $31,250
- Closing costs
- $3,750
- Reserves months
- —
- Total cash needed
- —
Loan-product check · same deal, 3 products live
Conventional
25% down · 7.5% · 30yr
- Down + closing
- —
- Monthly P&I
- —
- Monthly cashflow
- —
- DSCR
- —
- Eligible?
- —
Personal DTI + credit; lowest rate.
DSCR
20% down · 8.5% · 30yr
- Down + closing
- —
- Monthly P&I
- —
- Monthly cashflow
- —
- DSCR
- —
- Eligible?
- —
No personal income docs; deal must DSCR.
Hard money
10% down · 12.0% · 12mo
- Down + closing
- —
- Monthly P&I
- —
- Monthly cashflow
- —
- DSCR
- —
- Eligible?
- —
Short-term bridge; refi at stabilization.
Listing history 4 events
-
2026-05-14$125,000 Active 726-char remark
-
2019-11-05soldstatus $20,000
-
2019-09-15$25,000
-
2017-02-24$35,000
ⓘ Source: listings_history table (triggers on properties + properties_extension) + one-shot
backfill from property_details.listing_events for pre-trigger history.
Tax reassessment forecast VA · Resets to sale price
- Current annual tax
- $380 · $32/mo
- Projected year-2 tax
- $1,025 · $85/mo
- Expected delta
- +$645/yr (+$54/mo · 169.6%)
ⓘ Screening estimate from a state-policy table — verify with the county assessor before closing.
Climate risk First Street
- Flood 3/10 Moderate FEMA zone X (unshaded) · 10% chance over 30 yrs
- Wildfire 4/10 Moderate
- Heat 4/10 Moderate 7 d/yr ≥99°F today · 18 d/yr by 30 yrs out
- Wind 2/10 Low 100% chance of damaging wind over 30 yrs
- Air quality 1/10 Low 0 unhealthy d/yr today · 0 by 30 yrs out
Nearby sold comps map
Loading sold comps map…
Walkable amenities ~0.75 mi
Loading nearby amenities…
Taxation est. · year 1
- Rental income
- $20,212
- − Mortgage interest
- −$7,002
- − Property taxes
- −$380
- − Insurance
- −$625
- − Repairs & maintenance
- −$1,617
- − Management
- −$1,617
- − Depreciation
- −$3,636
- Taxable income
- $5,335
- Est. tax owed @ 24.0%
- −$1,280
- After-tax cash flow
- $5,816/yr
For passive investors: Depreciation is non-cash, so a rental often shows a tax loss while cash-flowing — sheltering income. Rental losses are passive: they offset passive income freely, and up to $25,000/yr can offset ordinary (W-2) income if you actively participate and your MAGI is under $100k (phasing out to $0 by $150k); unused losses carry forward. On sale, claimed depreciation is recaptured at up to 25%, and gains may owe capital-gains tax (a 1031 exchange can defer both). Figures are a year-1 estimate at your 24.0% rate — not tax advice; consult a CPA.
Schools (NCES district)
- District
- Rockbridge County Public School District
- NCES district ID
- 5103370
- Math proficiency
- 43% ▼ -41.00%
- Reading proficiency
- 67% ▼ -12.00%
- Median HH income
- $48,021
- Composite
- 46.65/100
- National rank
- #2408
- State rank
- #80 of 131 in VA
Livability — Fairfield
No livability data for this city. (Only ~50 U.S. cities are tracked.)
Census & demographics
- Population (ZIP)
- 2,204
Population outlook (Rockbridge County) Hauer SSP2
- Today (2025)
- 22,549 people
- By 2030
- 22,381 · -0.7%
- By 2040
- 21,488 · -4.7%
- By 2050
- 20,054 · -11.1%
- By 2075
- 16,228 · -28.0%
- By 2100
- 11,598 · -48.6%
Race, ethnicity, and origin ACS 2023
- Neighborhood character
- Predominantly White (90%)
- Race & ethnicity
- White 90% Native American 2% Two or more races 1%
- Common ancestry
- Serbian 3% Slovak 2% Romanian 1%
- Foreign-born
- 0%
- Languages at home
- 100% English-only · German/W. Germanic 0%
Political lean MEDSL · Rockbridge
- 2024 margin
- Solid R (+33.8) · D 32.6% · R 66.4%
- 2008→2024 swing
- -20.2pp toward R · 2008: -13.6pp · 2024: -33.8pp
- All cycles
- 2024: R+33.8 2020: R+32.4 2016: R+29.6 2012: R+17.8 2008: R+13.6
Not yet ingested
- Civics
- —
Market trends
- HPI YoY
- ▲ 4.75%
- Current HPI
- 187.9458
- Rent YoY
- —
- Metro
- —
- State GDP YoY
- ▲ 2.40%
- F500 in state
- 50
Industry mix (Fortune 500 HQ in VA)
| Industry | F500 HQs | Revenue |
|---|---|---|
| Aerospace / Defense | 4 | $236B |
|
||
| Technology / Defense | 3 | $32B |
|
||
| Financial Services | 2 | $176B |
|
||
| Utilities | 2 | $27B |
|
||
| Insurance | 2 | $25B |
|
||
| Technology | 2 | $15B |
|
||
Price history
+257.1% since first listed5 events — show timeline
- 2026-05-24 Pending — GAAR
- 2026-05-14 Listed $125,000 GAAR
- 2019-11-05 Sold (Public Records) $20,000 Public Records
- 2019-09-15 Listed $25,000 CAAR
- 2017-02-24 Listed $35,000 GAAR
Property tax history
+3.5%/yrLatest (2025): $380 · +4.9% YoY. Source: county tax records.
Cash-flow waterfall
monthlySold comps — $/sqft
last 12 mo · ≤1 miLoading sold comps…