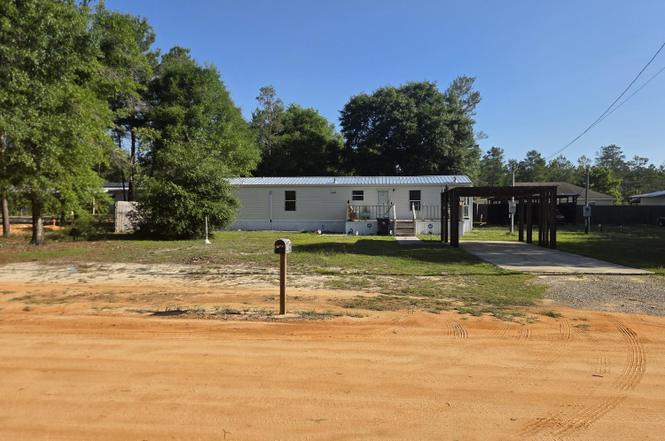
280 Meteyard Ln · DeFuniak Springs, FL
Flood risk 1/10 · Minimal
- FEMA flood zone
- X (unshaded)
- Chance of flooding over 30 yrs
- 0.0%
- Est. flood insurance / yr
- $507 – $1,088
Fire risk 5/10 · Moderate
- Est. fire insurance / yr
- $947 – $1,759
Heat risk 9/10 · Severe
- Hot days now (above 107°F)
- 7 days/yr
- Hot days in 30 yrs
- 20 days/yr
Wind risk 9/10 · Severe
- Chance of severe wind over 30 yrs
- 99.0%
Air-quality risk 1/10 · Minimal
- Unhealthy air days now
- 0 days/yr
- Unhealthy air days in 30 yrs
- 0 days/yr
Risk factors via First Street. Map © Google.
Why this score? — see what drove the B- grade
The composite is a weighted blend of 9 inputs, each scored 0–100. Each bar is that input's sub-score; the figure is the points it added to the 100-point composite (weight × sub-score).
- Cash flow +26.8/30.0
- Appreciation +10.0/10.0
- DSCR +9.2/10.0
- 1% rule +5.9/10.0
- Schools +5.2/10.0
- Livability +3.2/5.0
- Rent growth +2.5/5.0
- Condition / age +2.5/5.0
- ARV discount +0.0/15.0
$159,000
🖨 Deal sheet (PDF) 📄 Offer letter ✓ Due diligence
Listing remarks
2BR/1BA manufactured home on an oversized 0.46-acre homesite in DeFuniak Springs, comprised of two 0.23-acre lots. Built in 2006 with an efficient 864 SF layout and over $45K in upgrades completed in 2024, including commercial-grade LVP flooring, a mini-split system, deck, galvanized metal roof, gutters, and a new septic system. Outside features include a carport with additional covered parking, multiple sheds, and a workshop with power, ideal for projects or extra storage. The second 0.23-acre lot includes a septic tank and existing public water and electric hookups already in place, making it perfect for RV parking, future use, or potential resale. Seller will remove the shipping containe
Key facts
- Multiple sheds
- Oversized homesite
- Mini-split system
Tags
Property features AI
Finance
- HOA & community: Subdivision: OAKWOOD HILLS UNIT 1
Exterior
- Parking: Detached covered carport; 3 covered parking spaces
- Utilities: Public water; Septic tank; Electric service; Phone service
- Home design: Manufactured home; 1 story; Built in 2006; Zoned for single family residential; Facing direction not specified
- Construction: Vinyl siding; Metal roof; Foundation details not specified
- Exterior features: Rain gutters; Covered deck; Open deck; Workshop on property; Cleared lot; Survey available; County road frontage; Access via county and dirt/clay roads
Interior
- Kitchen: Freezer; Microwave; Refrigerator; Electric water heater
- Bedrooms: 2 bedrooms (all on the first level)
- Flooring: Vinyl flooring
- Bathrooms: 1 full bathroom
- Heating & cooling: Window unit(s) for cooling; Wall/window heating; Electric water heater
- Interior features: Washer/dryer hookup; Window/wall heating and cooling indicated (window units for cooling)
- Laundry & utility: Washer/dryer hookup
Neighborhood map
What this means for you Summary
Snapshot
- This is a 3-bed/2.0-bath manufactured listed at $159k.
Deal economics
- At list price, monthly cash flow is $433 ($5k/yr) — positive.
- The deal already cash-flows at list — no discount required.
- Meets the 1% rule at list price ($2k rent vs $159k).
- Recommended offer: $140k (12.0% below list) — sets the bar for market timing.
- Cap rate 9.6% vs local median 4.8% in DeFuniak Springs — top-decile yield for the area; either an underpriced asset or a hidden risk that comps aren't pricing in. Stress-test before assuming the spread holds.
Location & tenants
- Location reads 64/100 on livability (#694 in FL) — a middle-class / working-renter tenant base. Strengths: cost of living A+, housing A+; Watch: health & safety C-, crime D, amenities F.
- Walton (rural): math 62% / reading 61% proficiency, ranked #10 of 73 in FL (top 14%) — acceptable for families but not a draw, mixed tenant base, ~2y average lease.
- Zoned schools: West Defuniak Elementary School (math 67% / reading 57%, grade B, #608 of 2,144 statewide, top 29%, 669 students, 69% FRL); Emerald Coast Middle School (math 70% / reading 65%, grade A-, #77 of 571 statewide, top 14%, 868 students, 24% FRL); Walton High School (math 52% / reading 53%, grade C-, #154 of 667 statewide, top 24%, 856 students, 65% FRL) — zoned schools at 52% FRL track the district average.
- Market conditions: 423 active listings in the ZIP; 2 comparable units currently listed for rent nearby; 2,883 units permitted in Walton County in 2024 (1,322 in 5+ unit buildings).
- This rent runs 40% of the median local income ($52k/yr) — at the standard rent-burdened threshold; future hikes will face affordability resistance.
Forward outlook
- In year one you build about $17k of equity ($1k loan paydown + $16k appreciation (10.0% local appreciation)).
- Walton County population projected at +46% by 2050 — long-run rental-demand tailwind backs the buy-and-hold thesis.
- At projected returns (10.0% appreciation + 3.0% rent growth), your $45k cash investment doubles in ~2 years — after that, you're playing with house money.
- By year 3, paydown + projected appreciation supports a ~$43k cash-out refi (75% LTV) — recoverable capital for the next deal without selling this one.
Negotiation context
- It's been on market 137 days — a 12% lower offer ($140k) is reasonable based on typical stale-listing flexibility.
Risks & watch-outs
- Climate carrying-cost: severe wind risk, 99% chance of damaging wind over 30y; moderate wildfire risk; extreme-heat days projected 7→20/yr by 2055 (HVAC capex compounding) — expect insurance premiums to compound above CPI over the hold.
Questions for the listing agent
- It's been on market 137 days. Have you received any prior offers? Is the seller open to a 12% concession, seller financing, or rate buy-down credit?
- Why hasn't it sold? Are there any deal-killer items the seller is aware of (foundation, flood, title, zoning, code violations)?
- Is there a deadline driving the sale (1031 exchange, divorce, estate, relocation)? That informs how much negotiation room exists.
- Schools are D-rated, which usually means shorter tenancies and higher turnover. Who's the typical renter profile here, and what's been the actual vacancy rate?
- Crime grade is D in this area — have there been break-ins, vandalism, or insurance claims at this property in the last 3 years? What carrier currently insures it and at what premium?
- What's the average days-on-market for RENTAL listings here right now (not sales)? A rising rental-DOM trend means longer vacancies and softer asking-rent achievability than the comps imply.
- What's the recent tenant-quality profile in this submarket — average credit score on applications, eviction rate, late-payment / NSF rate, and stable-employment percentage? A property-management company in the area should have these aggregated.
- How much new for-sale + rental construction is in the pipeline within 1–3 miles? Heavy new supply typically softens prices + rents 12–24 months out; constrained supply supports both.
Investment metrics
- 1% rule
- 1.09% ✓
- Cap rate
- 9.56%
- Cash-on-cash
- 11.67%
- DSCR
- 1.52
- GRM
- 7.7
CMA / ARV
- ARV (on-the-fly)
- $112,320
- Comps found
- 8
Show comp detail 8 sales within ~0.75 mi
| Address | Dist | Beds/Ba | Sqft | Sold | Price | $/sf | Match |
|---|---|---|---|---|---|---|---|
| 514 W Royal Palm Ave | 0.24mi | 2/2.0 (-1) | 858 (-1%) | 8mo | $74,000 | $86 | 76 |
| 25 Lafavre Ln | 0.15mi | 2/2.0 (-1) | 820 (-5%) | 12mo | $121,900 | $149 | 69 |
| 402 W Royal Palm Ave | 0.61mi | 3/2.0 | 924 (+7%) | 2mo | $119,900 | $130 | 59 |
| 382 W ROYAL PALM Ave | 0.61mi | 3/2.0 | 924 (+7%) | 3mo | $119,900 | $130 | 57 |
| 66 E Orange Blossom Ave | 0.65mi | 2/2.0 (-1) | 924 (+7%) | 2mo | $100,000 | $108 | 52 |
| 61 Juniper Ave | 0.56mi | 2/2.0 (-1) | 784 (-9%) | 4mo | $20,000 | $26 | 50 |
| 19 Oleander Ave | 0.61mi | 2/2.0 (-1) | 896 (+4%) | 21mo | $150,000 | $167 | 43 |
| 18 Orange Blossom Ave | 0.59mi | 2/1.0 (-1) | 888 (+3%) | 19mo | $55,000 | $62 | 43 |
Match score weights: distance 35% · size 25% · config 20% · recency 20%. Top-matched comps best support the ARV.
Projected returns pro-forma
10.0% appreciation · 3.0% rent growth · sell at horizon
- IRR
- 32.8%
- Equity multiple
- 3.56×
- Total profit
- $114,102
- Equity at exit
- $143,240
- IRR
- 28.3%
- Equity multiple
- 8.06×
- Total profit
- $314,173
- Equity at exit
- $308,902
Cash invested: $44,520 (down + closing). Projections, not guarantees.
Landlord ↔ Tenant lean methodology
- Overall (STATE)
- 87 Strongly Landlord-Friendly
- State Florida
- 87 Strongly Landlord-Friendly · R+3
- County
- — inherits STATE
- City
- — inherits STATE
ZIP-level market 32433
- Home prices YoY
- 4.2%
- Active inventory
- 423
- Price-to-rent
- 7.7×
Monthly cashflow live
- Estimated rent
- $1,731 medium interval (Pro) →
- Mortgage (P&I)
- −$834
- Tax from tax record
- −$34 /mo · $408/yr
- Insurance
- −$66
- HOA
- −$0
- Vacancy / Maint / Mgmt
- −$363
- Net cashflow
- $433
Break-even live
Sensitivity live
| Price | -10% $523 | -5% $478 | +0% $433 | +5% $388 | +10% $343 |
|---|---|---|---|---|---|
| Rent | -10% $296 | -5% $365 | +0% $433 | +5% $501 | +10% $570 |
| Rate | -1.0pp $513 | -0.5pp $473 | base $433 | +0.5pp $392 | +1.0pp $350 |
UW: 25.0% down · 7.5% · 30yr · 1.5% tax · 5.0% vac · 8.0% maint · 8.0% mgmt
Financing live
Cash to close
- Down payment
- $39,750
- Closing costs
- $4,770
- Reserves months
- —
- Total cash needed
- —
Loan-product check · same deal, 3 products live
Conventional
25% down · 7.5% · 30yr
- Down + closing
- —
- Monthly P&I
- —
- Monthly cashflow
- —
- DSCR
- —
- Eligible?
- —
Personal DTI + credit; lowest rate.
DSCR
20% down · 8.5% · 30yr
- Down + closing
- —
- Monthly P&I
- —
- Monthly cashflow
- —
- DSCR
- —
- Eligible?
- —
No personal income docs; deal must DSCR.
Hard money
10% down · 12.0% · 12mo
- Down + closing
- —
- Monthly P&I
- —
- Monthly cashflow
- —
- DSCR
- —
- Eligible?
- —
Short-term bridge; refi at stabilization.
Rent comps 2 comps
| Address | Beds | Baths | Sqft | Rent | $/sqft | DOM | Units | Dist |
|---|---|---|---|---|---|---|---|---|
| 71 Lafavre Ln Defuniak Springs, FL | 2.0 | 1.0 | 806 | $1,650 | $2.05 | 23d | 1 | 0.06mi |
| 135 Tiger Lily Ln Defuniak Springs, FL | 3.0 | 2.0 | 1114 | $1,795 | $1.61 | 15d | 1 | 0.55mi |
Listing history 19 events
-
2026-06-21days on market $159,000 Active 137 DOM
-
2026-06-18days on market $159,000 Active 134 DOM
-
2026-06-17days on market $159,000 Active 133 DOM
-
2026-06-16days on market $159,000 Active 132 DOM
-
2026-06-15days on market $159,000 Active 131 DOM
-
2026-06-14days on market $159,000 Active 129 DOM
-
2026-06-13days on market $159,000 Active 128 DOM
-
2026-06-10days on market $159,000 Active 126 DOM
-
2026-06-09days on market $159,000 Active 125 DOM
-
2026-06-08days on market $159,000 Active 124 DOM
-
2026-06-07days on market $159,000 Active 123 DOM
-
2026-06-05days on market $159,000 Active 120 DOM
-
2026-06-03days on market $159,000 Active 119 DOM
-
2026-06-03days on market $159,000 Active 118 DOM
-
2026-06-01days on market $159,000 Active 117 DOM
-
2026-05-31days on market $159,000 Active 116 DOM
-
2026-05-30days on market $159,000 Active 115 DOM
-
2026-04-07price $159,000
-
2026-02-04$180,000 Active
ⓘ Source: listings_history table (triggers on properties + properties_extension) + one-shot
backfill from property_details.listing_events for pre-trigger history.
Tax reassessment forecast FL · Resets to sale price
- Current annual tax
- $408 · $34/mo
- Projected year-2 tax
- $1,320 · $110/mo
- Expected delta
- +$911/yr (+$76/mo · 223.3%)
ⓘ Screening estimate from a state-policy table — verify with the county assessor before closing.
Climate risk First Street
- Flood 1/10 Low FEMA zone X (unshaded) · 0% chance over 30 yrs
- Wildfire 5/10 Major
- Heat 9/10 Extreme 7 d/yr ≥107°F today · 20 d/yr by 30 yrs out
- Wind 9/10 Extreme 99% chance of damaging wind over 30 yrs
- Air quality 1/10 Low 0 unhealthy d/yr today · 0 by 30 yrs out
Nearby sold comps map
Loading sold comps map…
Walkable amenities ~0.75 mi
Loading nearby amenities…
Taxation est. · year 1
- Rental income
- $20,767
- − Mortgage interest
- −$8,906
- − Property taxes
- −$408
- − Insurance
- −$795
- − Repairs & maintenance
- −$1,661
- − Management
- −$1,661
- − Depreciation
- −$4,625
- Taxable income
- $2,709
- Est. tax owed @ 24.0%
- −$650
- After-tax cash flow
- $4,547/yr
For passive investors: Depreciation is non-cash, so a rental often shows a tax loss while cash-flowing — sheltering income. Rental losses are passive: they offset passive income freely, and up to $25,000/yr can offset ordinary (W-2) income if you actively participate and your MAGI is under $100k (phasing out to $0 by $150k); unused losses carry forward. On sale, claimed depreciation is recaptured at up to 25%, and gains may owe capital-gains tax (a 1031 exchange can defer both). Figures are a year-1 estimate at your 24.0% rate — not tax advice; consult a CPA.
Schools (NCES district)
- District
- Walton
- NCES district ID
- 1201980
- Math proficiency
- 62% ▼ -4.00%
- Reading proficiency
- 61% ▼ -2.00%
- Median HH income
- $46,794
- Composite
- 52.03/100
- National rank
- #1634
- State rank
- #10 of 73 in FL
Livability — DeFuniak Springs
- Score
- 64/100
- State rank
- #694
- US rank
- #14475
Category grades
Schools grade is shown separately in the Schools card above.
Census & demographics
- County
- Walton County · 70,839 people
- City population
- 19,746
- Metro
- Crestview-Fort Walton Beach-Destin, FL
- Population (ZIP)
- 19,746
- Household income
- $52,199
- Rent vs Own
- Severe rent burden
- 356.0
Population outlook (Walton County) Hauer SSP2
- Today (2025)
- 80,014 people
- By 2030
- 88,120 · +10.1%
- By 2040
- 103,537 · +29.4%
- By 2050
- 117,034 · +46.3%
- By 2075
- 143,901 · +79.8%
- By 2100
- 155,138 · +93.9%
Race, ethnicity, and origin ACS 2023
- Neighborhood character
- Predominantly White (75%)
- Race & ethnicity
- White 75% Black 10% Hispanic / Latino 8% Two or more races 7% Native American 1%
- Hispanic origin (detail)
- Mexican 5%
- Common ancestry
- Slovak 3% Italian 2% Lithuanian 2%
- Foreign-born
- 6% · Canada
- Languages at home
- 92% English-only · Spanish 4% Other Indo-European 1% French/Haitian/Cajun 1%
Political lean MEDSL · Walton
- 2024 margin
- Solid R (+57.8) · D 20.7% · R 78.6%
- 2008→2024 swing
- -12.0pp toward R · 2008: -45.8pp · 2024: -57.8pp
- All cycles
- 2024: R+57.8 2020: R+51.7 2016: R+56.1 2012: R+52.0 2008: R+45.8
Not yet ingested
- Civics
- —
Market trends
- HPI YoY
- ▲ 14.77%
- Current HPI
- 367.046
- Rent YoY
- —
- Metro
- Crestview-Fort Walton Beach-Destin, FL
- State GDP YoY
- ▲ 3.28%
- F500 in state
- 36
Industry mix (Fortune 500 HQ in FL)
| Industry | F500 HQs | Revenue |
|---|---|---|
| Industrial Technology | 2 | $29B |
|
||
| Insurance | 2 | $17B |
|
||
| Retail | 1 | $60B |
|
||
| Technology Distribution | 1 | $58B |
|
||
| Homebuilding | 1 | $35B |
|
||
| Technology Manufacturing | 1 | $35B |
|
||
Price history
-11.7% since first listed2 events — show timeline
- 2026-04-07 Price Changed $159,000 ECAR
- 2026-02-04 Listed $180,000 ECAR
Property tax history
+16.7%/yrLatest (2025): $408 · +444.3% YoY. Source: county tax records.
Cash-flow waterfall
monthlySold comps — $/sqft
last 12 mo · ≤1 miLoading sold comps…