 🏗️ New Construction
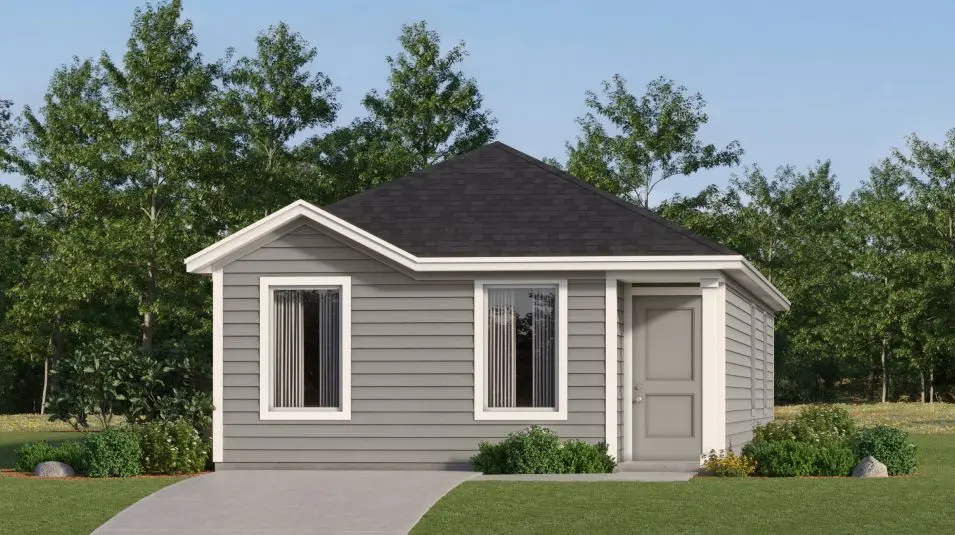
Windrow Plan · San Antonio, TX
Flood risk No data
- FEMA flood zone
- —
- Chance of flooding over 30 yrs
- —
- Est. flood insurance / yr
- —
Fire risk No data
- Est. fire insurance / yr
- —
Heat risk No data
- Hot days now (above threshold)
- —
- Hot days in 30 yrs
- —
Wind risk No data
- Chance of severe wind over 30 yrs
- —
Air-quality risk No data
- Unhealthy air days now
- —
- Unhealthy air days in 30 yrs
- —
Risk factors via First Street. Map © Google.
Why this score? — see what drove the D grade
The composite is a weighted blend of 9 inputs, each scored 0–100. Each bar is that input's sub-score; the figure is the points it added to the 100-point composite (weight × sub-score).
- Cash flow +10.4/30.0
- ARV discount +7.5/15.0
- Appreciation +7.0/10.0
- Livability +4.0/5.0
- 1% rule +3.1/10.0
- DSCR +3.0/10.0
- Rent growth +2.5/5.0
- Condition / age +2.5/5.0
- Schools +1.8/10.0
$169,999
🖨 Deal sheet 📄 Offer letter ✓ Due diligence
Listing remarks MLS
This single-level home showcases a spacious open floorplan shared between the kitchen, dining area and family room for easy entertaining during gatherings. An owner's suite enjoys a private location in the back of the home, complemented by an en-suite bathroom, walk-in closet and direct access to the backyard space. There are two secondary bedrooms that are both ideal for household members and overnight guests.
Key facts
- Walk-in closet
- Open floorplan
- En-suite bathroom
Tags
Neighborhood map
What this means for you Summary
Snapshot
- This is a 3-bed/2.0-bath single-family listed at $170k.
Deal economics
- At list price, monthly cash flow is $-88 ($-1k/yr) — negative.
- To cash-flow at today's rent, offer at most $154k (9.7% below list).
- To meet the 1% rule (rent ≥ 1% of price), the offer needs to be $134k (21.0% below list).
- Recommended offer: $134k (21.0% below list) — sets the bar for 1% rule.
- Cap rate 5.7% vs local median 3.8% in San Antonio — top-decile yield for the area; either an underpriced asset or a hidden risk that comps aren't pricing in. Stress-test before assuming the spread holds.
Location & tenants
- Location reads 80/100 on livability (#31 in TX, #1,616 nationally) — a professional / high-income tenant draw. Strengths: amenities A+, commute A+, cost of living A+; Watch: schools C-, crime F.
- Southside ISD (rural): math 16% / reading 25% proficiency, ranked #771 of 826 in TX (top 93%) — low school quality limits family demand, transient renter base, plan for 1-2y turnover; 76% free/reduced lunch — lower-income household profile, screen leases tightly.
- Market conditions: 329 active listings in the ZIP; 20 comparable units currently listed for rent nearby; rentals at typical pace (median 24d on market — plan ~3-4 weeks tenant-placement turnaround); 8,308 units permitted in Bexar County in 2024 (2,506 in 5+ unit buildings).
Forward outlook
- In year one you build about $8k of equity ($1k loan paydown + $7k appreciation (3.9% local appreciation)).
- Bexar County population projected at +50% by 2050 — long-run rental-demand tailwind backs the buy-and-hold thesis.
- By year 5, paydown + projected appreciation supports a ~$33k cash-out refi (75% LTV) — recoverable capital for the next deal without selling this one.
Negotiation context
- It's been on market 496 days — a 12% lower offer ($150k) is reasonable based on typical stale-listing flexibility.
Questions for the listing agent
- What do current leases actually rent for vs. the listed asking? Can we see a recent rent roll and the last 12 months of T-12 income?
- It's been on market 496 days. Have you received any prior offers? Is the seller open to a 21% concession, seller financing, or rate buy-down credit?
- Why hasn't it sold? Are there any deal-killer items the seller is aware of (foundation, flood, title, zoning, code violations)?
- Is there a deadline driving the sale (1031 exchange, divorce, estate, relocation)? That informs how much negotiation room exists.
- Crime grade is F in this area — have there been break-ins, vandalism, or insurance claims at this property in the last 3 years? What carrier currently insures it and at what premium?
- The area grade is low — what's the realistic commute time and amenity access for the typical tenant pool here? Any planned neighborhood developments (good or bad) we should know about?
- What's the average days-on-market for RENTAL listings here right now (not sales)? A rising rental-DOM trend means longer vacancies and softer asking-rent achievability than the comps imply.
- What's the recent tenant-quality profile in this submarket — average credit score on applications, eviction rate, late-payment / NSF rate, and stable-employment percentage? A property-management company in the area should have these aggregated.
- How much new for-sale + rental construction is in the pipeline within 1–3 miles? Heavy new supply typically softens prices + rents 12–24 months out; constrained supply supports both.
Investment metrics
- 1% rule
- 0.81% ✗
- Cap rate
- 5.66%
- Cash-on-cash
- -2.26%
- DSCR
- 0.90
- GRM
- 10.3
CMA / ARV
- ARV (median comp)
- $166,224
- List price
- $169,999
- Delta
- 2.27%
- Verdict
- FAIR
- Comps
- 20 within 1.0 mi
Show comp detail 12 sales within ~0.75 mi
| Address | Dist | Beds/Ba | Sqft | Sold | Price | $/sf | Match |
|---|---|---|---|---|---|---|---|
| 2842 Carnelian Trl | 0.07mi | 3/2.0 | 1,033 (0%) | 10mo | $184,999 | $179 | 89 |
| 2826 Carnelian Trl | 0.07mi | 3/2.0 | 1,033 (0%) | 10mo | $138,749 | $134 | 89 |
| 2818 Carnelian Trl | 0.07mi | 3/2.0 | 1,033 (0%) | 10mo | $152,399 | $148 | 88 |
| 20337 Onyx Ring | 0.04mi | 3/2.0 | 1,033 (0%) | 13mo | $153,899 | $149 | 88 |
| 20454 Onyx Ring | 0.08mi | 3/2.0 | 1,033 (0%) | 11mo | $166,999 | $162 | 87 |
| 20329 Onyx Ring | 0.05mi | 3/2.0 | 1,033 (0%) | 14mo | $154,499 | $150 | 86 |
| 20333 Onyx Ring | 0.04mi | 3/2.0 | 1,033 (0%) | 15mo | $136,999 | $133 | 86 |
| 20325 Onyx Ring | 0.06mi | 3/2.0 | 1,033 (0%) | 15mo | $144,499 | $140 | 85 |
| 20322 Onyx Ring | 0.08mi | 3/2.0 | 1,033 (0%) | 14mo | $146,339 | $142 | 84 |
| 20342 Onyx Ring | 0.06mi | 3/2.0 | 1,033 (0%) | 16mo | $152,999 | $148 | 84 |
| 20402 Onyx Ring | 0.05mi | 3/2.0 | 1,033 (0%) | 19mo | $147,999 | $143 | 82 |
| 20407 Red Coral | 0.07mi | 3/2.0 | 1,129 (+9%) | 20mo | $181,999 | $161 | 64 |
Match score weights: distance 35% · size 25% · config 20% · recency 20%. Top-matched comps best support the ARV.
Projected returns pro-forma
3.94% appreciation · 3.0% rent growth · sell at horizon
- IRR
- 8.1%
- Equity multiple
- 1.49×
- Total profit
- $22,930
- Equity at exit
- $83,745
- IRR
- 10.3%
- Equity multiple
- 2.71×
- Total profit
- $79,452
- Equity at exit
- $136,548
Cash invested: $46,543 (down + closing). Projections, not guarantees.
Landlord ↔ Tenant lean methodology
- Overall (STATE)
- 87 Strongly Landlord-Friendly
- State Texas
- 87 Strongly Landlord-Friendly · R+5
- County
- — inherits STATE
- City
- — inherits STATE
ZIP-level market 78264
- Home prices YoY
- 1.3%
- Active inventory
- 329
- Price-to-rent
- 10.5×
Monthly cashflow live
- Estimated rent
- $1,343 high interval (Pro) →
- Mortgage (P&I)
- −$872
- Tax est. 1.5%
- −$208 /mo · $2,493/yr
- Insurance
- −$69
- HOA
- −$0
- Vacancy / Maint / Mgmt
- −$282
- Net cashflow
- $-88
Break-even live
UW: 25.0% down · 7.5% · 30yr · 1.5% tax · 5.0% vac · 8.0% maint · 8.0% mgmt
Financing live
Cash to close
- Down payment
- $41,556
- Closing costs
- $4,987
- Reserves months
- —
- Total cash needed
- —
Loan-product check · same deal, 3 products live
Conventional
25% down · 7.5% · 30yr
- Down + closing
- —
- Monthly P&I
- —
- Monthly cashflow
- —
- DSCR
- —
- Eligible?
- —
Personal DTI + credit; lowest rate.
DSCR
20% down · 8.5% · 30yr
- Down + closing
- —
- Monthly P&I
- —
- Monthly cashflow
- —
- DSCR
- —
- Eligible?
- —
No personal income docs; deal must DSCR.
Hard money
10% down · 12.0% · 12mo
- Down + closing
- —
- Monthly P&I
- —
- Monthly cashflow
- —
- DSCR
- —
- Eligible?
- —
Short-term bridge; refi at stabilization.
Rent comps 20 comps
| Address | Beds | Baths | Sqft | Rent | $/sqft | DOM | Units | Dist |
|---|---|---|---|---|---|---|---|---|
| 3008 Carnelian Trl San Antonio, TX | 3.0 | 2.5 | 1189 | $1,195 | $1.01 | 2d | 1 | 0.04mi |
| 2906 Carnelian Trl San Antonio, TX | 3.0 | 2.0 | 1360 | $1,550 | $1.14 | 43d | 1 | 0.04mi |
| 20447 Red Coral San Antonio, TX | 3.0 | 2.0 | 1230 | $1,320 | $1.07 | 23d | 1 | 0.05mi |
| 20356 Andalusite Way San Antonio, TX | 2.0 | 2.5 | 1013 | $1,199 | $1.18 | 17d | 1 | 0.06mi |
| 20448 Red Coral San Antonio, TX | 3.0 | 2.0 | 1129 | $1,500 | $1.33 | 23d | 1 | 0.08mi |
| 20310 Andalusite Way San Antonio, TX | 2.0 | 2.0 | 741 | $1,300 | $1.75 | 43d | 1 | 0.08mi |
| 20305 Andalusite Way San Antonio, TX | 3.0 | 2.5 | 1207 | $1,400 | $1.16 | 16d | 1 | 0.11mi |
| 20305 Andalusite Way San Antonio, TX | 3.0 | 2.5 | 1207 | $1,350 | $1.12 | 43d | 1 | 0.11mi |
| 20618 Andalusite Way San Antonio, TX | 3.0 | 2.0 | 1179 | $1,450 | $1.23 | 4d | 1 | 0.12mi |
| 20642 Andalusite Way San Antonio, TX | 3.0 | 2.5 | 1189 | $1,450 | $1.22 | 21d | 1 | 0.13mi |
| 20511 Andalusite Way San Antonio, TX | 3.0 | 2.5 | 1189 | $1,450 | $1.22 | 17d | 1 | 0.14mi |
| 2807 Ruby Xing San Antonio, TX | 3.0 | 2.0 | 1276 | $1,400 | $1.10 | 23d | 1 | 0.15mi |
| 3230 S Loop 1604 E Unit B1 San Antonio, TX | 2.0 | 1.0 | 768 | $895 | $1.17 | 2d | 1 | 0.43mi |
| 20335 Campbellton Rd San Antonio, TX | 3.0 | 2.0 | 1393 | $1,450 | $1.04 | 43d | 1 | 0.49mi |
| 3230 South Loop 1604 E Unit B03 San Antonio, TX | 2.0 | 2.0 | 896 | $950 | $1.06 | 23d | 1 | 0.52mi |
| 3230 South Loop 1604 E Unit A08 San Antonio, TX | 3.0 | 2.0 | 1216 | $995 | $0.82 | 23d | 1 | 0.52mi |
| 3230 South Loop 1604 E Unit A08 San Antonio, TX | 3.0 | 2.0 | 1216 | $995 | $0.82 | 2d | 1 | 0.52mi |
| 3230 South Loop 1604 E Unit B03 San Antonio, TX | 2.0 | 2.0 | 896 | $950 | $1.06 | 2d | 1 | 0.52mi |
| 20823 Pinon Grv San Antonio, TX | 3.0 | 2.0 | 1403 | $1,650 | $1.18 | 43d | 1 | 1.02mi |
| 19230 FM 1937 #4 San Antonio, TX | 2.0 | 2.0 | 1316 | $1,450 | $1.10 | 23d | 1 | 1.12mi |
Listing history 16 events
-
2026-06-18days on market $169,999 Active 496 DOM
-
2026-06-17days on market $169,999 Active 495 DOM
-
2026-06-16days on market $169,999 Active 494 DOM
-
2026-06-15days on market $169,999 Active 493 DOM
-
2026-06-13days on market $169,999 Active 491 DOM
-
2026-06-13days on market $169,999 Active 490 DOM
-
2026-06-09days on market $169,999 Active 487 DOM
-
2026-06-08days on market $169,999 Active 486 DOM
-
2026-06-07days on market $169,999 Active 485 DOM
-
2026-06-04days on market $169,999 Active 482 DOM
-
2026-06-03days on market $169,999 Active 481 DOM
-
2026-06-02days on market $169,999 Active 480 DOM
-
2026-06-01days on market $169,999 Active 479 DOM
-
2026-05-31days on market $169,999 Active 478 DOM
-
2025-06-30price $169,999 414-char remark
Show marketing remark (414 chars)
This single-level home showcases a spacious open floorplan shared between the kitchen, dining area and family room for easy entertaining during gatherings. An owner's suite enjoys a private location in the back of the home, complemented by an en-suite bathroom, walk-in closet and direct access to the backyard space. There are two secondary bedrooms that are both ideal for household members and overnight guests.
-
2025-02-08$179,999 Active 414-char remark
Show marketing remark (414 chars)
This single-level home showcases a spacious open floorplan shared between the kitchen, dining area and family room for easy entertaining during gatherings. An owner's suite enjoys a private location in the back of the home, complemented by an en-suite bathroom, walk-in closet and direct access to the backyard space. There are two secondary bedrooms that are both ideal for household members and overnight guests.
ⓘ Source: listings_history table (triggers on properties + properties_extension) + one-shot
backfill from property_details.listing_events for pre-trigger history.
Nearby sold comps map
Loading sold comps map…
Walkable amenities ~0.75 mi
Loading nearby amenities…
Taxation est. · year 1
- Rental income
- $16,119
- − Mortgage interest
- −$9,311
- − Property taxes
- −$2,493
- − Insurance
- −$831
- − Repairs & maintenance
- −$1,290
- − Management
- −$1,290
- − Depreciation
- −$4,836
- Taxable loss
- −$3,931
- Est. tax savings @ 24.0%
- +$944
- After-tax cash flow
- $-107/yr
For passive investors: Depreciation is non-cash, so a rental often shows a tax loss while cash-flowing — sheltering income. Rental losses are passive: they offset passive income freely, and up to $25,000/yr can offset ordinary (W-2) income if you actively participate and your MAGI is under $100k (phasing out to $0 by $150k); unused losses carry forward. On sale, claimed depreciation is recaptured at up to 25%, and gains may owe capital-gains tax (a 1031 exchange can defer both). Figures are a year-1 estimate at your 24.0% rate — not tax advice; consult a CPA.
Schools (NCES district)
- District
- Southside ISD
- NCES district ID
- 4840920
- Math proficiency
- 16% ▼ -15.00%
- Reading proficiency
- 25% ▼ -2.00%
- Median HH income
- $43,526
- Composite
- 17.68/100
- National rank
- #9027
- State rank
- #771 of 826 in TX
Livability — San Antonio
- Score
- 80/100
- State rank
- #31
- US rank
- #1616
Category grades
Schools grade is shown separately in the Schools card above.
Census & demographics
- City population
- 1,806,925
- Population (ZIP)
- 11,702
Population outlook (Bexar County) Hauer SSP2
- Today (2025)
- 2,336,851 people
- By 2030
- 2,560,728 · +9.6%
- By 2040
- 3,020,569 · +29.3%
- By 2050
- 3,493,522 · +49.5%
- By 2075
- 4,668,459 · +99.8%
- By 2100
- 5,533,242 · +136.8%
Race, ethnicity, and origin ACS 2023
- Neighborhood character
- Predominantly Hispanic (80%)
- Race & ethnicity
- Hispanic / Latino 80% Two or more races 35% White 17% Black 2% Native American 1%
- Hispanic origin (detail)
- Mexican 73%
- Common ancestry
- Lithuanian 1% Serbian 1% Greek 1%
- Foreign-born
- 14% · Canada
- Languages at home
- 48% English-only · Spanish 51% Tagalog/Filipino 0%
Political lean MEDSL · Bexar
- 2024 margin
- Lean D (+9.8) · D 54.3% · R 44.6% · Other 1.1%
- 2008→2024 swing
- +4.2pp toward D · 2008: 5.6pp · 2024: 9.8pp
- All cycles
- 2024: D+9.8 2020: D+18.2 2016: D+13.5 2012: D+4.6 2008: D+5.6
Not yet ingested
- Civics
- —
Market trends
- HPI YoY
- ▲ 3.94%
- Current HPI
- 298.8446
- Rent YoY
- —
- Metro
- —
- State GDP YoY
- ▲ 3.95%
- F500 in state
- 110
Industry mix (Fortune 500 HQ in TX)
| Industry | F500 HQs | Revenue |
|---|---|---|
| Energy | 16 | $1,198B |
|
||
| Technology | 5 | $198B |
|
||
| Engineering / Construction | 4 | $72B |
|
||
| Energy Services | 3 | $60B |
|
||
| Utilities | 3 | $41B |
|
||
| Healthcare | 2 | $330B |
|
||
Price history
-5.6% since first listed2 events — show timeline
- 2025-06-30 Price Changed $169,999 Zillow
- 2025-02-08 Listed $179,999 Zillow
Cash-flow waterfall
monthlySold comps — $/sqft
last 12 mo · ≤1 miLoading sold comps…