 🏗️ New Construction
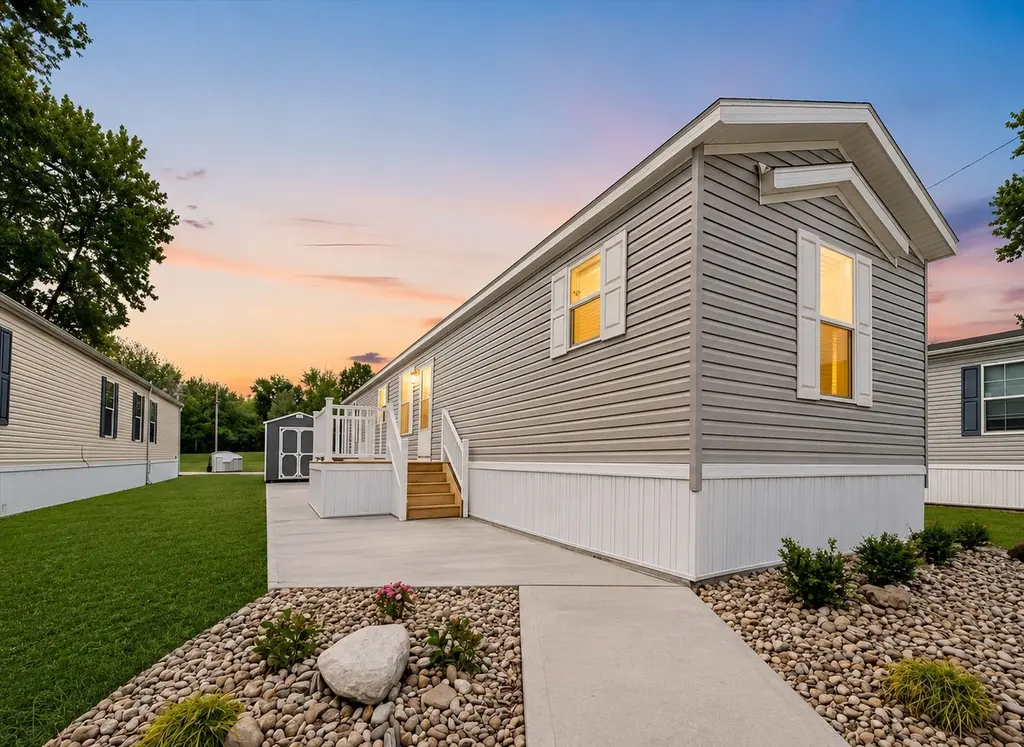
Clayton 453 Catalina Plan · Middletown, OH
Flood risk No data
- FEMA flood zone
- —
- Chance of flooding over 30 yrs
- —
- Est. flood insurance / yr
- —
Fire risk No data
- Est. fire insurance / yr
- —
Heat risk No data
- Hot days now (above threshold)
- —
- Hot days in 30 yrs
- —
Wind risk No data
- Chance of severe wind over 30 yrs
- —
Air-quality risk No data
- Unhealthy air days now
- —
- Unhealthy air days in 30 yrs
- —
Risk factors via First Street. Map © Google.
Why this score? — see what drove the C+ grade
The composite is a weighted blend of 9 inputs, each scored 0–100. Each bar is that input's sub-score; the figure is the points it added to the 100-point composite (weight × sub-score).
- Cash flow +25.7/30.0
- DSCR +8.6/10.0
- ARV discount +7.5/15.0
- 1% rule +6.8/10.0
- Schools +5.2/10.0
- Condition / age +4.0/5.0
- Livability +3.6/5.0
- Rent growth +2.5/5.0
- Appreciation +0.0/10.0
$105,100
🖨 Deal sheet 📄 Offer letter ✓ Due diligence
Listing remarks
If you're looking for a friendly and relaxing atmosphere, we invite you to see the homes at Catalina Community in Middletown, Ohio. Brought to you by UMH Properties, the homes at Catalina range from 2 to 3-bedrooms and 2-bathrooms and are built for your modern lifestyle. The floor plans in this manufactured home community include open-concepts with large eat-in kitchens, and plenty of cabinet and countertop space. Our community offers high end amenities which are free for all of our community residents to use. Enjoy sunbathing by the pool, taking the kids to the playground, or having a burger with a neighbor during our summer cookouts. Catalina community in Middletown, OH, is located 30 min
Key facts
- High end amenities
- Country setting
- Listed 41 days
Tags
Property features AI
Finance
- Other: Address: Middletown, OH 45042 (Clayton 453 Catalina Plan)
- Financial info: Listing price $105,100
Exterior
- Utilities: Central air conditioning
- Home design: New construction plan: Clayton 453 Catalina; Single-family property (plan)
- Construction: Living area approximately 1,120; Shake roof
- Exterior features: Shake roof
Interior
- Bedrooms: 3 bedrooms
- Bathrooms: 2 full bathrooms
- Heating & cooling: Central air
- Interior features: Central air conditioning
Neighborhood map
What this means for you Summary
Snapshot
- This is a 3-bed/2.0-bath manufactured listed at $105k. Condition is rated good.
Deal economics
- At list price, monthly cash flow is $251 ($3k/yr) — positive.
- The deal already cash-flows at list — no discount required.
- Meets the 1% rule at list price ($1k rent vs $105k).
- Recommended offer: $102k (3.0% below list) — sets the bar for market timing.
- Cap rate 9.2% vs local median 4.5% in Middletown — top-decile yield for the area; either an underpriced asset or a hidden risk that comps aren't pricing in. Stress-test before assuming the spread holds.
Location & tenants
- Location reads 72/100 on livability (#389 in OH) — a middle-class / working-renter tenant base. Strengths: cost of living A+, housing A+, health & safety A+; Watch: schools D+, crime D+, amenities D+.
- Madison Local (rural): math 59% / reading 61% proficiency, ranked #274 of 656 in OH (top 42%) — acceptable for families but not a draw, mixed tenant base, ~2y average lease.
- Market conditions: 71 active listings in the ZIP; 3 comparable units currently listed for rent nearby; rentals at typical pace (median 15d on market — plan ~3-4 weeks tenant-placement turnaround); 1,163 units permitted in Butler County in 2024 (356 in 5+ unit buildings).
Forward outlook
- Local home prices are declining (-3.0%/yr); year-one equity from $727 of loan paydown is wiped out by about $3k of value loss. Plan a longer hold.
Negotiation context
- It's been on market 41 days — a 3% lower offer ($102k) is reasonable based on typical stale-listing flexibility.
Questions for the listing agent
- It's been on market 41 days. Have you received any prior offers? Is the seller open to a 3% concession, seller financing, or rate buy-down credit?
- Is there a deadline driving the sale (1031 exchange, divorce, estate, relocation)? That informs how much negotiation room exists.
- Schools are D-rated, which usually means shorter tenancies and higher turnover. Who's the typical renter profile here, and what's been the actual vacancy rate?
- Crime grade is D in this area — have there been break-ins, vandalism, or insurance claims at this property in the last 3 years? What carrier currently insures it and at what premium?
- What's the average days-on-market for RENTAL listings here right now (not sales)? A rising rental-DOM trend means longer vacancies and softer asking-rent achievability than the comps imply.
- What's the recent tenant-quality profile in this submarket — average credit score on applications, eviction rate, late-payment / NSF rate, and stable-employment percentage? A property-management company in the area should have these aggregated.
- How much new for-sale + rental construction is in the pipeline within 1–3 miles? Heavy new supply typically softens prices + rents 12–24 months out; constrained supply supports both.
Investment metrics
- 1% rule
- 1.18% ✓
- Cap rate
- 9.16%
- Cash-on-cash
- 10.25%
- DSCR
- 1.46
- GRM
- 7.1
CMA / ARV
No comps found within radius.
Projected returns pro-forma
-3.0% appreciation · 3.0% rent growth · sell at horizon
- IRR
- -0.9%
- Equity multiple
- 0.97×
- Total profit
- $-1,004
- Equity at exit
- $15,671
- IRR
- 8.8%
- Equity multiple
- 1.67×
- Total profit
- $19,814
- Equity at exit
- $9,087
Cash invested: $29,428 (down + closing). Projections, not guarantees.
Landlord ↔ Tenant lean methodology
- Overall (STATE)
- 73 Landlord-Friendly
- State Ohio
- 73 Landlord-Friendly · R+6
- County
- — inherits STATE
- City
- — inherits STATE
ZIP-level market 45042
- Active inventory
- 71
- Price-to-rent
- 7.1×
Monthly cashflow live
- Estimated rent
- $1,238 medium interval (Pro) →
- Mortgage (P&I)
- −$551
- Tax est. 1.5%
- −$131 /mo · $1,576/yr
- Insurance
- −$44
- HOA
- −$0
- Vacancy / Maint / Mgmt
- −$260
- Net cashflow
- $251
Break-even live
UW: 25.0% down · 7.5% · 30yr · 1.5% tax · 5.0% vac · 8.0% maint · 8.0% mgmt
Financing live
Cash to close
- Down payment
- $26,275
- Closing costs
- $3,153
- Reserves months
- —
- Total cash needed
- —
Loan-product check · same deal, 3 products live
Conventional
25% down · 7.5% · 30yr
- Down + closing
- —
- Monthly P&I
- —
- Monthly cashflow
- —
- DSCR
- —
- Eligible?
- —
Personal DTI + credit; lowest rate.
DSCR
20% down · 8.5% · 30yr
- Down + closing
- —
- Monthly P&I
- —
- Monthly cashflow
- —
- DSCR
- —
- Eligible?
- —
No personal income docs; deal must DSCR.
Hard money
10% down · 12.0% · 12mo
- Down + closing
- —
- Monthly P&I
- —
- Monthly cashflow
- —
- DSCR
- —
- Eligible?
- —
Short-term bridge; refi at stabilization.
Rent comps 3 comps
| Address | Beds | Baths | Sqft | Rent | $/sqft | DOM | Units | Dist |
|---|---|---|---|---|---|---|---|---|
| 6501 Germantown Rd Middletown, OH | 2.0–3.0 | 2.0 | 1184 | $1,100 | $0.93 | 1d | 1 | 0.02mi |
| 2513 Aspen St Unit 2513A Middletown, OH | 3.0 | 2.0 | 1056 | $1,150 | $1.09 | 14d | 1 | 1.11mi |
| 2002 Huntington St Unit 2002H Middletown, OH | 3.0 | 2.0 | 1216 | $1,200 | $0.99 | 19d | 1 | 1.29mi |
Listing history 15 events
-
2026-06-19days on market $105,100 Active 41 DOM
-
2026-06-18days on market $105,100 Active 40 DOM
-
2026-06-17days on market $105,100 Active 39 DOM
-
2026-06-16days on market $105,100 Active 38 DOM
-
2026-06-15days on market $105,100 Active 37 DOM
-
2026-06-14days on market $105,100 Active 35 DOM
-
2026-06-12days on market $105,100 Active 34 DOM
-
2026-06-09days on market $105,100 Active 31 DOM
-
2026-06-08days on market $105,100 Active 30 DOM
-
2026-06-07days on market $105,100 Active 29 DOM
-
2026-06-03days on market $105,100 Active 25 DOM
-
2026-06-02days on market $105,100 Active 24 DOM
-
2026-06-01days on market $105,100 Active 23 DOM
-
2026-05-31days on market $105,100 Active 22 DOM
-
2026-05-30days on market $105,100 Active 21 DOM
ⓘ Source: listings_history table (triggers on properties + properties_extension) + one-shot
backfill from property_details.listing_events for pre-trigger history.
Nearby sold comps map
Loading sold comps map…
Walkable amenities ~0.75 mi
Loading nearby amenities…
Taxation est. · year 1
- Rental income
- $14,850
- − Mortgage interest
- −$5,887
- − Property taxes
- −$1,576
- − Insurance
- −$526
- − Repairs & maintenance
- −$1,188
- − Management
- −$1,188
- − Depreciation
- −$3,057
- Taxable income
- $1,428
- Est. tax owed @ 24.0%
- −$343
- After-tax cash flow
- $2,673/yr
For passive investors: Depreciation is non-cash, so a rental often shows a tax loss while cash-flowing — sheltering income. Rental losses are passive: they offset passive income freely, and up to $25,000/yr can offset ordinary (W-2) income if you actively participate and your MAGI is under $100k (phasing out to $0 by $150k); unused losses carry forward. On sale, claimed depreciation is recaptured at up to 25%, and gains may owe capital-gains tax (a 1031 exchange can defer both). Figures are a year-1 estimate at your 24.0% rate — not tax advice; consult a CPA.
Condition & rehab AI · 6 photos
This manufactured home is in good condition with a good condition score of 80. It has a cosmetic rehab level and requires minor maintenance and some updates to increase its value. The home is move-in ready and has a friendly and relaxing atmosphere.
Value-add opportunities
- Both Paint exterior siding — Enhances curb appeal and can increase both resale and rental value.
- Both Replace worn-out flooring — New flooring can improve the home's appearance and increase its value.
- Both Update kitchen appliances — Modern appliances can attract more buyers and renters.
- Both Install smart home features — Smart home features can increase the home's appeal and value.
- Both Landscaping improvements — Enhances curb appeal and can attract more buyers and renters.
- Both Add a small patio or deck — Can increase the home's livability and appeal to potential buyers and renters.
Renovation cost estimate screening
Value-add ROI direction
- Both Paint exterior siding — Enhances curb appeal and can increase both resale and rental value. ↑
- Both Replace worn-out flooring — New flooring can improve the home's appearance and increase its value. ↑
- Both Update kitchen appliances — Modern appliances can attract more buyers and renters. ↑
- Both Install smart home features — Smart home features can increase the home's appeal and value. ↑
- Both Landscaping improvements — Enhances curb appeal and can attract more buyers and renters. ↑
- Both Add a small patio or deck — Can increase the home's livability and appeal to potential buyers and renters. ↑
ⓘ Cost ranges are severity-bucket heuristics (US national rule-of-thumb). Get contractor quotes + a written scope before underwriting a rehab budget.
Schools (NCES district)
- District
- Madison Local
- NCES district ID
- 3904612
- Math proficiency
- 59% ▼ -13.00%
- Reading proficiency
- 61% ▼ -8.00%
- Median HH income
- $60,069
- Composite
- 52.04/100
- National rank
- #1633
- State rank
- #274 of 656 in OH
Livability — Middletown
- Score
- 72/100
- State rank
- #389
- US rank
- #6338
Category grades
Schools grade is shown separately in the Schools card above.
Census & demographics
- County
- Butler County · 381,674 people
- City population
- 96,117
- Metro
- Cincinnati, OH-KY-IN
- Population (ZIP)
- 27,652
- Household income
- $69,520
- Rent vs Own
- Severe rent burden
- 751.0
Population outlook (Butler County) Hauer SSP2
- Today (2025)
- 387,706 people
- By 2030
- 392,028 · +1.1%
- By 2040
- 395,307 · +2.0%
- By 2050
- 391,116 · +0.9%
- By 2075
- 378,642 · -2.3%
- By 2100
- 343,248 · -11.5%
Race, ethnicity, and origin ACS 2023
- Neighborhood character
- Predominantly White (88%)
- Race & ethnicity
- White 88% Two or more races 5% Black 4% Hispanic / Latino 3%
- Common ancestry
- Slovak 2% Lithuanian 2% Italian 1%
- Foreign-born
- 2% · Canada, Jamaica, China
- Languages at home
- 96% English-only · Spanish 2%
Political lean MEDSL · Butler
- 2024 margin
- Strong R (+26.3) · D 36.4% · R 62.7%
- 2008→2024 swing
- -3.6pp toward R · 2008: -22.6pp · 2024: -26.3pp
- All cycles
- 2024: R+26.3 2020: R+24.0 2016: R+28.3 2012: R+26.2 2008: R+22.6
Not yet ingested
- Civics
- —
Market trends
- HPI YoY
- ▼ -169.01%
- Current HPI
- 217.3827
- Rent YoY
- —
- Metro
- Cincinnati, OH-KY-IN
- State GDP YoY
- ▲ 1.98%
- F500 in state
- 48
Industry mix (Fortune 500 HQ in OH)
| Industry | F500 HQs | Revenue |
|---|---|---|
| Insurance | 3 | $145B |
|
||
| Industrial Machinery | 3 | $49B |
|
||
| Financial Services | 3 | $24B |
|
||
| Consumer Goods | 2 | $93B |
|
||
| Aerospace / Defense | 2 | $47B |
|
||
| Utilities | 2 | $33B |
|
||
Cash-flow waterfall
monthlySold comps — $/sqft
last 12 mo · ≤1 miLoading sold comps…