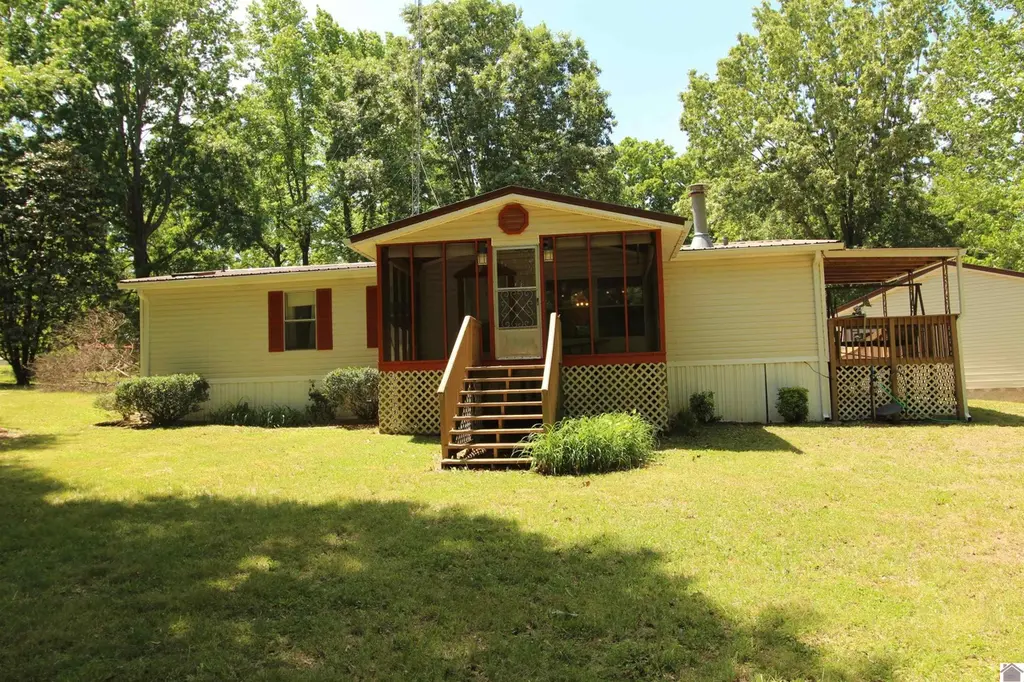
372 Saratoga Heights Rd · Eddyville, KY
Flood risk 1/10 · Minimal
- FEMA flood zone
- X (unshaded)
- Chance of flooding over 30 yrs
- 0.0%
- Est. flood insurance / yr
- $507 – $1,088
Fire risk 2/10 · Minimal
- Est. fire insurance / yr
- $839 – $1,559
Heat risk 5/10 · Moderate
- Hot days now (above 109°F)
- 7 days/yr
- Hot days in 30 yrs
- 19 days/yr
Wind risk 3/10 · Minor
- Chance of severe wind over 30 yrs
- 7.0%
Air-quality risk 1/10 · Minimal
- Unhealthy air days now
- 0 days/yr
- Unhealthy air days in 30 yrs
- 0 days/yr
Risk factors via First Street. Map © Google.
Why this score? — see what drove the B+ grade
The composite is a weighted blend of 9 inputs, each scored 0–100. Each bar is that input's sub-score; the figure is the points it added to the 100-point composite (weight × sub-score).
- Cash flow +30.0/30.0
- ARV discount +15.0/15.0
- DSCR +10.0/10.0
- 1% rule +8.7/10.0
- Schools +4.1/10.0
- Livability +3.5/5.0
- Rent growth +2.5/5.0
- Condition / age +2.5/5.0
- Appreciation +0.0/10.0
$199,900
🖨 Deal sheet (PDF) 📄 Offer letter ✓ Due diligence
Listing remarks
Set on 1.5+/- peaceful acres with seasonal lake views, this well-maintained 2000 model manufactured home offers the perfect blend of comfort, space, and tranquility. This 3-bedroom, 2-bath home features a roomy interior ideal for both relaxing weekends and everyday living. A brand-new metal roof and durable 6-inch gutters add long-term value and peace of mind. The home has also been equipped with piers and tie downs for extra security. The property also includes a spacious two-car garage with additional attic storage, providing plenty of room for tools, hobbies, or outdoor gear. Located in a quiet neighborhood, about a mile from Coleman bridge boat ramp, this home is an excellent choice for
Key facts
- Seasonal lake views
- Brand-new metal roof
- Quiet neighborhood
Tags
Property features AI
Exterior
- Parking: Detached 2-car garage with garage door opener
- Utilities: Public water; Septic tank
- Home design: Manufactured home; Single-story
- Construction: Metal siding; Metal roof
- Exterior features: Covered patio/porch; Deck; Wooded lot; Gravel road access
Interior
- Kitchen: Dishwasher; Microwave; Cooktop; Refrigerator; Electric water heater
- Flooring: Laminate
- Bathrooms: 2 full bathrooms
- Heating & cooling: Electric heating; Central air; Ceiling fans
- Interior features: Accessible entrance
- Laundry & utility: Dryer
Neighborhood map
What this means for you Summary
Snapshot
- This is a 3-bed/2.0-bath manufactured listed at $200k.
Deal economics
- At list price, monthly cash flow is $915 ($11k/yr) — positive.
- The deal already cash-flows at list — no discount required.
- Meets the 1% rule at list price ($3k rent vs $200k).
- Recommended offer: $194k (3.0% below list) — sets the bar for market timing.
- Cap rate 11.8% vs local median 3.5% in Eddyville — top-decile yield for the area; either an underpriced asset or a hidden risk that comps aren't pricing in. Stress-test before assuming the spread holds.
Location & tenants
- Location reads 69/100 on livability (#174 in KY) — a middle-class / working-renter tenant base. Strengths: crime A+, cost of living A+, housing A; Watch: amenities F, commute F, employment F.
- Lyon County (rural): math 45% / reading 52% proficiency, ranked #13 of 165 in KY (top 8%) — families likely to look elsewhere, expect single-tenant / working-renter base with shorter leases.
- Zoned schools: Lyon County Elementary School (math 42% / reading 57%, grade D, #100 of 676 statewide, top 16%, 457 students, 58% FRL); Lyon County Middle School (math 51% / reading 54%, grade C+, #16 of 217 statewide, top 7%, 243 students, 51% FRL); Lyon County High School (math 32% / reading 37%, grade F, #76 of 254 statewide, top 34%, 298 students, 46% FRL).
- Market conditions: 118 active listings in the ZIP; 3 units permitted in Lyon County in 2024 (0 in 5+ unit buildings).
Forward outlook
- Local home prices are declining (-3.0%/yr); year-one equity from $1k of loan paydown is wiped out by about $6k of value loss. Plan a longer hold.
- Lyon County population projected to shrink 3% by 2050 — rents likely to lag national; underwrite the cash flow, not the appreciation.
- At projected returns (-3.0% appreciation + 3.0% rent growth), your $56k cash investment doubles in ~7 years — after that, you're playing with house money.
Negotiation context
- It's been on market 50 days — a 3% lower offer ($194k) is reasonable based on typical stale-listing flexibility.
- 3 sale attempts since 2y ago with the ask held roughly flat each time — persistent listings suggest the price (not the market) is what's stuck; bring a comps-based counter.
Risks & watch-outs
- Climate carrying-cost: extreme-heat days projected 7→19/yr by 2055 (HVAC capex compounding) — expect insurance premiums to compound above CPI over the hold.
Questions for the listing agent
- It's been on market 50 days. Have you received any prior offers? Is the seller open to a 3% concession, seller financing, or rate buy-down credit?
- Is there a deadline driving the sale (1031 exchange, divorce, estate, relocation)? That informs how much negotiation room exists.
- Schools are D-rated, which usually means shorter tenancies and higher turnover. Who's the typical renter profile here, and what's been the actual vacancy rate?
- What's the average days-on-market for RENTAL listings here right now (not sales)? A rising rental-DOM trend means longer vacancies and softer asking-rent achievability than the comps imply.
- What's the recent tenant-quality profile in this submarket — average credit score on applications, eviction rate, late-payment / NSF rate, and stable-employment percentage? A property-management company in the area should have these aggregated.
- How much new for-sale + rental construction is in the pipeline within 1–3 miles? Heavy new supply typically softens prices + rents 12–24 months out; constrained supply supports both.
Investment metrics
- 1% rule
- 1.37% ✓
- Cap rate
- 11.79%
- Cash-on-cash
- 19.62%
- DSCR
- 1.87
- GRM
- 6.1
CMA / ARV
- ARV (median comp)
- $250,323
- List price
- $199,900
- Delta
- -20.14%
- Verdict
- UNDERPRICED
- Comps
- 1 within 2.0 mi
Projected returns pro-forma
-3.0% appreciation · 3.0% rent growth · sell at horizon
- IRR
- 11.6%
- Equity multiple
- 1.46×
- Total profit
- $25,840
- Equity at exit
- $29,806
- IRR
- 20.6%
- Equity multiple
- 2.74×
- Total profit
- $97,360
- Equity at exit
- $17,284
Cash invested: $55,972 (down + closing). Projections, not guarantees.
Landlord ↔ Tenant lean methodology
- Overall (STATE)
- 83 Strongly Landlord-Friendly
- State Kentucky
- 83 Strongly Landlord-Friendly · R+16
- County
- — inherits STATE
- City
- — inherits STATE
ZIP-level market 42038
- Home prices YoY
- -30.7%
- Active inventory
- 118
- Price-to-rent
- 6.1×
Monthly cashflow live
- Estimated rent
- $2,729 medium interval (Pro) →
- Mortgage (P&I)
- −$1,048
- Tax from tax record
- −$109 /mo · $1,312/yr
- Insurance
- −$83
- HOA
- −$0
- Vacancy / Maint / Mgmt
- −$573
- Net cashflow
- $915
Break-even live
Sensitivity live
| Price | -10% $1,028 | -5% $972 | +0% $915 | +5% $858 | +10% $802 |
|---|---|---|---|---|---|
| Rent | -10% $699 | -5% $807 | +0% $915 | +5% $1,023 | +10% $1,131 |
| Rate | -1.0pp $1,016 | -0.5pp $966 | base $915 | +0.5pp $863 | +1.0pp $811 |
UW: 25.0% down · 7.5% · 30yr · 1.5% tax · 5.0% vac · 8.0% maint · 8.0% mgmt
Financing live
Cash to close
- Down payment
- $49,975
- Closing costs
- $5,997
- Reserves months
- —
- Total cash needed
- —
Loan-product check · same deal, 3 products live
Conventional
25% down · 7.5% · 30yr
- Down + closing
- —
- Monthly P&I
- —
- Monthly cashflow
- —
- DSCR
- —
- Eligible?
- —
Personal DTI + credit; lowest rate.
DSCR
20% down · 8.5% · 30yr
- Down + closing
- —
- Monthly P&I
- —
- Monthly cashflow
- —
- DSCR
- —
- Eligible?
- —
No personal income docs; deal must DSCR.
Hard money
10% down · 12.0% · 12mo
- Down + closing
- —
- Monthly P&I
- —
- Monthly cashflow
- —
- DSCR
- —
- Eligible?
- —
Short-term bridge; refi at stabilization.
Listing history 21 events
-
2026-06-21days on market $199,900 Active 50 DOM
-
2026-06-18days on market $199,900 Active 48 DOM
-
2026-06-17days on market $199,900 Active 47 DOM
-
2026-06-16days on market $199,900 Active 46 DOM
-
2026-06-15days on market $199,900 Active 45 DOM
-
2026-06-13days on market $199,900 Active 43 DOM
-
2026-06-12days on market $199,900 Active 42 DOM
-
2026-06-09days on market $199,900 Active 39 DOM
-
2026-06-08days on market $199,900 Active 38 DOM
-
2026-06-07days on market $199,900 Active 37 DOM
-
2026-06-07days on market $199,900 Active 36 DOM
-
2026-06-04days on market $199,900 Active 33 DOM
-
2026-06-02days on market $199,900 Active 32 DOM
-
2026-06-01days on market $199,900 Active 31 DOM
-
2026-05-31days on market $199,900 Active 30 DOM
-
2026-05-31days on market $199,900 Active 29 DOM
-
2026-05-01$209,500 Active 778-char remark
-
2025-06-25price $179,900
-
2025-04-29price $194,900
-
2025-01-16$199,900 Active
-
2024-07-03$199,000 Active
ⓘ Source: listings_history table (triggers on properties + properties_extension) + one-shot
backfill from property_details.listing_events for pre-trigger history.
Tax reassessment forecast KY · Resets to sale price
- Current annual tax
- $1,312 · $109/mo
- Projected year-2 tax
- $1,719 · $143/mo
- Expected delta
- +$407/yr (+$34/mo · 31.0%)
ⓘ Screening estimate from a state-policy table — verify with the county assessor before closing.
Climate risk First Street
- Flood 1/10 Low FEMA zone X (unshaded) · 0% chance over 30 yrs
- Wildfire 2/10 Low
- Heat 5/10 Major 7 d/yr ≥109°F today · 19 d/yr by 30 yrs out
- Wind 3/10 Moderate 7% chance of damaging wind over 30 yrs
- Air quality 1/10 Low 0 unhealthy d/yr today · 0 by 30 yrs out
Nearby sold comps map
Loading sold comps map…
Walkable amenities ~0.75 mi
Loading nearby amenities…
Taxation est. · year 1
- Rental income
- $32,749
- − Mortgage interest
- −$11,198
- − Property taxes
- −$1,312
- − Insurance
- −$1,000
- − Repairs & maintenance
- −$2,620
- − Management
- −$2,620
- − Depreciation
- −$5,815
- Taxable income
- $8,184
- Est. tax owed @ 24.0%
- −$1,964
- After-tax cash flow
- $9,016/yr
For passive investors: Depreciation is non-cash, so a rental often shows a tax loss while cash-flowing — sheltering income. Rental losses are passive: they offset passive income freely, and up to $25,000/yr can offset ordinary (W-2) income if you actively participate and your MAGI is under $100k (phasing out to $0 by $150k); unused losses carry forward. On sale, claimed depreciation is recaptured at up to 25%, and gains may owe capital-gains tax (a 1031 exchange can defer both). Figures are a year-1 estimate at your 24.0% rate — not tax advice; consult a CPA.
Schools (NCES district)
- District
- Lyon County
- NCES district ID
- 2103690
- Math proficiency
- 45% ▼ -15.00%
- Reading proficiency
- 52% ▼ -13.00%
- Median HH income
- $43,899
- Composite
- 40.94/100
- National rank
- #3607
- State rank
- #13 of 165 in KY
Livability — Eddyville
- Score
- 69/100
- State rank
- #174
- US rank
- #8755
Category grades
Schools grade is shown separately in the Schools card above.
Census & demographics
- Population (ZIP)
- 6,045
Population outlook (Lyon County) Hauer SSP2
- Today (2025)
- 8,330 people
- By 2030
- 8,308 · -0.3%
- By 2040
- 8,196 · -1.6%
- By 2050
- 8,069 · -3.1%
- By 2075
- 8,131 · -2.4%
- By 2100
- 6,856 · -17.7%
Race, ethnicity, and origin ACS 2023
- Neighborhood character
- Predominantly White (87%)
- Race & ethnicity
- White 87% Black 8% Two or more races 3% Hispanic / Latino 1%
- Common ancestry
- Italian 3% Serbian 2% Slovak 1%
- Foreign-born
- 1%
Political lean MEDSL · Lyon
- 2024 margin
- Solid R (+53.4) · D 22.7% · R 76.1% · Other 1.2%
- 2008→2024 swing
- -36.8pp toward R · 2008: -16.7pp · 2024: -53.4pp
- All cycles
- 2024: R+53.4 2020: R+47.5 2016: R+44.0 2012: R+27.1 2008: R+16.7
Not yet ingested
- Civics
- —
Market trends
- HPI YoY
- ▼ -65.82%
- Current HPI
- 148.5677
- Rent YoY
- —
- Metro
- —
- State GDP YoY
- ▲ 1.81%
- F500 in state
- 4
Industry mix (Fortune 500 HQ in KY)
| Industry | F500 HQs | Revenue |
|---|---|---|
| Healthcare | 1 | $118B |
|
||
| Food / Beverage | 1 | $7B |
|
||
Price history
+0.5% since first listed6 events — show timeline
- 2026-05-29 Price Changed $199,900 WKRMLS
- 2026-05-01 Listed $209,500 WKRMLS
- 2025-06-25 Price Changed $179,900 WKRMLS
- 2025-04-29 Price Changed $194,900 WKRMLS
- 2025-01-16 Listed $199,900 WKRMLS
- 2024-07-03 Listed $199,000 WKRMLS
Property tax history
+6.7%/yrLatest (2025): $1,312 · +23.6% YoY. Source: county tax records.
Cash-flow waterfall
monthlySold comps — $/sqft
last 12 mo · ≤1 miLoading sold comps…