 🏷️ Likely Rental
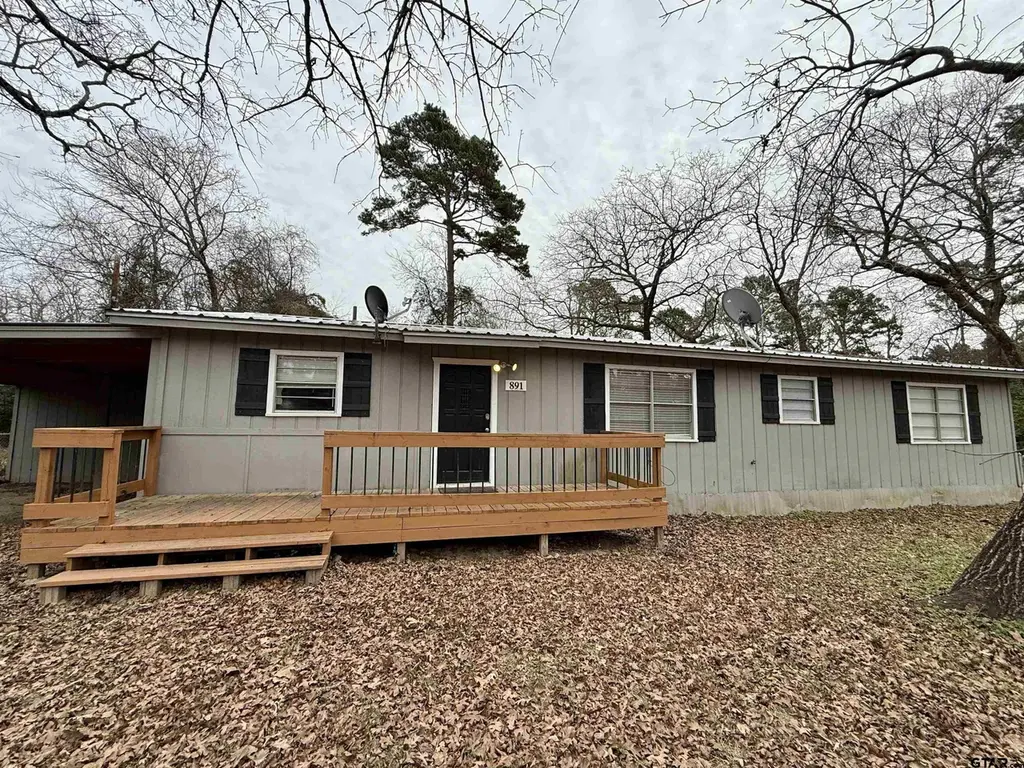
891 Elizabeth · Shadybrook, TX
Flood risk 1/10 · Minimal
- FEMA flood zone
- X (unshaded)
- Chance of flooding over 30 yrs
- 0.0%
- Est. flood insurance / yr
- $507 – $1,088
Fire risk 4/10 · Minor
- Est. fire insurance / yr
- $1,222 – $2,270
Heat risk 6/10 · Moderate
- Hot days now (above 110°F)
- 7 days/yr
- Hot days in 30 yrs
- 25 days/yr
Wind risk 6/10 · Moderate
- Chance of severe wind over 30 yrs
- 68.0%
Air-quality risk 1/10 · Minimal
- Unhealthy air days now
- 0 days/yr
- Unhealthy air days in 30 yrs
- 0 days/yr
Risk factors via First Street. Map © Google.
Why this score? — see what drove the C grade
The composite is a weighted blend of 9 inputs, each scored 0–100. Each bar is that input's sub-score; the figure is the points it added to the 100-point composite (weight × sub-score).
- Cash flow +23.3/30.0
- DSCR +7.5/10.0
- ARV discount +7.5/15.0
- 1% rule +7.3/10.0
- Schools +5.4/10.0
- Livability +3.0/5.0
- Rent growth +2.5/5.0
- Condition / age +2.5/5.0
- Appreciation +0.0/10.0
$134,500
🖨 Deal sheet 📄 Offer letter ✓ Due diligence
Listing remarks
INVESTOR SPECIAL, TENANT OCCUPIED. If you are an investor looking for a turnkey occupied property consider this rental in BULLARD ISD. This property is on a double lot with lots of backyard space including a large fenced back yard, storage building with power, and a fire pit. This is in a gated community with access to Lake Palestine (Shadybrook), and community amenities include swimming pools, park and private boat ramp. Home features an open concept kitchen/dining/living space. Kitchen has SS appliances including landlord owned refrigerator and microwave. Updates include HVAC (new in 2020), metal roof (new in 2021), septic (new in 2022), vinyl plank flooring and keyless locks. Seller wil
Key facts
- Community pool
- Built 1978
- Listed 44 days
Property features AI
Finance
- HOA & community: Homeowners association (annual fee); HOA fee $276 annually (about $23/month); Gated community; Community pool
Exterior
- Security: Smoke detector(s)
- Utilities: Septic tank
- Home design: Single family detached residence; Single-story
- Construction: Aluminum/metal roof
- Exterior features: Deck; Porch; Chain link fencing; Lake frontage (Lake Palestine); Storage building/area
Interior
- Kitchen: Dishwasher; Electric oven; Electric range; Refrigerator; Microwave; Garbage disposal; Electric water heater
- Flooring: Vinyl flooring
- Bathrooms: 2 full bathrooms
- Heating & cooling: Central heating (electric); Central air conditioning
- Interior features: Breakfast bar; Walk-in closet(s)
Neighborhood map
What this means for you Summary
Snapshot
- This is a 3-bed/4.0-bath single-family listed at $134k.
Deal economics
- At list price, monthly cash flow is $247 ($3k/yr) — positive.
- The deal already cash-flows at list — no discount required.
- Meets the 1% rule at list price ($2k rent vs $134k).
- Recommended offer: $130k (3.0% below list) — sets the bar for market timing.
- Cap rate 8.5% vs local median 4.0% in Shadybrook — top-decile yield for the area; either an underpriced asset or a hidden risk that comps aren't pricing in. Stress-test before assuming the spread holds.
Location & tenants
- Location reads 60/100 on livability (#1,042 in TX) — a middle-class / working-renter tenant base. Strengths: cost of living A+, crime A-; Watch: amenities F, commute F, health & safety D-.
- Bullard ISD (rural): math 65% / reading 60% proficiency, ranked #48 of 826 in TX (top 6%) — acceptable for families but not a draw, mixed tenant base, ~2y average lease.
- Zoned schools: Bullard El (math 61% / reading 61%, grade B, #368 of 4,322 statewide, top 9%, 434 students, 36% FRL); Bullard Int (math 66% / reading 50%, grade B, #197 of 1,662 statewide, top 12%, 435 students, 26% FRL); Bullard H S (math 57% / reading 68%, grade B-, #234 of 1,632 statewide, top 14%, 848 students, 25% FRL).
- Market conditions: 581 active listings in the ZIP; 2 comparable units currently listed for rent nearby; 39 units permitted in Cherokee County in 2024 (0 in 5+ unit buildings).
Forward outlook
- Local home prices are declining (-3.0%/yr); year-one equity from $930 of loan paydown is wiped out by about $4k of value loss. Plan a longer hold.
Negotiation context
- It's been on market 45 days — a 3% lower offer ($130k) is reasonable based on typical stale-listing flexibility.
Risks & watch-outs
- Climate carrying-cost: major wind risk, 68% chance of damaging wind over 30y; extreme-heat days projected 7→25/yr by 2055 (HVAC capex compounding) — expect insurance premiums to compound above CPI over the hold.
Questions for the listing agent
- It's been on market 45 days. Have you received any prior offers? Is the seller open to a 3% concession, seller financing, or rate buy-down credit?
- Built in 1978 — when were the roof, HVAC, electrical panel, plumbing, and water heater last replaced?
- What does the HOA fee cover, when was the last increase, and are there any pending special assessments or reserve-fund shortfalls?
- Is there a deadline driving the sale (1031 exchange, divorce, estate, relocation)? That informs how much negotiation room exists.
- Schools are F-rated, which usually means shorter tenancies and higher turnover. Who's the typical renter profile here, and what's been the actual vacancy rate?
- What's the average days-on-market for RENTAL listings here right now (not sales)? A rising rental-DOM trend means longer vacancies and softer asking-rent achievability than the comps imply.
- What's the recent tenant-quality profile in this submarket — average credit score on applications, eviction rate, late-payment / NSF rate, and stable-employment percentage? A property-management company in the area should have these aggregated.
- How much new for-sale + rental construction is in the pipeline within 1–3 miles? Heavy new supply typically softens prices + rents 12–24 months out; constrained supply supports both.
Investment metrics
- 1% rule
- 1.23% ✓
- Cap rate
- 8.49%
- Cash-on-cash
- 7.86%
- DSCR
- 1.35
- GRM
- 6.8
CMA / ARV
- ARV (median comp)
- $416,939
- List price
- $134,500
- Delta
- -67.74%
- Verdict
- UNDERPRICED
- Comps
- 11 within 1.0 mi
Show comp detail 2 sales within ~0.75 mi
| Address | Dist | Beds/Ba | Sqft | Sold | Price | $/sf | Match |
|---|---|---|---|---|---|---|---|
| 919 Eastdale Ln | 0.73mi | 3/2.0 | 1,741 (+4%) | 14mo | $424,900 | $244 | 40 |
| 688 Charlya Dr | 0.49mi | 3/2.0 | 1,918 (+14%) | 20mo | $575,000 | $300 | 29 |
Match score weights: distance 35% · size 25% · config 20% · recency 20%. Top-matched comps best support the ARV.
Projected returns pro-forma
-3.0% appreciation · 3.0% rent growth · sell at horizon
- IRR
- -4.2%
- Equity multiple
- 0.84×
- Total profit
- $-5,976
- Equity at exit
- $20,054
- IRR
- 5.5%
- Equity multiple
- 1.41×
- Total profit
- $15,452
- Equity at exit
- $11,629
Cash invested: $37,660 (down + closing). Projections, not guarantees.
Landlord ↔ Tenant lean methodology
- Overall (STATE)
- 87 Strongly Landlord-Friendly
- State Texas
- 87 Strongly Landlord-Friendly · R+5
- County
- — inherits STATE
- City
- — inherits STATE
ZIP-level market 75757
- Home prices YoY
- -23.6%
- Active inventory
- 581
- Price-to-rent
- 6.8×
Monthly cashflow live
- Estimated rent
- $1,650 medium interval (Pro) →
- Mortgage (P&I)
- −$705
- Tax from tax record
- −$272 /mo · $3,268/yr
- Insurance
- −$56
- HOA
- −$23
- Vacancy / Maint / Mgmt
- −$346
- Net cashflow
- $247
Break-even live
UW: 25.0% down · 7.5% · 30yr · 1.5% tax · 5.0% vac · 8.0% maint · 8.0% mgmt
Financing live
Cash to close
- Down payment
- $33,625
- Closing costs
- $4,035
- Reserves months
- —
- Total cash needed
- —
Loan-product check · same deal, 3 products live
Conventional
25% down · 7.5% · 30yr
- Down + closing
- —
- Monthly P&I
- —
- Monthly cashflow
- —
- DSCR
- —
- Eligible?
- —
Personal DTI + credit; lowest rate.
DSCR
20% down · 8.5% · 30yr
- Down + closing
- —
- Monthly P&I
- —
- Monthly cashflow
- —
- DSCR
- —
- Eligible?
- —
No personal income docs; deal must DSCR.
Hard money
10% down · 12.0% · 12mo
- Down + closing
- —
- Monthly P&I
- —
- Monthly cashflow
- —
- DSCR
- —
- Eligible?
- —
Short-term bridge; refi at stabilization.
Rent comps 2 comps
| Address | Beds | Baths | Sqft | Rent | $/sqft | DOM | Units | Dist |
|---|---|---|---|---|---|---|---|---|
| 124 Pecan Dr Bullard, TX | 3.0 | 2.0 | 1366 | $1,650 | $1.21 | 44d | 1 | 1.10mi |
| 394 Red Bud Cir Bullard, TX | 3.0 | 2.0 | 1350 | $1,650 | $1.22 | 44d | 1 | 1.42mi |
HOA detail
- Monthly dues
- $23 · $276/yr
- Likely covers
- poolsecurity
Listing history 18 events
-
2026-06-19days on market $134,500 Active 45 DOM
-
2026-06-18days on market $134,500 Active 44 DOM
-
2026-06-17days on market $134,500 Active 43 DOM
-
2026-06-16pricedays on market $134,500 Active 42 DOM
-
2026-06-15days on market $139,500 Active 41 DOM
-
2026-06-14days on market $139,500 Active 39 DOM
-
2026-06-13days on market $139,500 Active 38 DOM
-
2026-06-10days on market $139,500 Active 36 DOM
-
2026-06-09days on market $139,500 Active 35 DOM
-
2026-06-08days on market $139,500 Active 34 DOM
-
2026-06-07days on market $139,500 Active 33 DOM
-
2026-06-03days on market $139,500 Active 29 DOM
-
2026-06-02days on market $139,500 Active 28 DOM
-
2026-06-01days on market $139,500 Active 27 DOM
-
2026-05-31days on market $139,500 Active 26 DOM
-
2026-05-30days on market $139,500 Active 25 DOM
-
2026-05-05$139,500 Active 839-char remark
-
2020-08-31soldstatus
ⓘ Source: listings_history table (triggers on properties + properties_extension) + one-shot
backfill from property_details.listing_events for pre-trigger history.
Tax reassessment forecast TX · Resets to sale price
- Current annual tax
- $3,268 · $272/mo
- Projected year-2 tax
- $3,268 · $272/mo
- Expected delta
- $0/yr ($0/mo · 0.0%)
ⓘ Screening estimate from a state-policy table — verify with the county assessor before closing.
Climate risk First Street
- Flood 1/10 Low FEMA zone X (unshaded) · 0% chance over 30 yrs
- Wildfire 4/10 Moderate
- Heat 6/10 Major 7 d/yr ≥110°F today · 25 d/yr by 30 yrs out
- Wind 6/10 Major 68% chance of damaging wind over 30 yrs
- Air quality 1/10 Low 0 unhealthy d/yr today · 0 by 30 yrs out
Nearby sold comps map
Loading sold comps map…
Walkable amenities ~0.75 mi
Loading nearby amenities…
Taxation est. · year 1
- Rental income
- $19,800
- − Mortgage interest
- −$7,534
- − Property taxes
- −$3,268
- − Insurance
- −$672
- − Repairs & maintenance
- −$1,584
- − Management
- −$1,584
- − HOA
- −$276
- − Depreciation
- −$3,913
- Taxable income
- $968
- Est. tax owed @ 24.0%
- −$232
- After-tax cash flow
- $2,729/yr
For passive investors: Depreciation is non-cash, so a rental often shows a tax loss while cash-flowing — sheltering income. Rental losses are passive: they offset passive income freely, and up to $25,000/yr can offset ordinary (W-2) income if you actively participate and your MAGI is under $100k (phasing out to $0 by $150k); unused losses carry forward. On sale, claimed depreciation is recaptured at up to 25%, and gains may owe capital-gains tax (a 1031 exchange can defer both). Figures are a year-1 estimate at your 24.0% rate — not tax advice; consult a CPA.
Schools (NCES district)
- District
- Bullard ISD
- NCES district ID
- 4812060
- Math proficiency
- 65% ▼ -2.00%
- Reading proficiency
- 60% ▬ 0.00%
- Median HH income
- $55,026
- Composite
- 53.66/100
- National rank
- #1433
- State rank
- #48 of 826 in TX
Livability — Shadybrook
- Score
- 60/100
- State rank
- #1042
- US rank
- #18541
Category grades
Schools grade is shown separately in the Schools card above.
Census & demographics
- Census place
- Shadybrook, TX
- Population (ZIP)
- 13,977
Population outlook (Cherokee County) Hauer SSP2
- Today (2025)
- 51,949 people
- By 2030
- 51,984 · +0.1%
- By 2040
- 51,780 · -0.3%
- By 2050
- 51,085 · -1.7%
- By 2075
- 47,418 · -8.7%
- By 2100
- 39,464 · -24.0%
Race, ethnicity, and origin ACS 2023
- Neighborhood character
- Predominantly White (80%)
- Race & ethnicity
- White 80% Hispanic / Latino 13% Two or more races 10% Black 2%
- Hispanic origin (detail)
- Mexican 10%
- Common ancestry
- Iranian 5% Italian 4% Slovak 2%
- Foreign-born
- 4% · Canada, Guatemala
- Languages at home
- 92% English-only · Spanish 8%
Political lean MEDSL · Cherokee
- 2024 margin
- Solid R (+62.7) · D 18.3% · R 80.9%
- 2008→2024 swing
- -19.5pp toward R · 2008: -43.2pp · 2024: -62.7pp
- All cycles
- 2024: R+62.7 2020: R+55.8 2016: R+56.5 2012: R+51.0 2008: R+43.2
Not yet ingested
- Civics
- —
Market trends
- HPI YoY
- ▼ -58.57%
- Current HPI
- 189.5215
- Rent YoY
- —
- Metro
- —
- State GDP YoY
- ▲ 3.95%
- F500 in state
- 110
Industry mix (Fortune 500 HQ in TX)
| Industry | F500 HQs | Revenue |
|---|---|---|
| Energy | 16 | $1,198B |
|
||
| Technology | 5 | $198B |
|
||
| Engineering / Construction | 4 | $72B |
|
||
| Energy Services | 3 | $60B |
|
||
| Utilities | 3 | $41B |
|
||
| Healthcare | 2 | $330B |
|
||
Price history
-3.6% since first listed3 events — show timeline
- 2026-06-16 Price Changed $134,500 GTAR
- 2026-05-05 Listed $139,500 GTAR
- 2020-08-31 Sold (Public Records) — Public Records
Property tax history
+55.7%/yrLatest (2025): $3,268 · +3.5% YoY. Source: county tax records.
Cash-flow waterfall
monthlySold comps — $/sqft
last 12 mo · ≤1 miLoading sold comps…