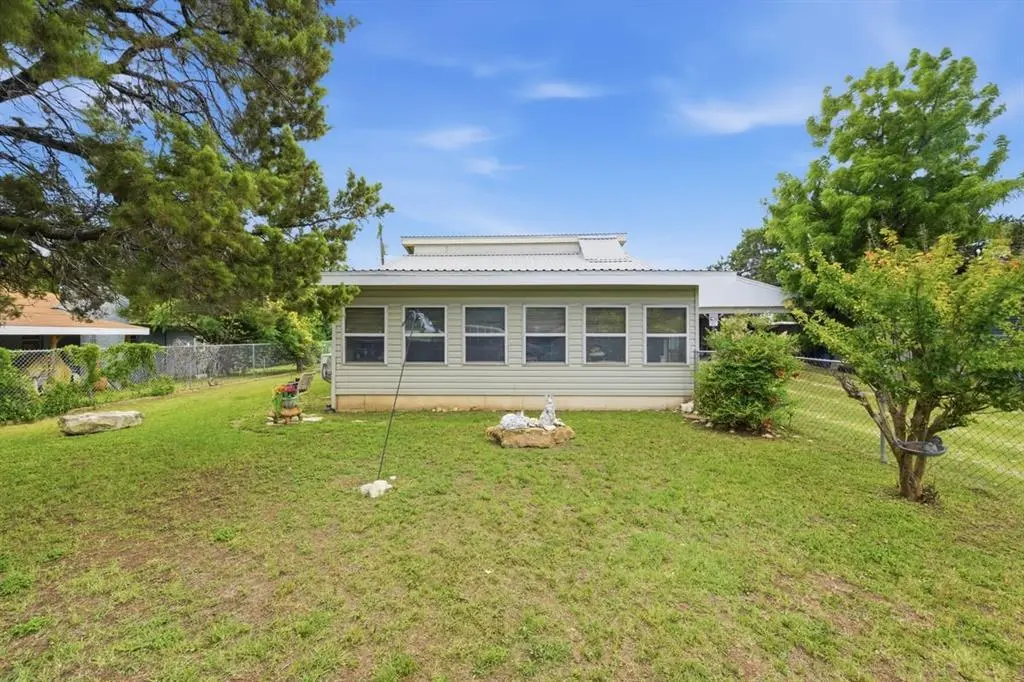
106 Tammi Run Ln · Whitney, TX
Flood risk 1/10 · Minimal
- FEMA flood zone
- X (unshaded)
- Chance of flooding over 30 yrs
- 0.0%
- Est. flood insurance / yr
- $507 – $1,088
Fire risk 4/10 · Minor
- Est. fire insurance / yr
- $1,222 – $2,270
Heat risk 7/10 · Major
- Hot days now (above 109°F)
- 7 days/yr
- Hot days in 30 yrs
- 25 days/yr
Wind risk 6/10 · Moderate
- Chance of severe wind over 30 yrs
- 27.0%
Air-quality risk 2/10 · Minimal
- Unhealthy air days now
- 1 days/yr
- Unhealthy air days in 30 yrs
- 1 days/yr
Risk factors via First Street. Map © Google.
Why this score? — see what drove the D grade
The composite is a weighted blend of 9 inputs, each scored 0–100. Each bar is that input's sub-score; the figure is the points it added to the 100-point composite (weight × sub-score).
- Cash flow +19.9/30.0
- DSCR +6.3/10.0
- 1% rule +5.4/10.0
- Livability +3.6/5.0
- Schools +3.5/10.0
- Rent growth +2.5/5.0
- Condition / age +2.5/5.0
- ARV discount +0.0/15.0
- Appreciation +0.0/10.0
$119,900
🖨 Deal sheet (PDF) 📄 Offer letter ✓ Due diligence
Listing remarks
Opportunity meets location with this unique Lake Whitney property featuring two private living quarters on one lot. The primary residence offers a comfortable and inviting atmosphere with an open floor plan, and a loft bedroom that adds character and functionality to the space. Rich wood details and large windows create a warm, cabin-like feel filled with natural light. A separate detached studio adds even more versatility, complete with its own bedroom, bathroom, and full kitchen setup—perfect for hosting guests, creating a private workspace, or generating income as a vacation rental. The studio is currently leased on a month to month basis generating $500 per month. The studio has h
Key facts
- Covered parking
- Fenced yard
- Detached studio
Tags
Property features AI
Finance
- Financial info: Accepts cash, conventional, FHA, VA loan; eligible for 1031 exchange
- HOA & community: No association
Exterior
- Parking: Covered parking; Carport (2 spaces); Additional driveway parking; Concrete driveway
- Utilities: Co-op electric; Co-op water; Propane
- Home design: Single-family residence; One and one-half story
- Construction: Metal roof; Pillar/post/pier foundation; Built in 1999
- Exterior features: Chain link fencing; Lot less than 0.5 acre; Accessory unit of approximately 200 sq ft
Interior
- Kitchen: Electric cooktop; Electric oven; Microwave; Refrigerator
- Bedrooms: Primary bedroom located on the 2nd level
- Flooring: Wood flooring
- Bathrooms: 1 full bathroom
- Heating & cooling: Electric heating; Propane heating; Electric cooling; Wall/window unit(s)
- Interior features: Open floorplan; Vaulted ceilings; Pantry; Paneling; Cable TV available; Flat screen wiring; High-speed internet available
- Laundry & utility: Washer hookup; Washer included; Electric dryer hookup; Dryer included; Utility room
Neighborhood map
What this means for you Summary
Snapshot
- This is a 1-bed/2.0-bath single-family listed at $120k.
Deal economics
- At list price, monthly cash flow is $144 ($2k/yr) — positive.
- The deal already cash-flows at list — no discount required.
- Meets the 1% rule at list price ($1k rent vs $120k).
- Recommended offer: $118k (1.5% below list) — sets the bar for market timing.
- Cap rate 7.7% vs local median 3.0% in Whitney — top-decile yield for the area; either an underpriced asset or a hidden risk that comps aren't pricing in. Stress-test before assuming the spread holds.
Location & tenants
- Location reads 71/100 on livability (#282 in TX) — a middle-class / working-renter tenant base. Strengths: cost of living A+, housing A+, health & safety A-; Watch: amenities F, commute F, employment D-.
- Whitney ISD (rural): math 42% / reading 41% proficiency, ranked #378 of 826 in TX (top 46%) — families likely to look elsewhere, expect single-tenant / working-renter base with shorter leases.
- Zoned schools: Whitney El (393 students, 74% FRL) — zoned schools average 74% FRL vs 55% district-wide (19 pts higher); higher-poverty schools than district average — tighter screening recommended.
- Market conditions: 644 active listings in the ZIP; 65 units permitted in Hill County in 2024 (0 in 5+ unit buildings).
Forward outlook
- Local home prices are declining (-3.0%/yr); year-one equity from $829 of loan paydown is wiped out by about $4k of value loss. Plan a longer hold.
- Hill County population projected at -12% by 2050 — secular population decline; favor cash flow + early exit over multi-decade hold.
Negotiation context
- It's been on market 23 days — a 2% lower offer ($118k) is reasonable based on typical stale-listing flexibility.
- 5 sale attempts with the ask held roughly flat each time — persistent listings suggest the price (not the market) is what's stuck; bring a comps-based counter.
Risks & watch-outs
- Climate carrying-cost: major wind risk, 27% chance of damaging wind over 30y; extreme-heat days projected 7→25/yr by 2055 (HVAC capex compounding) — expect insurance premiums to compound above CPI over the hold.
Questions for the listing agent
- Is there a deadline driving the sale (1031 exchange, divorce, estate, relocation)? That informs how much negotiation room exists.
- Schools are D-rated, which usually means shorter tenancies and higher turnover. Who's the typical renter profile here, and what's been the actual vacancy rate?
- The area grade is low — what's the realistic commute time and amenity access for the typical tenant pool here? Any planned neighborhood developments (good or bad) we should know about?
- What's the average days-on-market for RENTAL listings here right now (not sales)? A rising rental-DOM trend means longer vacancies and softer asking-rent achievability than the comps imply.
- What's the recent tenant-quality profile in this submarket — average credit score on applications, eviction rate, late-payment / NSF rate, and stable-employment percentage? A property-management company in the area should have these aggregated.
- How much new for-sale + rental construction is in the pipeline within 1–3 miles? Heavy new supply typically softens prices + rents 12–24 months out; constrained supply supports both.
Investment metrics
- 1% rule
- 1.04% ✓
- Cap rate
- 7.74%
- Cash-on-cash
- 5.15%
- DSCR
- 1.23
- GRM
- 8.0
CMA / ARV
- ARV (on-the-fly)
- $101,050
- Comps found
- 3
Show comp detail 3 sales within ~0.75 mi
| Address | Dist | Beds/Ba | Sqft | Sold | Price | $/sf | Match |
|---|---|---|---|---|---|---|---|
| 183 Linda Lee Xing | 0.23mi | 1/1.5 | 1,064 (-9%) | 5mo | $74,999 | $70 | 68 |
| 168 Tobacco Rd | 0.23mi | 2/2.0 (+1) | 1,334 (+14%) | 13mo | $115,000 | $86 | 51 |
| 151 Linda Lee Loop | 0.49mi | 2/1.0 (+1) | 1,050 (-11%) | 13mo | $149,500 | $142 | 40 |
Match score weights: distance 35% · size 25% · config 20% · recency 20%. Top-matched comps best support the ARV.
Projected returns pro-forma
-3.0% appreciation · 3.0% rent growth · sell at horizon
- IRR
- -8.3%
- Equity multiple
- 0.70×
- Total profit
- $-10,219
- Equity at exit
- $17,877
- IRR
- 1.3%
- Equity multiple
- 1.09×
- Total profit
- $3,030
- Equity at exit
- $10,367
Cash invested: $33,572 (down + closing). Projections, not guarantees.
Landlord ↔ Tenant lean methodology
- Overall (STATE)
- 87 Strongly Landlord-Friendly
- State Texas
- 87 Strongly Landlord-Friendly · R+5
- County
- — inherits STATE
- City
- — inherits STATE
ZIP-level market 76692
- Home prices YoY
- -6.5%
- Active inventory
- 644
- Price-to-rent
- 8.0×
Monthly cashflow live
- Estimated rent
- $1,245 medium interval (Pro) →
- Mortgage (P&I)
- −$629
- Tax from tax record
- −$160 /mo · $1,925/yr
- Insurance
- −$50
- HOA
- −$0
- Vacancy / Maint / Mgmt
- −$261
- Net cashflow
- $144
Break-even live
Sensitivity live
| Price | -10% $212 | -5% $178 | +0% $144 | +5% $110 | +10% $76 |
|---|---|---|---|---|---|
| Rent | -10% $46 | -5% $95 | +0% $144 | +5% $193 | +10% $243 |
| Rate | -1.0pp $205 | -0.5pp $175 | base $144 | +0.5pp $113 | +1.0pp $82 |
UW: 25.0% down · 7.5% · 30yr · 1.5% tax · 5.0% vac · 8.0% maint · 8.0% mgmt
Financing live
Cash to close
- Down payment
- $29,975
- Closing costs
- $3,597
- Reserves months
- —
- Total cash needed
- —
Loan-product check · same deal, 3 products live
Conventional
25% down · 7.5% · 30yr
- Down + closing
- —
- Monthly P&I
- —
- Monthly cashflow
- —
- DSCR
- —
- Eligible?
- —
Personal DTI + credit; lowest rate.
DSCR
20% down · 8.5% · 30yr
- Down + closing
- —
- Monthly P&I
- —
- Monthly cashflow
- —
- DSCR
- —
- Eligible?
- —
No personal income docs; deal must DSCR.
Hard money
10% down · 12.0% · 12mo
- Down + closing
- —
- Monthly P&I
- —
- Monthly cashflow
- —
- DSCR
- —
- Eligible?
- —
Short-term bridge; refi at stabilization.
Listing history 21 events
-
2026-06-12statusdays on market $119,900 Pending 23 DOM
-
2026-06-09days on market $119,900 Active Option Contract 22 DOM
-
2026-06-08days on market $119,900 Active Option Contract 21 DOM
-
2026-06-08days on market $119,900 Active Option Contract 20 DOM
-
2026-06-07days on market $119,900 Active Option Contract 19 DOM
-
2026-06-03days on market $119,900 Active Option Contract 16 DOM
-
2026-06-02days on market $119,900 Active Option Contract 15 DOM
-
2026-06-01days on market $119,900 Active Option Contract 14 DOM
-
2026-05-31days on market $119,900 Active Option Contract 13 DOM
-
2026-05-18$119,900 Active
-
2026-02-28historical
-
2026-01-20status Active
-
2026-01-19status Pending
-
2025-11-15status Active
-
2025-11-10status Pending
-
2025-10-30$135,000 Active
-
2025-10-08historical
-
2025-09-11price $149,250
-
2025-04-09$149,500 Active
-
2000-01-03soldstatus
-
1998-06-02soldstatus
ⓘ Source: listings_history table (triggers on properties + properties_extension) + one-shot
backfill from property_details.listing_events for pre-trigger history.
Tax reassessment forecast TX · Resets to sale price
- Current annual tax
- $1,925 · $160/mo
- Projected year-2 tax
- $2,194 · $183/mo
- Expected delta
- +$270/yr (+$22/mo · 14.0%)
ⓘ Screening estimate from a state-policy table — verify with the county assessor before closing.
Climate risk First Street
- Flood 1/10 Low FEMA zone X (unshaded) · 0% chance over 30 yrs
- Wildfire 4/10 Moderate
- Heat 7/10 Severe 7 d/yr ≥109°F today · 25 d/yr by 30 yrs out
- Wind 6/10 Major 27% chance of damaging wind over 30 yrs
- Air quality 2/10 Low 1 unhealthy d/yr today · 1 by 30 yrs out
Nearby sold comps map
Loading sold comps map…
Walkable amenities ~0.75 mi
Loading nearby amenities…
Taxation est. · year 1
- Rental income
- $14,936
- − Mortgage interest
- −$6,716
- − Property taxes
- −$1,925
- − Insurance
- −$600
- − Repairs & maintenance
- −$1,195
- − Management
- −$1,195
- − Depreciation
- −$3,488
- Taxable loss
- −$182
- Est. tax savings @ 24.0%
- +$44
- After-tax cash flow
- $1,774/yr
For passive investors: Depreciation is non-cash, so a rental often shows a tax loss while cash-flowing — sheltering income. Rental losses are passive: they offset passive income freely, and up to $25,000/yr can offset ordinary (W-2) income if you actively participate and your MAGI is under $100k (phasing out to $0 by $150k); unused losses carry forward. On sale, claimed depreciation is recaptured at up to 25%, and gains may owe capital-gains tax (a 1031 exchange can defer both). Figures are a year-1 estimate at your 24.0% rate — not tax advice; consult a CPA.
Schools (NCES district)
- District
- Whitney ISD
- NCES district ID
- 4845720
- Math proficiency
- 42% ▬ 0.00%
- Reading proficiency
- 41% ▲ 3.00%
- Median HH income
- $41,861
- Composite
- 34.97/100
- National rank
- #5060
- State rank
- #378 of 826 in TX
Livability — Whitney
- Score
- 71/100
- State rank
- #282
- US rank
- #6568
Category grades
Schools grade is shown separately in the Schools card above.
Census & demographics
- Population (ZIP)
- 9,662
Population outlook (Hill County) Hauer SSP2
- Today (2025)
- 34,013 people
- By 2030
- 33,289 · -2.1%
- By 2040
- 31,688 · -6.8%
- By 2050
- 30,100 · -11.5%
- By 2075
- 26,818 · -21.2%
- By 2100
- 22,918 · -32.6%
Race, ethnicity, and origin ACS 2023
- Neighborhood character
- Predominantly White (83%)
- Race & ethnicity
- White 83% Hispanic / Latino 12% Two or more races 4% Black 2%
- Hispanic origin (detail)
- Mexican 11%
- Common ancestry
- Italian 3% Lithuanian 2% Romanian 2%
- Foreign-born
- 4% · Canada, Vietnam
- Languages at home
- 90% English-only · Spanish 9%
Political lean MEDSL · Hill
- 2024 margin
- Solid R (+64.4) · D 17.5% · R 81.8%
- 2008→2024 swing
- -23.0pp toward R · 2008: -41.4pp · 2024: -64.4pp
- All cycles
- 2024: R+64.4 2020: R+60.7 2016: R+58.4 2012: R+53.0 2008: R+41.4
Not yet ingested
- Civics
- —
Market trends
- HPI YoY
- ▼ -17.72%
- Current HPI
- 252.9827
- Rent YoY
- —
- Metro
- —
- State GDP YoY
- ▲ 3.95%
- F500 in state
- 110
Industry mix (Fortune 500 HQ in TX)
| Industry | F500 HQs | Revenue |
|---|---|---|
| Energy | 16 | $1,198B |
|
||
| Technology | 5 | $198B |
|
||
| Engineering / Construction | 4 | $72B |
|
||
| Energy Services | 3 | $60B |
|
||
| Utilities | 3 | $41B |
|
||
| Healthcare | 2 | $330B |
|
||
Price history
-19.8% since first listed12 events — show timeline
- 2026-05-18 Listed $119,900 NTREIS
- 2026-02-28 Listing Removed — NTREIS
- 2026-01-20 Relisted — NTREIS
- 2026-01-19 Pending — NTREIS
- 2025-11-15 Relisted — NTREIS
- 2025-11-10 Pending — NTREIS
- 2025-10-30 Listed $135,000 NTREIS
- 2025-10-08 Listing Removed — NTREIS
- 2025-09-11 Price Changed $149,250 NTREIS
- 2025-04-09 Listed $149,500 NTREIS
- 2000-01-03 Sold (Public Records) — Public Records
- 1998-06-02 Sold (Public Records) — Public Records
Property tax history
+4.9%/yrLatest (2025): $1,925 · +11.0% YoY. Source: county tax records.
Cash-flow waterfall
monthlySold comps — $/sqft
last 12 mo · ≤1 miLoading sold comps…