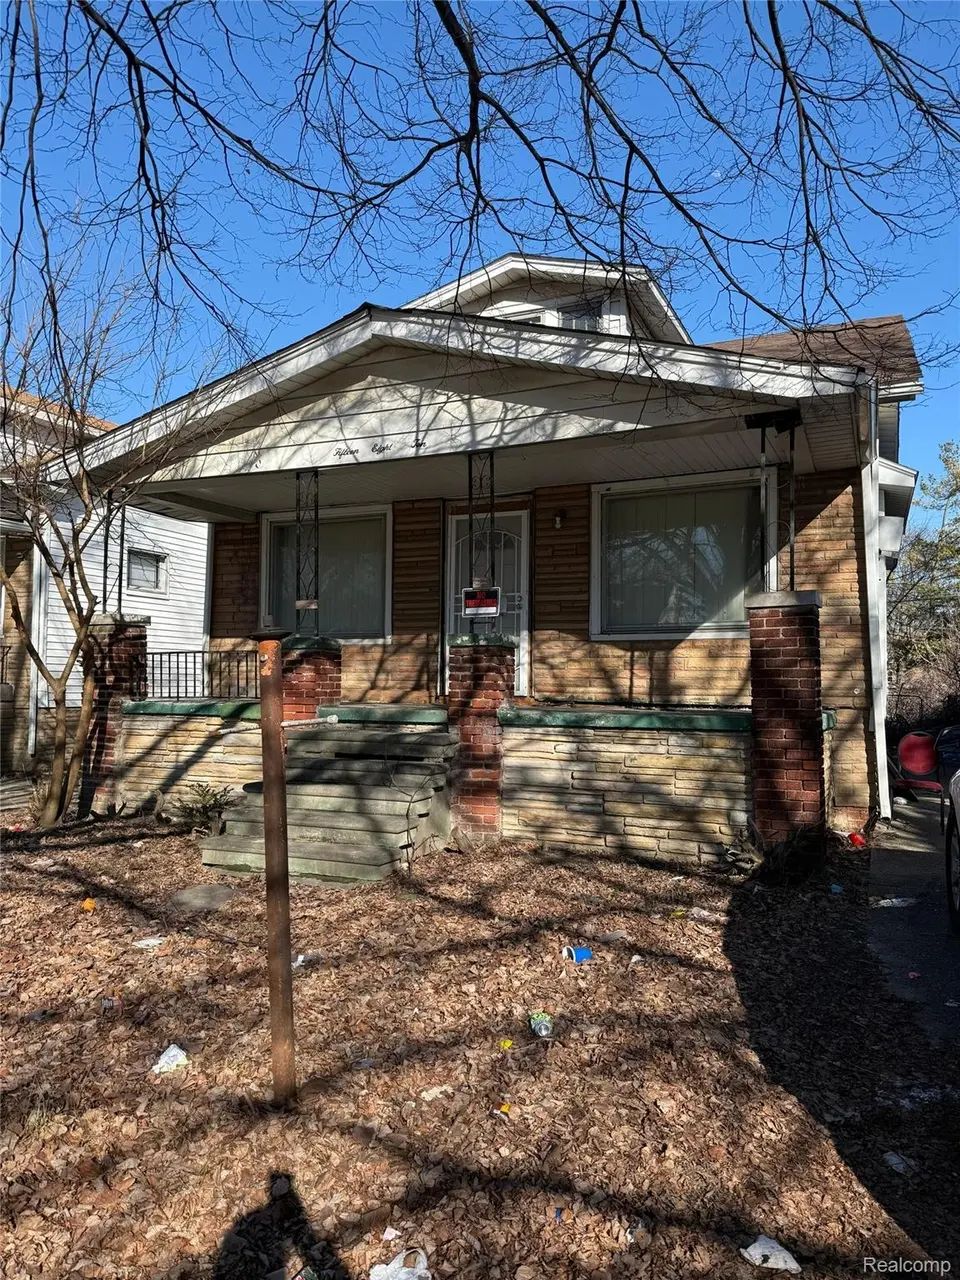
15810 Normandy St · Detroit, MI
Flood risk 1/10 · Minimal
- FEMA flood zone
- X (unshaded)
- Chance of flooding over 30 yrs
- 0.0%
- Est. flood insurance / yr
- $473 – $860
Fire risk 1/10 · Minimal
- Est. fire insurance / yr
- $784 – $1,456
Heat risk 3/10 · Minor
- Hot days now (above 97°F)
- 7 days/yr
- Hot days in 30 yrs
- 15 days/yr
Wind risk 2/10 · Minimal
- Chance of severe wind over 30 yrs
- —
Air-quality risk 4/10 · Minor
- Unhealthy air days now
- 4 days/yr
- Unhealthy air days in 30 yrs
- 6 days/yr
Risk factors via First Street. Map © Google.
Why this score? — see what drove the B+ grade
The composite is a weighted blend of 9 inputs, each scored 0–100. Each bar is that input's sub-score; the figure is the points it added to the 100-point composite (weight × sub-score).
- Cash flow +30.0/30.0
- ARV discount +15.0/15.0
- 1% rule +10.0/10.0
- DSCR +10.0/10.0
- Rent growth +4.0/5.0
- Livability +3.7/5.0
- Condition / age +2.5/5.0
- Schools +1.3/10.0
- Appreciation +0.0/10.0
$51,900
🖨 Deal sheet (PDF) 📄 Offer letter ✓ Due diligence
Listing remarks MLS
INVESTOR SPECIAL IN DETROIT! PRIME OPPORTUNITY FOR FIX & FLIP OR FIX & HOLD INVESTORS. WHETHER YOU'RE LOOKING TO CASH IN ON A QUICK FLIP OR BUILD LONG-TERM EQUITY, THIS ONE CHECKS ALL THE BOXES. TONS OF POTENTIAL – DON'T MISS OUT! MORE PHOTOS AVAILABLE UPON REQUEST.
Key facts
- 4,356 sq ft lot
- 2 garage spots
- Built 1923
Neighborhood map
What this means for you Summary
Snapshot
- This is a 3-bed/1.0-bath single-family listed at $52k.
Deal economics
- At list price, monthly cash flow is $628 ($8k/yr) — positive.
- The deal already cash-flows at list — no discount required.
- Meets the 1% rule at list price ($1k rent vs $52k).
- Recommended offer: $46k (12.0% below list) — sets the bar for market timing.
- Cap rate 20.8% vs local median 10.0% in Detroit — top-decile yield for the area; either an underpriced asset or a hidden risk that comps aren't pricing in. Stress-test before assuming the spread holds.
Location & tenants
- Location reads 73/100 on livability (#218 in MI) — a middle-class / working-renter tenant base. Strengths: amenities A+, commute A+, cost of living A+; Watch: crime F, employment F.
- Detroit Public Schools Community District (urban): math 10% / reading 24% proficiency, ranked #499 of 540 in MI (top 92%) — low school quality limits family demand, transient renter base, plan for 1-2y turnover; 90% free/reduced lunch — lower-income household profile, screen leases tightly.
- Zoned schools: Paul Robeson Malcolm X Academy (math 10% / reading 10%, grade F, #1,230 of 1,397 statewide, top 91%, 395 students, 88% FRL); Mumford High School (math 24% / reading 24%, grade F, #481 of 713 statewide, top 81%, 889 students, 86% FRL) — zoned schools at 87% FRL track the district average.
- Market conditions: Rents rising fast (+6.1%/yr); 350 active listings in the ZIP; 40 comparable units currently listed for rent nearby; rentals at typical pace (median 26d on market — plan ~3-4 weeks tenant-placement turnaround); 45% of comp listings sitting > 30 days — soft ceiling on asking rent; lower-income renter base — watch delinquency; 2,639 units permitted in Wayne County in 2024 (1,216 in 5+ unit buildings).
- At $1,294/mo this rent would consume 47% of the median local household income ($33k/yr) (locally 2172% of renters already pay >50% of income on rent) — very limited rent-growth headroom before tenants either downsize or default.
Forward outlook
- Local home prices are declining (-3.0%/yr); year-one equity from $359 of loan paydown is wiped out by about $2k of value loss. Plan a longer hold.
- Wayne County population projected at -17% by 2050 — secular population decline; favor cash flow + early exit over multi-decade hold.
- At projected returns (-3.0% appreciation + 6.1% rent growth), your $15k cash investment doubles in ~3 years — after that, you're playing with house money.
Negotiation context
- It's been on market 320 days — a 12% lower offer ($46k) is reasonable based on typical stale-listing flexibility.
- 18 sale attempts since 21y ago; this cycle's ask has dropped $3k (6%) from the opening price — seller is motivated, your offer sets the floor, not the list.
Risks & watch-outs
- Watch-outs: built in 1923 — expect roof / HVAC / electrical / plumbing capex.
Questions for the listing agent
- It's been on market 320 days. Have you received any prior offers? Is the seller open to a 12% concession, seller financing, or rate buy-down credit?
- Built in 1923 — when were the roof, HVAC, electrical panel, plumbing, and water heater last replaced?
- Why hasn't it sold? Are there any deal-killer items the seller is aware of (foundation, flood, title, zoning, code violations)?
- Is there a deadline driving the sale (1031 exchange, divorce, estate, relocation)? That informs how much negotiation room exists.
- Schools are F-rated, which usually means shorter tenancies and higher turnover. Who's the typical renter profile here, and what's been the actual vacancy rate?
- Crime grade is F in this area — have there been break-ins, vandalism, or insurance claims at this property in the last 3 years? What carrier currently insures it and at what premium?
- What's the average days-on-market for RENTAL listings here right now (not sales)? A rising rental-DOM trend means longer vacancies and softer asking-rent achievability than the comps imply.
- What's the recent tenant-quality profile in this submarket — average credit score on applications, eviction rate, late-payment / NSF rate, and stable-employment percentage? A property-management company in the area should have these aggregated.
- How much new for-sale + rental construction is in the pipeline within 1–3 miles? Heavy new supply typically softens prices + rents 12–24 months out; constrained supply supports both.
Investment metrics
- 1% rule
- 2.49% ✓
- Cap rate
- 20.81%
- Cash-on-cash
- 51.83%
- DSCR
- 3.31
- GRM
- 3.3
CMA / ARV
- ARV (median comp)
- $64,966
- List price
- $51,900
- Delta
- -20.11%
- Verdict
- UNDERPRICED
- Comps
- 20 within 1.0 mi
Show comp detail 12 sales within ~0.75 mi
| Address | Dist | Beds/Ba | Sqft | Sold | Price | $/sf | Match |
|---|---|---|---|---|---|---|---|
| 15840 Lawton St | 0.18mi | 3/1.0 | 1,176 (+2%) | 7mo | $38,000 | $32 | 83 |
| 15904 Parkside St | 0.29mi | 3/1.5 | 1,204 (+4%) | 2mo | $140,000 | $116 | 76 |
| 15863 Belden St | 0.50mi | 3/1.0 | 1,156 (0%) | 1mo | $18,600 | $16 | 76 |
| 15560 La Salle Blvd | 0.14mi | 3/1.0 | 1,022 (-12%) | 1mo | $35,000 | $34 | 73 |
| 15834 Baylis St | 0.12mi | 3/1.0 | 1,065 (-8%) | 10mo | $111,500 | $105 | 72 |
| 15455 Wildemere St | 0.39mi | 3/1.0 | 1,095 (-5%) | 2mo | $18,500 | $17 | 71 |
| 15494 Muirland St | 0.40mi | 2/1.0 (-1) | 1,090 (-6%) | 9mo | $39,000 | $36 | 60 |
| 15774 Muirland St | 0.38mi | 2/1.0 (-1) | 1,018 (-12%) | 10mo | $35,000 | $34 | 49 |
| 15745 Holmur St | 0.60mi | 3/1.0 | 1,070 (-7%) | 13mo | $25,000 | $23 | 49 |
| 16570 Inverness St | 0.42mi | 4/2.0 (+1) | 1,300 (+12%) | 3mo | $120,000 | $92 | 48 |
| 15897 Holmur St | 0.60mi | 3/1.0 | 1,260 (+9%) | 13mo | $35,000 | $28 | 46 |
| 15348 Parkside St | 0.40mi | 3/2.0 | 1,327 (+15%) | 13mo | $100,000 | $75 | 42 |
Match score weights: distance 35% · size 25% · config 20% · recency 20%. Top-matched comps best support the ARV.
Projected returns pro-forma
-3.0% appreciation · 6.14% rent growth · sell at horizon
- IRR
- 53.4%
- Equity multiple
- 3.47×
- Total profit
- $35,826
- Equity at exit
- $7,738
- IRR
- 59.9%
- Equity multiple
- 7.97×
- Total profit
- $101,298
- Equity at exit
- $4,487
Cash invested: $14,532 (down + closing). Projections, not guarantees.
Landlord ↔ Tenant lean methodology
- Overall (STATE)
- 62 Landlord-Friendly
- State Michigan
- 62 Landlord-Friendly · EVEN
- County
- — inherits STATE
- City
- — inherits STATE
ZIP-level market 48238
- Home prices YoY
- -14.4%
- Rents YoY
- 6.1%
- Active inventory
- 350
- Price-to-rent
- 3.3×
Monthly cashflow live
- Estimated rent
- $1,294 high interval (Pro) →
- Mortgage (P&I)
- −$272
- Tax from tax record
- −$101 /mo · $1,207/yr
- Insurance
- −$22
- HOA
- −$0
- Vacancy / Maint / Mgmt
- −$272
- Net cashflow
- $628
Break-even live
Sensitivity live
| Price | -10% $657 | -5% $642 | +0% $628 | +5% $613 | +10% $598 |
|---|---|---|---|---|---|
| Rent | -10% $525 | -5% $577 | +0% $628 | +5% $679 | +10% $730 |
| Rate | -1.0pp $654 | -0.5pp $641 | base $628 | +0.5pp $614 | +1.0pp $601 |
UW: 25.0% down · 7.5% · 30yr · 1.5% tax · 5.0% vac · 8.0% maint · 8.0% mgmt
Financing live
Cash to close
- Down payment
- $12,975
- Closing costs
- $1,557
- Reserves months
- —
- Total cash needed
- —
Loan-product check · same deal, 3 products live
Conventional
25% down · 7.5% · 30yr
- Down + closing
- —
- Monthly P&I
- —
- Monthly cashflow
- —
- DSCR
- —
- Eligible?
- —
Personal DTI + credit; lowest rate.
DSCR
20% down · 8.5% · 30yr
- Down + closing
- —
- Monthly P&I
- —
- Monthly cashflow
- —
- DSCR
- —
- Eligible?
- —
No personal income docs; deal must DSCR.
Hard money
10% down · 12.0% · 12mo
- Down + closing
- —
- Monthly P&I
- —
- Monthly cashflow
- —
- DSCR
- —
- Eligible?
- —
Short-term bridge; refi at stabilization.
Rent comps 40 comps
| Address | Beds | Baths | Sqft | Rent | $/sqft | DOM | Units | Dist |
|---|---|---|---|---|---|---|---|---|
| 15906 Alden St Detroit, MI | 3.0 | 1.0 | 1030 | $1,150 | $1.12 | 18d | 1 | 0.25mi |
| 16174 Princeton St Unit 2 Detroit, MI | 2.0 | 1.0 | 985 | $1,100 | $1.12 | 45d | 1 | 0.27mi |
| 16174 Princeton St Detroit, MI | 2.0 | 1.0 | 985 | $1,100 | $1.12 | 21d | 1 | 0.27mi |
| 15345 Parkside St Detroit, MI | 3.0 | 1.0 | 1152 | $1,300 | $1.13 | 45d | 1 | 0.42mi |
| 326 Eason St Highland Park, MI | 3.0 | 1.0 | 1256 | $1,300 | $1.04 | 19d | 1 | 0.63mi |
| 16927 Inverness St Detroit, MI | 2.0 | 1.0 | 897 | $1,650 | $1.84 | 18d | 1 | 0.63mi |
| 2521 W McNichols Rd Unit B2 Detroit, MI | 2.0 | 1.0 | 1300 | $1,250 | $0.96 | 45d | 1 | 0.63mi |
| 2433 Pasadena St Unit 2435 Detroit, MI | 2.0 | 1.0 | 700 | $1,025 | $1.46 | 45d | 1 | 0.87mi |
| 941 Merton Rd Highland Park, MI | 2.0 | 1.0 | 850 | $1,000 | $1.18 | 45d | 1 | 0.89mi |
| 13639 La Salle Blvd Detroit, MI | 2.0 | 1.0 | 800 | $695 | $0.87 | 12d | 1 | 0.92mi |
| 17449 Manderson Rd Unit 1 Detroit, MI | 2.0 | 1.0 | 750 | $1,150 | $1.53 | 26d | 1 | 0.92mi |
| 16582 Santa Rosa Dr Detroit, MI | 3.0 | 1.0 | 1314 | $1,399 | $1.06 | 19d | 1 | 0.93mi |
| 2034 Ewald Cir Detroit, MI | 2.0 | 1.0 | 1000 | $995 | $0.99 | 7d | 1 | 0.94mi |
| 1926 Clements St Unit 1926 Detroit, MI | 3.0 | 1.0 | 1150 | $1,250 | $1.09 | 22d | 1 | 0.96mi |
| 1926 Clements St Detroit, MI | 3.0 | 1.0 | 1150 | $1,150 | $1.00 | 7d | 1 | 0.96mi |
| 7350 Globe St Detroit, MI | 3.0 | 1.0 | 1000 | $1,550 | $1.55 | 5d | 1 | 0.96mi |
| 885 Covington Dr Unit 201 Highland Park, MI | 2.0 | 2.0 | 1350 | $1,695 | $1.26 | 45d | 1 | 1.04mi |
| 17215 Warrington Dr Detroit, MI | 2.0 | 1.0 | 1015 | $2,000 | $1.97 | 45d | 1 | 1.04mi |
| 17666 Manderson Rd Unit 17666 Detroit, MI | 2.0 | 1.0 | 1200 | $1,595 | $1.33 | 45d | 1 | 1.05mi |
| 17670 Manderson Rd Unit 17670 Detroit, MI | 2.0 | 1.0 | 1199 | $1,595 | $1.33 | 45d | 1 | 1.05mi |
| 1029 Covington Dr Unit 1029 Detroit, MI | 2.0 | 1.0 | 1200 | $1,495 | $1.25 | 45d | 1 | 1.06mi |
| 1031 Covington Dr Unit 1061 Detroit, MI | 2.0 | 1.0 | 1200 | $1,595 | $1.33 | 45d | 1 | 1.06mi |
| 730 Whitmore Rd Detroit, MI | 1.0–2.0 | 1.0 | 850 | $850 | $1.00 | 45d | 3 | 1.06mi |
| 17765 Manderson Rd Unit 14 Highland Park, MI | 2.0 | 1.0 | 1000 | $1,175 | $1.18 | 45d | 1 | 1.07mi |
| 17765 Manderson Rd Unit 8 Highland Park, MI | 2.0 | 1.0 | 1000 | $1,215 | $1.22 | 3d | 1 | 1.07mi |
| 17145 Santa Rosa Dr Unit 1 Detroit, MI | 3.0 | 1.0 | 1050 | $1,400 | $1.33 | 19d | 1 | 1.12mi |
| 16255 Lilac St Detroit, MI | 3.0 | 1.0 | 1312 | $1,394 | $1.06 | 19d | 1 | 1.12mi |
| 17147 Monica St Unit 2 1 Detroit, MI | 2.0 | 1.0 | 900 | $975 | $1.08 | 26d | 1 | 1.16mi |
| 17550 2nd Ave Detroit, MI | 2.0 | 1.0 | 1350 | $1,150 | $0.85 | 19d | 1 | 1.16mi |
| 17550 2nd Ave Detroit, MI | 2.0 | 1.0 | 1350 | $1,150 | $0.85 | 0d | 1 | 1.16mi |
| 15771 Turner St Detroit, MI | 2.0 | 1.0 | 1000 | $1,049 | $1.05 | 45d | 1 | 1.17mi |
| 17163 Prairie St Unit 1B Detroit, MI | 3.0 | 1.5 | 1317 | $1,350 | $1.03 | 45d | 1 | 1.22mi |
| 16722 Tuller St Detroit, MI | 3.0 | 1.5 | 1100 | $1,500 | $1.36 | 18d | 1 | 1.23mi |
| 3812 W Grand St Detroit, MI | 2.0 | 1.0 | 1100 | $1,025 | $0.93 | 18d | 1 | 1.26mi |
| 17551 Santa Rosa Dr Detroit, MI | 2.0 | 1.0 | 1036 | $1,095 | $1.06 | 45d | 1 | 1.29mi |
| 17596 Santa Rosa Dr Detroit, MI | 2.0 | 1.0 | 1350 | $1,195 | $0.89 | 45d | 1 | 1.31mi |
| 17596 Santa Rosa Dr Unit 2 Detroit, MI | 2.0 | 1.0 | 1350 | $1,195 | $0.89 | 26d | 1 | 1.31mi |
| 2474 Fullerton St Detroit, MI | 3.0 | 1.0 | 1400 | $1,300 | $0.93 | 17d | 1 | 1.35mi |
| 4045 Clements St Detroit, MI | 3.0 | 1.0 | 850 | $1,150 | $1.35 | 26d | 1 | 1.37mi |
| 4045 Clements St Detroit, MI | 3.0 | 1.0 | 850 | $1,150 | $1.35 | 45d | 1 | 1.37mi |
Listing history 50 events
-
2026-06-21days on market $51,900 Active 320 DOM
-
2026-06-18days on market $51,900 Active 317 DOM
-
2026-06-17days on market $51,900 Active 316 DOM
-
2026-06-15days on market $51,900 Active 314 DOM
-
2026-06-13days on market $51,900 Active 312 DOM
-
2026-06-13days on market $51,900 Active 311 DOM
-
2026-06-09days on market $51,900 Active 308 DOM
-
2026-06-08days on market $51,900 Active 307 DOM
-
2026-06-07days on market $51,900 Active 306 DOM
-
2026-06-04days on market $51,900 Active 303 DOM
-
2026-06-03days on market $51,900 Active 302 DOM
-
2026-06-01days on market $51,900 Active 300 DOM
-
2026-05-31days on market $51,900 Active 299 DOM
-
2025-10-03status Active 297-char remark
Show marketing remark (290 chars)
INVESTOR SPECIAL IN DETROIT! PRIME OPPORTUNITY FOR FIX & FLIP OR FIX & HOLD INVESTORS. WHETHER YOU'RE LOOKING TO CASH IN ON A QUICK FLIP OR BUILD LONG-TERM EQUITY, THIS ONE CHECKS ALL THE BOXES. TONS OF POTENTIAL – DON’T MISS OUT! MORE PHOTOS AVAILABLE UPON REQUEST.
-
2025-10-03status Active 290-char remark
Show marketing remark (290 chars)
INVESTOR SPECIAL IN DETROIT! PRIME OPPORTUNITY FOR FIX & FLIP OR FIX & HOLD INVESTORS. WHETHER YOU'RE LOOKING TO CASH IN ON A QUICK FLIP OR BUILD LONG-TERM EQUITY, THIS ONE CHECKS ALL THE BOXES. TONS OF POTENTIAL – DON’T MISS OUT! MORE PHOTOS AVAILABLE UPON REQUEST.
-
2025-09-23historical Accepting Backup Offers 297-char remark
Show marketing remark (290 chars)
INVESTOR SPECIAL IN DETROIT! PRIME OPPORTUNITY FOR FIX & FLIP OR FIX & HOLD INVESTORS. WHETHER YOU'RE LOOKING TO CASH IN ON A QUICK FLIP OR BUILD LONG-TERM EQUITY, THIS ONE CHECKS ALL THE BOXES. TONS OF POTENTIAL – DON’T MISS OUT! MORE PHOTOS AVAILABLE UPON REQUEST.
-
2025-09-23historical Active Under Contract 290-char remark
Show marketing remark (290 chars)
INVESTOR SPECIAL IN DETROIT! PRIME OPPORTUNITY FOR FIX & FLIP OR FIX & HOLD INVESTORS. WHETHER YOU'RE LOOKING TO CASH IN ON A QUICK FLIP OR BUILD LONG-TERM EQUITY, THIS ONE CHECKS ALL THE BOXES. TONS OF POTENTIAL – DON’T MISS OUT! MORE PHOTOS AVAILABLE UPON REQUEST.
-
2025-09-16price $51,900 297-char remark
Show marketing remark (290 chars)
INVESTOR SPECIAL IN DETROIT! PRIME OPPORTUNITY FOR FIX & FLIP OR FIX & HOLD INVESTORS. WHETHER YOU'RE LOOKING TO CASH IN ON A QUICK FLIP OR BUILD LONG-TERM EQUITY, THIS ONE CHECKS ALL THE BOXES. TONS OF POTENTIAL – DON’T MISS OUT! MORE PHOTOS AVAILABLE UPON REQUEST.
-
2025-09-16price $51,900 290-char remark
Show marketing remark (290 chars)
INVESTOR SPECIAL IN DETROIT! PRIME OPPORTUNITY FOR FIX & FLIP OR FIX & HOLD INVESTORS. WHETHER YOU'RE LOOKING TO CASH IN ON A QUICK FLIP OR BUILD LONG-TERM EQUITY, THIS ONE CHECKS ALL THE BOXES. TONS OF POTENTIAL – DON’T MISS OUT! MORE PHOTOS AVAILABLE UPON REQUEST.
-
2025-08-05$55,000 Active 290-char remark
Show marketing remark (290 chars)
INVESTOR SPECIAL IN DETROIT! PRIME OPPORTUNITY FOR FIX & FLIP OR FIX & HOLD INVESTORS. WHETHER YOU'RE LOOKING TO CASH IN ON A QUICK FLIP OR BUILD LONG-TERM EQUITY, THIS ONE CHECKS ALL THE BOXES. TONS OF POTENTIAL – DON’T MISS OUT! MORE PHOTOS AVAILABLE UPON REQUEST.
-
2025-07-30$55,000 Active 297-char remark
Show marketing remark (297 chars)
INVESTOR SPECIAL IN DETROIT! PRIME OPPORTUNITY FOR FIX & FLIP OR FIX & HOLD INVESTORS. WHETHER YOU'RE LOOKING TO CASH IN ON A QUICK FLIP OR BUILD LONG-TERM EQUITY, THIS ONE CHECKS ALL THE BOXES. TONS OF POTENTIAL – DON'T MISS OUT! MORE PHOTOS AVAILABLE UPON REQUEST.
-
2023-11-07historical
-
2023-11-07historical
-
2023-07-27price $44,900
-
2023-07-26price $44,900
-
2023-03-07price $55,000
-
2023-03-06price $55,000
-
2023-03-06status Active
-
2023-03-06status Active
-
2023-03-06historical
-
2023-03-06historical
-
2023-03-03$34,999 Active
-
2023-03-03$34,999 Active
-
2021-06-22historical
-
2021-06-21historical
-
2021-05-11price $56,900
-
2021-05-11price $56,900
-
2021-04-21$59,900 Active
-
2021-04-21$59,900 Active
-
2021-04-14historical
-
2021-04-14historical
-
2021-04-13status Active
-
2021-02-11status Pending
-
2021-02-11status Pending
-
2021-01-28price $65,000
-
2021-01-28price $65,000
-
2020-10-19status Active
-
2020-10-19status Active
-
2020-05-27historical Accepting Backup Offers
-
2020-05-27historical Accepting Backup Offers
ⓘ Source: listings_history table (triggers on properties + properties_extension) + one-shot
backfill from property_details.listing_events for pre-trigger history.
Tax reassessment forecast MI · Partial reset (capped growth)
- Current annual tax
- $1,207 · $101/mo
- Projected year-2 tax
- $1,207 · $101/mo
- Expected delta
- $0/yr ($0/mo · 0.0%)
ⓘ Screening estimate from a state-policy table — verify with the county assessor before closing.
Climate risk First Street
- Flood 1/10 Low FEMA zone X (unshaded) · 0% chance over 30 yrs
- Wildfire 1/10 Low
- Heat 3/10 Moderate 7 d/yr ≥97°F today · 15 d/yr by 30 yrs out
- Wind 2/10 Low
- Air quality 4/10 Moderate 4 unhealthy d/yr today · 6 by 30 yrs out
Nearby sold comps map
Loading sold comps map…
Walkable amenities ~0.75 mi
Loading nearby amenities…
Taxation est. · year 1
- Rental income
- $15,525
- − Mortgage interest
- −$2,907
- − Property taxes
- −$1,207
- − Insurance
- −$260
- − Repairs & maintenance
- −$1,242
- − Management
- −$1,242
- − Depreciation
- −$1,510
- Taxable income
- $7,158
- Est. tax owed @ 24.0%
- −$1,718
- After-tax cash flow
- $5,815/yr
For passive investors: Depreciation is non-cash, so a rental often shows a tax loss while cash-flowing — sheltering income. Rental losses are passive: they offset passive income freely, and up to $25,000/yr can offset ordinary (W-2) income if you actively participate and your MAGI is under $100k (phasing out to $0 by $150k); unused losses carry forward. On sale, claimed depreciation is recaptured at up to 25%, and gains may owe capital-gains tax (a 1031 exchange can defer both). Figures are a year-1 estimate at your 24.0% rate — not tax advice; consult a CPA.
Schools (NCES district)
- District
- Detroit Public Schools Community District
- NCES district ID
- 2601103
- Math proficiency
- 10% ▼ -2.00%
- Reading proficiency
- 24% ▲ 6.00%
- Median HH income
- $25,815
- Composite
- 13.06/100
- National rank
- #9564
- State rank
- #499 of 540 in MI
Livability — Detroit
- Score
- 73/100
- State rank
- #218
- US rank
- #5427
Category grades
Schools grade is shown separately in the Schools card above.
Census & demographics
- Census place
- Detroit, MI
- County
- Wayne County · 1,562,939 people
- City population
- 572,865
- Metro
- Detroit-Warren-Dearborn, MI
- Population (ZIP)
- 24,731
- Household income
- $33,315
- Rent vs Own
- Severe rent burden
- 2172.0
Population outlook (Wayne County) Hauer SSP2
- Today (2025)
- 1,675,273 people
- By 2030
- 1,620,300 · -3.3%
- By 2040
- 1,502,341 · -10.3%
- By 2050
- 1,384,039 · -17.4%
- By 2075
- 1,124,592 · -32.9%
- By 2100
- 881,193 · -47.4%
Race, ethnicity, and origin ACS 2023
- Neighborhood character
- Predominantly Black (94%)
- Race & ethnicity
- Black 94% Two or more races 3% White 1%
- Foreign-born
- 1%
Political lean MEDSL · Wayne
- 2024 margin
- Strong D (+29.0) · D 62.7% · R 33.7% · Other 3.6%
- 2008→2024 swing
- -20.5pp toward R · 2008: 49.5pp · 2024: 29.0pp
- All cycles
- 2024: D+29.0 2020: D+38.1 2016: D+37.3 2012: D+46.9 2008: D+49.5
Not yet ingested
- Civics
- —
Market trends
- HPI YoY
- ▼ -31.96%
- Current HPI
- 189.6227
- Rent YoY
- ▲ 6.14%
- Metro
- Detroit-Warren-Dearborn, MI
- State GDP YoY
- ▲ 1.37%
- F500 in state
- 28
Industry mix (Fortune 500 HQ in MI)
| Industry | F500 HQs | Revenue |
|---|---|---|
| Automotive Parts | 3 | $48B |
|
||
| Automotive | 2 | $372B |
|
||
| Chemicals | 1 | $45B |
|
||
| Automotive Retail | 1 | $29B |
|
||
| Healthcare / Medical Devices | 1 | $23B |
|
||
| Automotive Technology | 1 | $20B |
|
||
Price history
-38.9% since first listed53 events — show timeline
- 2025-10-03 Relisted — MiRealSource-MiMLS
- 2025-10-03 Relisted — REALCOMP
- 2025-09-23 Contingent — MiRealSource-MiMLS
- 2025-09-23 Contingent — REALCOMP
- 2025-09-16 Price Changed $51,900 MiRealSource-MiMLS
- 2025-09-16 Price Changed $51,900 REALCOMP
- 2025-08-05 Listed $55,000 REALCOMP
- 2025-07-30 Listed $55,000 MiRealSource-MiMLS
- 2023-11-07 Listing Removed — MiRealSource-MiMLS
- 2023-11-07 Listing Removed — REALCOMP
- 2023-07-27 Price Changed $44,900 MiRealSource-MiMLS
- 2023-07-26 Price Changed $44,900 REALCOMP
- 2023-03-07 Price Changed $55,000 MiRealSource-MiMLS
- 2023-03-06 Price Changed $55,000 REALCOMP
- 2023-03-06 Relisted — MiRealSource-MiMLS
- 2023-03-06 Relisted — REALCOMP
- 2023-03-06 Listing Removed — MiRealSource-MiMLS
- 2023-03-06 Listing Removed — REALCOMP
- 2023-03-03 Listed $34,999 MiRealSource-MiMLS
- 2023-03-03 Listed $34,999 REALCOMP
- 2021-06-22 Listing Removed — REALCOMP
- 2021-06-21 Listing Removed — MiRealSource-MiMLS
- 2021-05-11 Price Changed $56,900 MiRealSource-MiMLS
- 2021-05-11 Price Changed $56,900 REALCOMP
- 2021-04-21 Listed $59,900 MiRealSource-MiMLS
- 2021-04-21 Listed $59,900 REALCOMP
- 2021-04-14 Listing Removed — REALCOMP
- 2021-04-14 Listing Removed — MiRealSource-MiMLS
- 2021-04-13 Relisted — REALCOMP
- 2021-02-11 Pending — MiRealSource-MiMLS
- 2021-02-11 Pending — REALCOMP
- 2021-01-28 Price Changed $65,000 MiRealSource-MiMLS
- 2021-01-28 Price Changed $65,000 REALCOMP
- 2020-10-19 Relisted — MiRealSource-MiMLS
- 2020-10-19 Relisted — REALCOMP
- 2020-05-27 Contingent — MiRealSource-MiMLS
- 2020-05-27 Contingent — REALCOMP
- 2020-03-10 Price Changed $38,739 MiRealSource-MiMLS
- 2020-03-09 Price Changed $38,739 REALCOMP
- 2020-02-26 Price Changed $39,500 MiRealSource-MiMLS
- 2020-02-25 Price Changed $39,500 REALCOMP
- 2019-11-16 Price Changed $40,000 MiRealSource-MiMLS
- 2019-11-15 Price Changed $40,000 REALCOMP
- 2019-08-20 Listed $42,000 MiRealSource-MiMLS
- 2019-08-20 Listed $42,000 REALCOMP
- 2009-04-30 Listing Removed — REALCOMP
- 2009-03-05 Listed $6,500 REALCOMP
- 2006-03-31 Sold (Public Records) $85,000 Public Records
- 2005-12-16 Sold (MLS) $85,000 MiRealSource-MiMLS
- 2005-12-16 Sold (MLS) $85,000 REALCOMP
- 2005-09-30 Listing Removed — MiRealSource-MiMLS
- 2005-08-29 Listed $84,900 MiRealSource-MiMLS
- 2005-08-29 Listed $84,900 REALCOMP
Property tax history
+3.3%/yrLatest (2025): $1,207 · -53.9% YoY. Source: county tax records.
Cash-flow waterfall
monthlySold comps — $/sqft
last 12 mo · ≤1 miLoading sold comps…