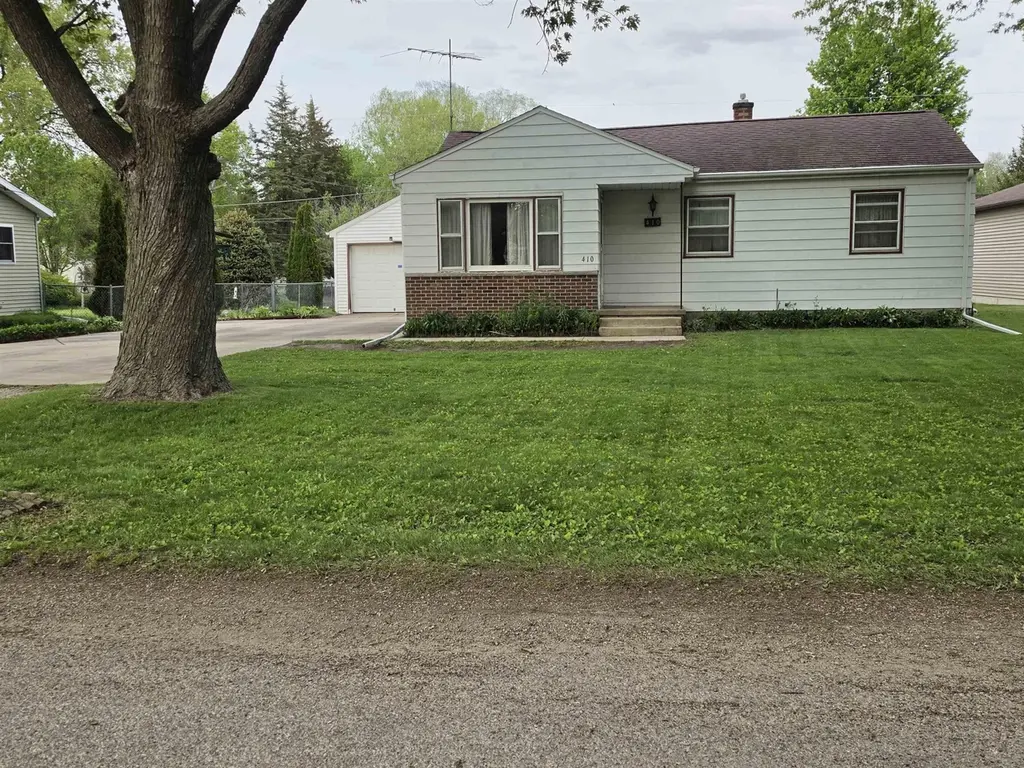
410 3rd St · Washburn, IA
Flood risk 1/10 · Minimal
- FEMA flood zone
- X (unshaded)
- Chance of flooding over 30 yrs
- 0.0%
- Est. flood insurance / yr
- $473 – $860
Fire risk 1/10 · Minimal
- Est. fire insurance / yr
- $902 – $1,676
Heat risk 3/10 · Minor
- Hot days now (above 101°F)
- 7 days/yr
- Hot days in 30 yrs
- 15 days/yr
Wind risk 2/10 · Minimal
- Chance of severe wind over 30 yrs
- —
Air-quality risk 1/10 · Minimal
- Unhealthy air days now
- 0 days/yr
- Unhealthy air days in 30 yrs
- 0 days/yr
Risk factors via First Street. Map © Google.
Why this score? — see what drove the D grade
The composite is a weighted blend of 9 inputs, each scored 0–100. Each bar is that input's sub-score; the figure is the points it added to the 100-point composite (weight × sub-score).
- Cash flow +13.4/30.0
- ARV discount +8.7/15.0
- Schools +4.4/10.0
- DSCR +4.0/10.0
- Livability +3.4/5.0
- Rent growth +3.2/5.0
- 1% rule +3.1/10.0
- Condition / age +2.5/5.0
- Appreciation +0.0/10.0
$139,500
🖨 Deal sheet (PDF) 📄 Offer letter ✓ Due diligence
Listing remarks
Welcome to a great opportunity to have a affordable 3 bedroom ranch style home in the quiet suburb of Washburn. Country living with friendly neighbors next door and close by. Open space that flows from the Living room to the kitchen. Full unfinished basement awaits for you to create your own enjoyable space. Oversized tandem (16x48) 768 square foot garage, and there is also a shed for extra storage. Almost 1/3 acre (75x160) fenced-in back lot. Perfect for kids, pets, relaxation and a garden. Energy efficient forced air gas furnace and central air installed 2019, Updated elecric circuit breaker box, sump pump. The family called this home for 64 years and made many great memories; now it is r
Key facts
- Sump pump
- Ranch style home
- Central air
Tags
Property features AI
Exterior
- Parking: Has carport (2 spaces); Detached oversized garage with garage door opener
- Utilities: Public water; Public sewer
- Home design: Single family residence; Residential property
- Construction: Aluminum siding; Shingle/asphalt roof; Has basement (unfinished, block foundation, sump pump)
- Exterior features: Sliding doors; Storage
Interior
- Kitchen: Free-standing range; Refrigerator
- Bathrooms: 1 full bathroom
- Heating & cooling: Forced air heating (natural gas); Central air; Ceiling fan(s)
- Interior features: Eat-in kitchen; Ceiling fan(s)
- Laundry & utility: Washer hookup; Gas dryer hookup; Gas water heater
Neighborhood map
What this means for you Summary
Snapshot
- This is a 3-bed/1.0-bath single-family listed at $140k.
Deal economics
- At list price, monthly cash flow is $2 ($26/yr) — positive.
- The deal already cash-flows at list — no discount required.
- To meet the 1% rule (rent ≥ 1% of price), the offer needs to be $113k (18.9% below list).
- Recommended offer: $113k (18.9% below list) — sets the bar for 1% rule.
Location & tenants
- Location reads 68/100 on livability (#442 in IA) — a middle-class / working-renter tenant base. Strengths: employment A+, cost of living A+, housing A+; Watch: amenities F, commute F, health & safety F.
- Waterloo Community School District (urban): math 50% / reading 54% proficiency, ranked #276 of 289 in IA (top 96%) — acceptable for families but not a draw, mixed tenant base, ~2y average lease.
- Zoned schools: Orange Elementary School (math 69% / reading 67%, grade B+, #267 of 616 statewide, top 44%, 521 students, 53% FRL); Hoover Middle School (math 68% / reading 72%, grade A, #112 of 246 statewide, top 45%, 883 students, 59% FRL); West High School (math 55% / reading 63%, grade C+, #273 of 336 statewide, top 81%, 1,652 students, 62% FRL) — zoned schools at 58% FRL track the district average.
- Zoned-school proficiency averages 66% at this address vs 52% district-wide (+14 pts) — the actual schools serving this property are materially stronger than the Waterloo Community School District average implies; a family-tenant draw the district grade alone would hide.
- Market conditions: Rents rising (+2.7%/yr); 126 active listings in the ZIP; 287 units permitted in Black Hawk County in 2024 (67 in 5+ unit buildings).
Forward outlook
- Local home prices are declining (-3.0%/yr); year-one equity from $964 of loan paydown is wiped out by about $4k of value loss. Plan a longer hold.
- Black Hawk County population projected at +10% by 2050 — modest demand growth; plan on rents tracking national, not racing it.
Negotiation context
- Only 2 days on market — expect competitive offers; lowballing is unlikely to land.
Risks & watch-outs
- Watch-outs: built in 1956 — expect roof / HVAC / electrical / plumbing capex.
Questions for the listing agent
- Built in 1956 — when were the roof, HVAC, electrical panel, plumbing, and water heater last replaced?
- Is there a deadline driving the sale (1031 exchange, divorce, estate, relocation)? That informs how much negotiation room exists.
- Schools are D-rated, which usually means shorter tenancies and higher turnover. Who's the typical renter profile here, and what's been the actual vacancy rate?
- The area grade is low — what's the realistic commute time and amenity access for the typical tenant pool here? Any planned neighborhood developments (good or bad) we should know about?
- What's the average days-on-market for RENTAL listings here right now (not sales)? A rising rental-DOM trend means longer vacancies and softer asking-rent achievability than the comps imply.
- What's the recent tenant-quality profile in this submarket — average credit score on applications, eviction rate, late-payment / NSF rate, and stable-employment percentage? A property-management company in the area should have these aggregated.
- How much new for-sale + rental construction is in the pipeline within 1–3 miles? Heavy new supply typically softens prices + rents 12–24 months out; constrained supply supports both.
Investment metrics
- 1% rule
- 0.81% ✗
- Cap rate
- 6.31%
- Cash-on-cash
- 0.07%
- DSCR
- 1.00
- GRM
- 10.3
CMA / ARV
- ARV (median comp)
- $143,397
- List price
- $139,500
- Delta
- -2.72%
- Verdict
- FAIR
- Comps
- 19 within 1.0 mi
Show comp detail 4 sales within ~0.75 mi
| Address | Dist | Beds/Ba | Sqft | Sold | Price | $/sf | Match |
|---|---|---|---|---|---|---|---|
| 410 3rd St | 0.00mi | 3/1.0 | 820 (0%) | 1mo | $142,000 | $173 | 100 |
| 113 Oak St | 0.21mi | 3/1.0 | 864 (+5%) | 5mo | $85,000 | $98 | 77 |
| 4326 E Washburn Rd | 0.18mi | 2/1.0 (-1) | 864 (+5%) | 8mo | $153,000 | $177 | 71 |
| 407 3rd St | 0.04mi | 2/1.5 (-1) | 883 (+8%) | 10mo | $179,990 | $204 | 70 |
Match score weights: distance 35% · size 25% · config 20% · recency 20%. Top-matched comps best support the ARV.
Projected returns pro-forma
-3.0% appreciation · 2.7% rent growth · sell at horizon
- IRR
- -16.5%
- Equity multiple
- 0.42×
- Total profit
- $-22,835
- Equity at exit
- $20,800
- IRR
- -8.9%
- Equity multiple
- 0.46×
- Total profit
- $-21,207
- Equity at exit
- $12,061
Cash invested: $39,060 (down + closing). Projections, not guarantees.
Landlord ↔ Tenant lean methodology
- Overall (STATE)
- 83 Strongly Landlord-Friendly
- State Iowa
- 83 Strongly Landlord-Friendly · R+6
- County
- — inherits STATE
- City
- — inherits STATE
ZIP-level market 50702
- Rents YoY
- 2.7%
- Active inventory
- 126
- Price-to-rent
- 10.3×
Monthly cashflow live
- Estimated rent
- $1,131 medium interval (Pro) →
- Mortgage (P&I)
- −$732
- Tax from tax record
- −$102 /mo · $1,218/yr
- Insurance
- −$58
- HOA
- −$0
- Vacancy / Maint / Mgmt
- −$237
- Net cashflow
- $2
Break-even live
Sensitivity live
| Price | -10% $81 | -5% $42 | +0% $2 | +5% $-37 | +10% $-77 |
|---|---|---|---|---|---|
| Rent | -10% $-87 | -5% $-42 | +0% $2 | +5% $47 | +10% $92 |
| Rate | -1.0pp $72 | -0.5pp $38 | base $2 | +0.5pp $-34 | +1.0pp $-71 |
UW: 25.0% down · 7.5% · 30yr · 1.5% tax · 5.0% vac · 8.0% maint · 8.0% mgmt
Financing live
Cash to close
- Down payment
- $34,875
- Closing costs
- $4,185
- Reserves months
- —
- Total cash needed
- —
Loan-product check · same deal, 3 products live
Conventional
25% down · 7.5% · 30yr
- Down + closing
- —
- Monthly P&I
- —
- Monthly cashflow
- —
- DSCR
- —
- Eligible?
- —
Personal DTI + credit; lowest rate.
DSCR
20% down · 8.5% · 30yr
- Down + closing
- —
- Monthly P&I
- —
- Monthly cashflow
- —
- DSCR
- —
- Eligible?
- —
No personal income docs; deal must DSCR.
Hard money
10% down · 12.0% · 12mo
- Down + closing
- —
- Monthly P&I
- —
- Monthly cashflow
- —
- DSCR
- —
- Eligible?
- —
Short-term bridge; refi at stabilization.
Listing history 2 events
-
2026-05-08status Pending 802-char remark
-
2026-05-06$139,500 Active 802-char remark
ⓘ Source: listings_history table (triggers on properties + properties_extension) + one-shot
backfill from property_details.listing_events for pre-trigger history.
Tax reassessment forecast IA · Partial reset (capped growth)
- Current annual tax
- $1,218 · $102/mo
- Projected year-2 tax
- $1,704 · $142/mo
- Expected delta
- +$486/yr (+$41/mo · 39.9%)
ⓘ Screening estimate from a state-policy table — verify with the county assessor before closing.
Climate risk First Street
- Flood 1/10 Low FEMA zone X (unshaded) · 0% chance over 30 yrs
- Wildfire 1/10 Low
- Heat 3/10 Moderate 7 d/yr ≥101°F today · 15 d/yr by 30 yrs out
- Wind 2/10 Low
- Air quality 1/10 Low 0 unhealthy d/yr today · 0 by 30 yrs out
Nearby sold comps map
Loading sold comps map…
Walkable amenities ~0.75 mi
Loading nearby amenities…
Taxation est. · year 1
- Rental income
- $13,570
- − Mortgage interest
- −$7,814
- − Property taxes
- −$1,218
- − Insurance
- −$698
- − Repairs & maintenance
- −$1,086
- − Management
- −$1,086
- − Depreciation
- −$4,058
- Taxable loss
- −$2,389
- Est. tax savings @ 24.0%
- +$573
- After-tax cash flow
- $599/yr
For passive investors: Depreciation is non-cash, so a rental often shows a tax loss while cash-flowing — sheltering income. Rental losses are passive: they offset passive income freely, and up to $25,000/yr can offset ordinary (W-2) income if you actively participate and your MAGI is under $100k (phasing out to $0 by $150k); unused losses carry forward. On sale, claimed depreciation is recaptured at up to 25%, and gains may owe capital-gains tax (a 1031 exchange can defer both). Figures are a year-1 estimate at your 24.0% rate — not tax advice; consult a CPA.
Schools (NCES district)
- District
- Waterloo Community School District
- NCES district ID
- 1930480
- Math proficiency
- 50% ▼ -4.00%
- Reading proficiency
- 54% ▲ 1.00%
- Median HH income
- $42,545
- Composite
- 43.72/100
- National rank
- #2950
- State rank
- #276 of 289 in IA
Livability — Washburn
- Score
- 68/100
- State rank
- #442
- US rank
- #9694
Category grades
Schools grade is shown separately in the Schools card above.
Census & demographics
- Census place
- Washburn, IA
- County
- Black Hawk County · 112,933 people
- Metro
- Waterloo-Cedar Falls, IA
- Population (ZIP)
- 20,882
- Household income
- $62,021
- Rent vs Own
- Severe rent burden
- 479.0
Population outlook (Black Hawk County) Hauer SSP2
- Today (2025)
- 139,716 people
- By 2030
- 142,853 · +2.2%
- By 2040
- 147,843 · +5.8%
- By 2050
- 153,247 · +9.7%
- By 2075
- 167,977 · +20.2%
- By 2100
- 177,320 · +26.9%
Race, ethnicity, and origin ACS 2023
- Neighborhood character
- Predominantly White (68%)
- Race & ethnicity
- White 68% Black 14% Hispanic / Latino 9% Two or more races 5% Asian 3% Pacific Islander 3% Native American 1%
- Hispanic origin (detail)
- Mexican 6% Puerto Rican 1%
- Common ancestry
- American 5% Portuguese 3% Lithuanian 2%
- Foreign-born
- 15% · Canada, Philippines
- Languages at home
- 79% English-only · Spanish 7% Russian/Polish/Slavic 6% Other Asian/Pacific 4%
Political lean MEDSL · Black Hawk
- 2024 margin
- Toss-up / Even · D 50.0% · R 48.8% · Other 1.2%
- 2008→2024 swing
- -21.3pp toward R · 2008: 22.4pp · 2024: 1.2pp
- All cycles
- 2024: D+1.2 2020: D+9.0 2016: D+7.3 2012: D+20.0 2008: D+22.4
Not yet ingested
- Civics
- —
Market trends
- HPI YoY
- ▼ -110.86%
- Current HPI
- 155.4447
- Rent YoY
- ▲ 2.70%
- Metro
- Waterloo-Cedar Falls, IA
- State GDP YoY
- ▲ 2.48%
- F500 in state
- 4
Industry mix (Fortune 500 HQ in IA)
| Industry | F500 HQs | Revenue |
|---|---|---|
| Financial Services | 1 | $16B |
|
||
| Retail / Convenience | 1 | $15B |
|
||
Price history
+1.8% since first listed4 events — show timeline
- 2026-06-09 Sold (Public Records) $142,000 Public Records
- 2026-06-04 Sold (MLS) $142,000 NEIRBR as distributed by MLS GRID
- 2026-05-08 Pending — NEIRBR as distributed by MLS GRID
- 2026-05-06 Listed $139,500 NEIRBR as distributed by MLS GRID
Property tax history
+1.3%/yrLatest (2025): $1,218 · +6.5% YoY. Source: county tax records.
Cash-flow waterfall
monthlySold comps — $/sqft
last 12 mo · ≤1 miLoading sold comps…