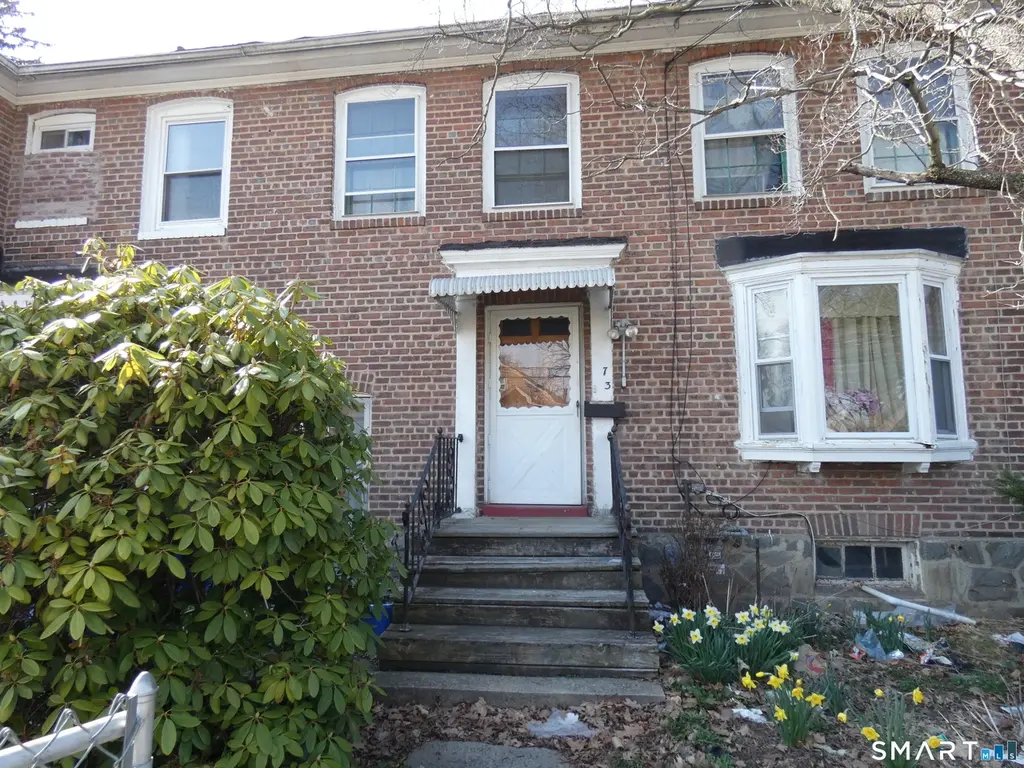
73 Goddard Ave · Bridgeport, CT
Flood risk 6/10 · Moderate
- FEMA flood zone
- X (unshaded)
- Chance of flooding over 30 yrs
- 0.72%
- Est. flood insurance / yr
- $473 – $860
Fire risk 1/10 · Minimal
- Est. fire insurance / yr
- $829 – $1,539
Heat risk 6/10 · Moderate
- Hot days now (above 97°F)
- 7 days/yr
- Hot days in 30 yrs
- 15 days/yr
Wind risk 6/10 · Moderate
- Chance of severe wind over 30 yrs
- 41.0%
Air-quality risk 4/10 · Minor
- Unhealthy air days now
- 5 days/yr
- Unhealthy air days in 30 yrs
- 7 days/yr
Risk factors via First Street. Map © Google.
Why this score? — see what drove the B- grade
The composite is a weighted blend of 9 inputs, each scored 0–100. Each bar is that input's sub-score; the figure is the points it added to the 100-point composite (weight × sub-score).
- Cash flow +30.0/30.0
- 1% rule +10.0/10.0
- DSCR +10.0/10.0
- ARV discount +7.5/15.0
- Livability +4.0/5.0
- Rent growth +2.5/5.0
- Condition / age +2.5/5.0
- Schools +1.2/10.0
- Appreciation +0.0/10.0
$149,000
🖨 Deal sheet 📄 Offer letter ✓ Due diligence
Listing remarks
Three-bedroom, 1.5-bath brick row house conveniently located within walking distance to Beardsley Park, restaurants, and shopping, and just a short drive to the train station and all major highways. This property is in need of cosmetic updates and repairs but offers excellent potential and equity for both owner-occupants and investors. The main level features a living room, dining room, kitchen, half bath, and access to a full basement providing ample storage space. The second level offers three spacious bedrooms and a generously sized full bathroom. Property to be sold in AS IS condition. Subject to Probate Court Approval and possible appeal period. CASH or CONVENTIONAL financing ONLY! *
Key facts
- Ample storage space
- Brick row house
- 1,742 sq ft lot
Tags
Neighborhood map
What this means for you Summary
Snapshot
- This is a 3-bed/1.0-bath single-family listed at $149k.
Deal economics
- At list price, monthly cash flow is $670 ($8k/yr) — positive.
- The deal already cash-flows at list — no discount required.
- Meets the 1% rule at list price ($2k rent vs $149k).
- Recommended offer: $147k (1.5% below list) — sets the bar for market timing.
- Cap rate 11.7% vs local median 5.0% in Bridgeport — top-decile yield for the area; either an underpriced asset or a hidden risk that comps aren't pricing in. Stress-test before assuming the spread holds.
Location & tenants
- Location reads 81/100 on livability (#15 in CT, #1,374 nationally) — a professional / high-income tenant draw. Strengths: amenities A+, commute A+, health & safety A+; Watch: crime C-, employment D+, schools D-.
- Bridgeport School District (urban): math 9% / reading 19% proficiency, ranked #151 of 153 in CT (top 99%) — low school quality limits family demand, transient renter base, plan for 1-2y turnover; 97% free/reduced lunch — lower-income household profile, screen leases tightly.
- Market conditions: 68 active listings in the ZIP; 40 comparable units currently listed for rent nearby; rentals at typical pace (median 24d on market — plan ~3-4 weeks tenant-placement turnaround); 48% of comp listings sitting > 30 days — soft ceiling on asking rent; 852 units permitted in Greater Bridgeport Planning Region in 2024 (698 in 5+ unit buildings).
- At $2,232/mo this rent would consume 52% of the median local household income ($52k/yr) (locally 1368% of renters already pay >50% of income on rent) — very limited rent-growth headroom before tenants either downsize or default.
Forward outlook
- Local home prices are declining (-3.0%/yr); year-one equity from $1k of loan paydown is wiped out by about $4k of value loss. Plan a longer hold.
- At projected returns (-3.0% appreciation + 3.0% rent growth), your $42k cash investment doubles in ~7 years — after that, you're playing with house money.
Negotiation context
- It's been on market 16 days — a 2% lower offer ($147k) is reasonable based on typical stale-listing flexibility.
- 2 sale attempts since 34y ago with the ask held roughly flat each time — persistent listings suggest the price (not the market) is what's stuck; bring a comps-based counter.
- Current owner paid $45k; list at $149k implies a 231% gain — meaningful room to come down on a strong offer.
Risks & watch-outs
- Watch-outs: built in 1917 — expect roof / HVAC / electrical / plumbing capex.
- Climate carrying-cost: major flood risk; major wind risk, 41% chance of damaging wind over 30y; extreme-heat days projected 7→15/yr by 2055 (HVAC capex compounding) — expect insurance premiums to compound above CPI over the hold.
Questions for the listing agent
- Built in 1917 — when were the roof, HVAC, electrical panel, plumbing, and water heater last replaced?
- Is there a deadline driving the sale (1031 exchange, divorce, estate, relocation)? That informs how much negotiation room exists.
- Schools are D-rated, which usually means shorter tenancies and higher turnover. Who's the typical renter profile here, and what's been the actual vacancy rate?
- What's the average days-on-market for RENTAL listings here right now (not sales)? A rising rental-DOM trend means longer vacancies and softer asking-rent achievability than the comps imply.
- What's the recent tenant-quality profile in this submarket — average credit score on applications, eviction rate, late-payment / NSF rate, and stable-employment percentage? A property-management company in the area should have these aggregated.
- How much new for-sale + rental construction is in the pipeline within 1–3 miles? Heavy new supply typically softens prices + rents 12–24 months out; constrained supply supports both.
Investment metrics
- 1% rule
- 1.50% ✓
- Cap rate
- 11.69%
- Cash-on-cash
- 19.27%
- DSCR
- 1.86
- GRM
- 5.6
CMA / ARV
- ARV (on-the-fly)
- $304,800
- Comps found
- 12
Show comp detail 12 sales within ~0.75 mi
| Address | Dist | Beds/Ba | Sqft | Sold | Price | $/sf | Match |
|---|---|---|---|---|---|---|---|
| 202 Goddard Ave | 0.12mi | 3/1.5 | 1,240 (+3%) | 6mo | $280,000 | $226 | 82 |
| 282 Horace St | 0.25mi | 3/1.0 | 1,056 (-12%) | 3mo | $285,000 | $270 | 66 |
| 142 Palm St | 0.29mi | 3/1.5 | 1,080 (-10%) | 2mo | $375,000 | $347 | 66 |
| 46 York St | 0.30mi | 2/1.0 (-1) | 1,332 (+11%) | 1mo | $306,000 | $230 | 62 |
| 366 Dover St | 0.58mi | 3/2.5 | 1,239 (+3%) | 0mo | $275,000 | $222 | 61 |
| 206 Remington St | 0.62mi | 3/1.0 | 1,124 (-6%) | 0mo | $300,000 | $267 | 60 |
| 398 Dover St | 0.60mi | 3/2.5 | 1,190 (-1%) | 8mo | $285,000 | $239 | 59 |
| 291 Stillman St | 0.46mi | 3/2.0 | 1,106 (-8%) | 6mo | $225,000 | $203 | 56 |
| 263 Brooks St | 0.61mi | 3/1.0 | 1,297 (+8%) | 7mo | $330,000 | $254 | 52 |
| 252 Shelton St | 0.62mi | 3/2.0 | 1,103 (-8%) | 3mo | $280,000 | $254 | 51 |
| 45 Birdsey St | 0.70mi | 3/1.5 | 1,320 (+10%) | 2mo | $360,000 | $273 | 47 |
| 11 Bell St | 0.69mi | 3/2.0 | 1,352 (+13%) | 7mo | $180,000 | $133 | 37 |
Match score weights: distance 35% · size 25% · config 20% · recency 20%. Top-matched comps best support the ARV.
Projected returns pro-forma
-3.0% appreciation · 3.0% rent growth · sell at horizon
- IRR
- 11.2%
- Equity multiple
- 1.45×
- Total profit
- $18,593
- Equity at exit
- $22,216
- IRR
- 20.3%
- Equity multiple
- 2.71×
- Total profit
- $71,423
- Equity at exit
- $12,883
Cash invested: $41,720 (down + closing). Projections, not guarantees.
Landlord ↔ Tenant lean methodology
- Overall (STATE)
- 27 Tenant-Leaning
- State Connecticut
- 27 Tenant-Leaning · D+7
- County
- — inherits STATE
- City
- — inherits STATE
ZIP-level market 06610
- Home prices YoY
- -7.5%
- Active inventory
- 68
- Price-to-rent
- 5.6×
Monthly cashflow live
- Estimated rent
- $2,232 high interval (Pro) →
- Mortgage (P&I)
- −$781
- Tax from tax record
- −$250 /mo · $2,997/yr
- Insurance
- −$62
- HOA
- −$0
- Vacancy / Maint / Mgmt
- −$469
- Net cashflow
- $670
Break-even live
UW: 25.0% down · 7.5% · 30yr · 1.5% tax · 5.0% vac · 8.0% maint · 8.0% mgmt
Financing live
Cash to close
- Down payment
- $37,250
- Closing costs
- $4,470
- Reserves months
- —
- Total cash needed
- —
Loan-product check · same deal, 3 products live
Conventional
25% down · 7.5% · 30yr
- Down + closing
- —
- Monthly P&I
- —
- Monthly cashflow
- —
- DSCR
- —
- Eligible?
- —
Personal DTI + credit; lowest rate.
DSCR
20% down · 8.5% · 30yr
- Down + closing
- —
- Monthly P&I
- —
- Monthly cashflow
- —
- DSCR
- —
- Eligible?
- —
No personal income docs; deal must DSCR.
Hard money
10% down · 12.0% · 12mo
- Down + closing
- —
- Monthly P&I
- —
- Monthly cashflow
- —
- DSCR
- —
- Eligible?
- —
Short-term bridge; refi at stabilization.
Rent comps 40 comps
| Address | Beds | Baths | Sqft | Rent | $/sqft | DOM | Units | Dist |
|---|---|---|---|---|---|---|---|---|
| 126 Goddard Ave Unit B Bridgeport, CT | 2.0 | 1.0 | 1000 | $1,995 | $2.00 | 3d | 1 | 0.07mi |
| 22-26 Carver St Bridgeport, CT | 2.0 | 1.0 | 1094 | $2,200 | $2.01 | 12d | 1 | 0.12mi |
| 36 Carver St Unit 1 Bridgeport, CT | 2.0 | 1.0 | 1094 | $2,200 | $2.01 | 24d | 1 | 0.12mi |
| 329 Orchard St Unit 2ND FLOOR Bridgeport, CT | 2.0 | 1.0 | 990 | $1,800 | $1.82 | 44d | 1 | 0.14mi |
| 231 Goddard Ave Unit 2ND Bridgeport, CT | 2.0 | 1.0 | 950 | $2,100 | $2.21 | 3d | 1 | 0.17mi |
| 672 Brooks St Bridgeport, CT | 4.0 | 1.0 | 1232 | $3,300 | $2.68 | 14d | 1 | 0.20mi |
| 116 Hastings St Bridgeport, CT | 2.0 | 1.5 | 857 | $2,400 | $2.80 | 14d | 1 | 0.24mi |
| 587 Brooks St Unit !st floor Bridgeport, CT | 3.0 | 2.0 | 1500 | $2,400 | $1.60 | 44d | 1 | 0.28mi |
| 545 Park St Bridgeport, CT | 3.0 | 1.0 | 1176 | $2,050 | $1.74 | 44d | 1 | 0.34mi |
| 1333 E Main St Apt 1 Bridgeport, CT | 2.0 | 1.0 | 700 | $1,700 | $2.43 | 3d | 1 | 0.38mi |
| 1333 E Main St #5 Bridgeport, CT | 2.0 | 1.0 | 700 | $1,650 | $2.36 | 3d | 1 | 0.38mi |
| 476 Brooks St Unit 2-478 Bridgeport, CT | 2.0 | 1.0 | 963 | $1,750 | $1.82 | 24d | 1 | 0.38mi |
| 957 William St Unit B Bridgeport, CT | 2.0 | 1.0 | 766 | $1,700 | $2.22 | 44d | 1 | 0.38mi |
| 438 Park St Unit 1 Bridgeport, CT | 3.0 | 1.0 | 1196 | $2,900 | $2.42 | 3d | 1 | 0.41mi |
| 80 Huntington Rd Bridgeport, CT | 3.0 | 1.0 | 1100 | $2,300 | $2.09 | 44d | 1 | 0.45mi |
| 1254 Pembroke St Unit 1st Floor Bridgeport, CT | 2.0 | 1.0 | 738 | $1,850 | $2.51 | 14d | 1 | 0.47mi |
| 1248 Pembroke St Bridgeport, CT | 3.0 | 1.0 | 1000 | $1,850 | $1.85 | 24d | 1 | 0.47mi |
| 1248 Pembroke St Unit First Bridgeport, CT | 3.0 | 1.0 | 1000 | $1,950 | $1.95 | 21d | 1 | 0.47mi |
| 619 Shelton St Fl R Bridgeport, CT | 2.0 | 1.0 | 837 | $2,050 | $2.45 | 44d | 1 | 0.49mi |
| 268 Bond St Bridgeport, CT | 2.0 | 1.0 | 900 | $2,200 | $2.44 | 44d | 1 | 0.52mi |
| 220 Alpine St Unit 222 3rd floor Bridgeport, CT | 2.0 | 1.0 | 900 | $2,000 | $2.22 | 44d | 1 | 0.56mi |
| 371 Dover St Unit 371 Bridgeport, CT | 2.0 | 1.0 | 900 | $2,100 | $2.33 | 44d | 1 | 0.57mi |
| 2156 Seaview Ave Fl LHS Bridgeport, CT | 3.0 | 1.0 | 1000 | $2,400 | $2.40 | 44d | 1 | 0.57mi |
| 46 Hayes St Unit 3 Bridgeport, CT | 2.0 | 1.0 | 992 | $1,900 | $1.92 | 3d | 1 | 0.57mi |
| 530 Jane St Unit 2 Bridgeport, CT | 2.0 | 1.0 | 800 | $2,200 | $2.75 | 44d | 1 | 0.57mi |
| 245 Brooks St Unit 3R Bridgeport, CT | 2.0 | 1.0 | 1000 | $1,750 | $1.75 | 24d | 1 | 0.60mi |
| 54 Remington St Bridgeport, CT | 3.0 | 1.0 | 1004 | $1,900 | $1.89 | 3d | 1 | 0.61mi |
| 184 Park St Bridgeport, CT | 2.0 | 1.0 | 1200 | $2,000 | $1.67 | 44d | 1 | 0.62mi |
| 70 Lindley St Unit 3rd Floor Bridgeport, CT | 2.0 | 1.0 | 800 | $1,980 | $2.48 | 44d | 1 | 0.63mi |
| 1071 Pembroke St Unit 2B Bridgeport, CT | 2.0 | 1.0 | 848 | $1,750 | $2.06 | 21d | 1 | 0.63mi |
| 600 Bond St Unit 113 Bridgeport, CT | 2.0 | 1.0 | 893 | $3,000 | $3.36 | 44d | 1 | 0.63mi |
| 144 Palisade Ave Bridgeport, CT | 3.0 | 1.0 | 1096 | $2,600 | $2.37 | 44d | 1 | 0.65mi |
| 1145 Ogden St Unit 3R Bridgeport, CT | 3.0 | 1.0 | 1000 | $1,695 | $1.70 | 14d | 1 | 0.69mi |
| 183 Livingston Pl #1 Bridgeport, CT | 2.0 | 1.5 | 1175 | $1,950 | $1.66 | 44d | 1 | 0.69mi |
| 282 Texas Ave Unit Nob Bridgeport, CT | 2.0 | 1.0 | 980 | $2,000 | $2.04 | 14d | 1 | 0.71mi |
| 279 Harriet St Bridgeport, CT | 3.0 | 1.5 | 1392 | $3,000 | $2.16 | 24d | 1 | 0.79mi |
| 35 Nob Hill Cir Unit D Bridgeport, CT | 2.0 | 1.0 | 900 | $2,050 | $2.28 | 44d | 1 | 0.81mi |
| 125 Louisiana Ave #125 Bridgeport, CT | 2.0 | 1.0 | 1448 | $1,750 | $1.21 | 44d | 1 | 0.81mi |
| 13 Armstrong Pl Unit 2 Bridgeport, CT | 3.0 | 1.0 | 1029 | $1,700 | $1.65 | 44d | 1 | 0.83mi |
| 333 Ridgefield Ave Bridgeport, CT | 3.0 | 1.0 | 1400 | $2,250 | $1.61 | 3d | 1 | 0.84mi |
Listing history 5 events
-
2026-04-18status Under Contract
-
2026-04-02$149,000 Active
-
1992-06-30soldstatus $45,000
-
1992-06-30soldstatus $45,000
-
1992-04-25$49,950
ⓘ Source: listings_history table (triggers on properties + properties_extension) + one-shot
backfill from property_details.listing_events for pre-trigger history.
Tax reassessment forecast CT · Partial reset (capped growth)
- Current annual tax
- $2,997 · $250/mo
- Projected year-2 tax
- $3,093 · $258/mo
- Expected delta
- +$96/yr (+$8/mo · 3.2%)
ⓘ Screening estimate from a state-policy table — verify with the county assessor before closing.
Climate risk First Street
- Flood 6/10 Major FEMA zone X (unshaded) · 72% chance over 30 yrs
- Wildfire 1/10 Low
- Heat 6/10 Major 7 d/yr ≥97°F today · 15 d/yr by 30 yrs out
- Wind 6/10 Major 41% chance of damaging wind over 30 yrs
- Air quality 4/10 Moderate 5 unhealthy d/yr today · 7 by 30 yrs out
Nearby sold comps map
Loading sold comps map…
Walkable amenities ~0.75 mi
Loading nearby amenities…
Taxation est. · year 1
- Rental income
- $26,781
- − Mortgage interest
- −$8,346
- − Property taxes
- −$2,997
- − Insurance
- −$745
- − Repairs & maintenance
- −$2,142
- − Management
- −$2,142
- − Depreciation
- −$4,335
- Taxable income
- $6,073
- Est. tax owed @ 24.0%
- −$1,458
- After-tax cash flow
- $6,581/yr
For passive investors: Depreciation is non-cash, so a rental often shows a tax loss while cash-flowing — sheltering income. Rental losses are passive: they offset passive income freely, and up to $25,000/yr can offset ordinary (W-2) income if you actively participate and your MAGI is under $100k (phasing out to $0 by $150k); unused losses carry forward. On sale, claimed depreciation is recaptured at up to 25%, and gains may owe capital-gains tax (a 1031 exchange can defer both). Figures are a year-1 estimate at your 24.0% rate — not tax advice; consult a CPA.
Schools (NCES district)
- District
- Bridgeport School District
- NCES district ID
- 0900450
- Math proficiency
- 9% ▼ -7.00%
- Reading proficiency
- 19% ▼ -10.00%
- Median HH income
- $41,507
- Composite
- 12.09/100
- National rank
- #9656
- State rank
- #151 of 153 in CT
Livability — Bridgeport
- Score
- 81/100
- State rank
- #15
- US rank
- #1374
Category grades
Schools grade is shown separately in the Schools card above.
Census & demographics
- Census place
- Bridgeport, CT
- County
- Fairfield County · 765,532 people
- City population
- 149,153
- Metro
- Bridgeport-Stamford-Norwalk, CT
- Population (ZIP)
- 22,020
- Household income
- $51,634
- Rent vs Own
- Severe rent burden
- 1368.0
Population outlook (Greater Bridgeport County) Hauer SSP2
- By 2040
- 365,581
Race, ethnicity, and origin ACS 2023
- Neighborhood character
- Diverse neighborhood (Simpson 0.65)
- Race & ethnicity
- Hispanic / Latino 51% Black 23% White 20% Two or more races 14% Asian 3% Native American 1%
- Hispanic origin (detail)
- Mexican 3% Puerto Rican 30% Dominican 6%
- Common ancestry
- Romanian 4% Estonian 3% Hispanic 2%
- Foreign-born
- 31% · Canada, Jamaica, Vietnam
- Languages at home
- 47% English-only · Spanish 40% Other Indo-European 5% Russian/Polish/Slavic 3%
Political lean MEDSL · Greater Bridgeport
- 2024 margin
- Strong D (+23.3) · D 60.9% · R 37.6% · Other 1.5%
- All cycles
- 2024: D+23.3
Not yet ingested
- Civics
- —
Market trends
- HPI YoY
- ▼ -29.78%
- Current HPI
- 370.1432
- Rent YoY
- —
- Metro
- Bridgeport-Stamford-Norwalk, CT
- State GDP YoY
- ▲ 1.06%
- F500 in state
- 38
Industry mix (Fortune 500 HQ in CT)
| Industry | F500 HQs | Revenue |
|---|---|---|
| Industrial Machinery | 4 | $38B |
|
||
| Insurance | 3 | $71B |
|
||
| Financial Services | 2 | $25B |
|
||
| Transportation / Logistics | 2 | $18B |
|
||
| Healthcare | 1 | $247B |
|
||
| Telecommunications | 1 | $55B |
|
||
Price history
+198.3% since first listed5 events — show timeline
- 2026-04-18 Pending — Smart MLS
- 2026-04-02 Listed $149,000 Smart MLS
- 1992-06-30 Sold (Public Records) $45,000 Public Records
- 1992-06-30 Sold (MLS) $45,000 Smart MLS
- 1992-04-25 Listed $49,950 Smart MLS
Property tax history
-0.8%/yrLatest (2023): $2,997 · +0.0% YoY. Source: county tax records.
Cash-flow waterfall
monthlySold comps — $/sqft
last 12 mo · ≤1 miLoading sold comps…