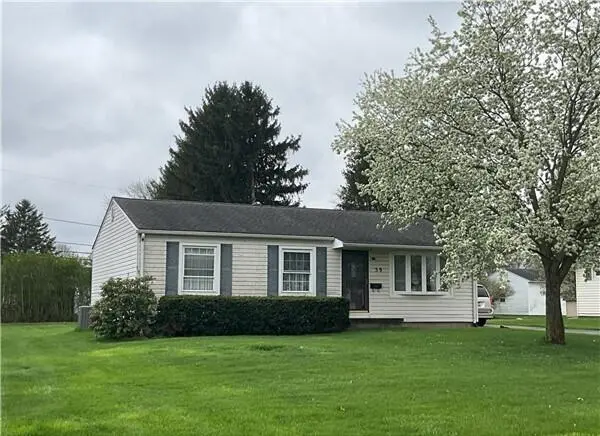
59 Carey Ln · Heath, OH
Flood risk 1/10 · Minimal
- FEMA flood zone
- X (unshaded)
- Chance of flooding over 30 yrs
- 0.0%
- Est. flood insurance / yr
- $473 – $860
Fire risk 1/10 · Minimal
- Est. fire insurance / yr
- $713 – $1,323
Heat risk 3/10 · Minor
- Hot days now (above 99°F)
- 7 days/yr
- Hot days in 30 yrs
- 18 days/yr
Wind risk 2/10 · Minimal
- Chance of severe wind over 30 yrs
- 0.0%
Air-quality risk 2/10 · Minimal
- Unhealthy air days now
- 1 days/yr
- Unhealthy air days in 30 yrs
- 2 days/yr
Risk factors via First Street. Map © Google.
Why this score? — see what drove the B+ grade
The composite is a weighted blend of 9 inputs, each scored 0–100. Each bar is that input's sub-score; the figure is the points it added to the 100-point composite (weight × sub-score).
- Cash flow +30.0/30.0
- ARV discount +15.0/15.0
- DSCR +10.0/10.0
- 1% rule +9.1/10.0
- Schools +5.5/10.0
- Livability +3.6/5.0
- Rent growth +2.5/5.0
- Condition / age +2.5/5.0
- Appreciation +0.0/10.0
$125,000
🖨 Deal sheet 📄 Offer letter ✓ Due diligence
Listing remarks
Online Auction, the list price reflects the RESERVE (minimum Bid) of $125,000. The Auction ends at 7:00PM Thursday, June 25th, 2026. First time on the market since 1967! This home is located on a quiet dead-end street in the Heath City School district, and is ready for your vision. The owner has kept up with most systems and mechanicals over the years. There are hardwood floors in the living room and all bedrooms. Large . 3 acre lot, walking distance to Stevenson Elementary. Large 2-car block garage. Don't miss this opportunity. Agents, please see 'A2A' remarks. Listing Agent is related to the Seller, and is POA for the Seller.
Key facts
- 0.3 acre lot
- 2 garage spots
- Built 1965
Property features AI
Finance
- Other: Auction and standard listing conditions
Exterior
- Parking: Detached 2-car garage with garage door opener
- Utilities: Public water; Public sewer
- Home design: Single-family home; One story; Built in 1965; No shared walls
- Construction: Block foundation
- Exterior features: Patio
Interior
- Bedrooms: Three main-level bedrooms
- Flooring: Wood flooring; Carpet; Vinyl flooring
- Bathrooms: Two full bathrooms
- Heating & cooling: Forced air heating; Central air conditioning
- Interior features: Full basement; Insulated windows
Neighborhood map
What this means for you Summary
Snapshot
- This is a 3-bed/1.0-bath single-family listed at $125k.
Deal economics
- At list price, monthly cash flow is $492 ($6k/yr) — positive.
- The deal already cash-flows at list — no discount required.
- Meets the 1% rule at list price ($2k rent vs $125k).
- Recommended offer: $123k (1.5% below list) — sets the bar for market timing.
- Cap rate 11.0% vs local median 2.5% in Heath — top-decile yield for the area; either an underpriced asset or a hidden risk that comps aren't pricing in. Stress-test before assuming the spread holds.
Location & tenants
- Location reads 72/100 on livability (#353 in OH) — a middle-class / working-renter tenant base. Strengths: cost of living A+, housing A+, schools B+; Watch: crime D+, amenities F, commute F.
- Heath City (suburban): math 62% / reading 67% proficiency, ranked #226 of 656 in OH (top 34%) — acceptable for families but not a draw, mixed tenant base, ~2y average lease.
- Market conditions: 61 active listings in the ZIP; 6 comparable units currently listed for rent nearby; rentals leasing fast (median 4d on market — plan ~1-2 weeks tenant-placement turnaround); solid renter incomes; 159 units permitted in Licking County in 2024 (0 in 5+ unit buildings).
Forward outlook
- Local home prices are declining (-3.0%/yr); year-one equity from $864 of loan paydown is wiped out by about $4k of value loss. Plan a longer hold.
- At projected returns (-3.0% appreciation + 3.0% rent growth), your $35k cash investment doubles in ~8 years — after that, you're playing with house money.
Negotiation context
- It's been on market 21 days — a 2% lower offer ($123k) is reasonable based on typical stale-listing flexibility.
Questions for the listing agent
- Built in 1965 — when were the roof, HVAC, electrical panel, plumbing, and water heater last replaced?
- Is there a deadline driving the sale (1031 exchange, divorce, estate, relocation)? That informs how much negotiation room exists.
- Schools are B-rated — typically a magnet for longer-tenancy family renters. What's the average tenant stay here, and is there a school-zone premium baked into asking?
- Crime grade is D in this area — have there been break-ins, vandalism, or insurance claims at this property in the last 3 years? What carrier currently insures it and at what premium?
- What's the average days-on-market for RENTAL listings here right now (not sales)? A rising rental-DOM trend means longer vacancies and softer asking-rent achievability than the comps imply.
- What's the recent tenant-quality profile in this submarket — average credit score on applications, eviction rate, late-payment / NSF rate, and stable-employment percentage? A property-management company in the area should have these aggregated.
- How much new for-sale + rental construction is in the pipeline within 1–3 miles? Heavy new supply typically softens prices + rents 12–24 months out; constrained supply supports both.
Investment metrics
- 1% rule
- 1.41% ✓
- Cap rate
- 11.02%
- Cash-on-cash
- 16.88%
- DSCR
- 1.75
- GRM
- 5.9
CMA / ARV
- ARV (on-the-fly)
- $225,069
- Comps found
- 12
Show comp detail 12 sales within ~0.75 mi
| Address | Dist | Beds/Ba | Sqft | Sold | Price | $/sf | Match |
|---|---|---|---|---|---|---|---|
| 56 Swainford Dr | 0.30mi | 3/1.0 | 1,118 (-1%) | 7mo | $238,000 | $213 | 78 |
| 235 Cynthia St | 0.41mi | 3/1.0 | 1,127 (-0%) | 7mo | $257,900 | $229 | 74 |
| 70 Fieldpoint Rd | 0.33mi | 3/2.0 | 1,122 (-1%) | 7mo | $200,000 | $178 | 73 |
| 18 Swainford Dr | 0.32mi | 4/2.0 (+1) | 1,152 (+2%) | 1mo | $289,000 | $251 | 72 |
| 171 Cynthia St | 0.33mi | 3/2.0 | 1,166 (+3%) | 6mo | $295,000 | $253 | 71 |
| 521 Partridge Rd | 0.36mi | 3/1.5 | 1,066 (-6%) | 4mo | $212,000 | $199 | 68 |
| 1223 W Main St | 0.47mi | 2/2.0 (-1) | 1,136 (+0%) | 2mo | $192,500 | $169 | 67 |
| 1195 W Main St | 0.48mi | 3/1.0 | 1,202 (+6%) | 1mo | $200,000 | $166 | 66 |
| 243 Fieldpoint Rd | 0.71mi | 3/1.5 | 1,152 (+2%) | 3mo | $216,000 | $188 | 59 |
| 231 Fieldpoint Rd | 0.69mi | 3/2.0 | 1,181 (+4%) | 2mo | $220,000 | $186 | 55 |
| 39 N 31st St | 0.65mi | 3/1.0 | 1,232 (+9%) | 5mo | $236,600 | $192 | 51 |
| 67 N 31st St | 0.70mi | 3/1.0 | 1,290 (+14%) | 0mo | $275,000 | $213 | 44 |
Match score weights: distance 35% · size 25% · config 20% · recency 20%. Top-matched comps best support the ARV.
Projected returns pro-forma
-3.0% appreciation · 3.0% rent growth · sell at horizon
- IRR
- 8.1%
- Equity multiple
- 1.32×
- Total profit
- $11,154
- Equity at exit
- $18,638
- IRR
- 17.4%
- Equity multiple
- 2.44×
- Total profit
- $50,301
- Equity at exit
- $10,808
Cash invested: $35,000 (down + closing). Projections, not guarantees.
Landlord ↔ Tenant lean methodology
- Overall (STATE)
- 73 Landlord-Friendly
- State Ohio
- 73 Landlord-Friendly · R+6
- County
- — inherits STATE
- City
- — inherits STATE
ZIP-level market 43056
- Active inventory
- 61
- Price-to-rent
- 5.9×
Monthly cashflow live
- Estimated rent
- $1,768 high interval (Pro) →
- Mortgage (P&I)
- −$656
- Tax from tax record
- −$196 /mo · $2,357/yr
- Insurance
- −$52
- HOA
- −$0
- Vacancy / Maint / Mgmt
- −$371
- Net cashflow
- $492
Break-even live
UW: 25.0% down · 7.5% · 30yr · 1.5% tax · 5.0% vac · 8.0% maint · 8.0% mgmt
Financing live
Cash to close
- Down payment
- $31,250
- Closing costs
- $3,750
- Reserves months
- —
- Total cash needed
- —
Loan-product check · same deal, 3 products live
Conventional
25% down · 7.5% · 30yr
- Down + closing
- —
- Monthly P&I
- —
- Monthly cashflow
- —
- DSCR
- —
- Eligible?
- —
Personal DTI + credit; lowest rate.
DSCR
20% down · 8.5% · 30yr
- Down + closing
- —
- Monthly P&I
- —
- Monthly cashflow
- —
- DSCR
- —
- Eligible?
- —
No personal income docs; deal must DSCR.
Hard money
10% down · 12.0% · 12mo
- Down + closing
- —
- Monthly P&I
- —
- Monthly cashflow
- —
- DSCR
- —
- Eligible?
- —
Short-term bridge; refi at stabilization.
Rent comps 6 comps
| Address | Beds | Baths | Sqft | Rent | $/sqft | DOM | Units | Dist |
|---|---|---|---|---|---|---|---|---|
| 1200 Hollar Ln Newark, OH | 2.0 | 1.0 | 1156 | $1,550 | $1.34 | 19d | 1 | 0.19mi |
| 507 S 30th St Apt D Heath, OH | 2.0 | 1.0 | 900 | $1,195 | $1.33 | 1d | 1 | 0.23mi |
| 120 S 32nd St Newark, OH | 2.0 | 1.0 | 1100 | $2,900 | $2.64 | 3d | 1 | 0.26mi |
| 718 Rice St Newark, OH | 2.0 | 1.0 | 924 | $1,100 | $1.19 | 1d | 1 | 0.99mi |
| 718 Rice St Newark, OH | 2.0 | 1.0 | 924 | $1,100 | $1.19 | 23d | 1 | 0.99mi |
| 25 N Chalfant Rd Newark, OH | 3.0 | 1.0 | 1264 | $1,650 | $1.31 | 1d | 1 | 1.23mi |
Listing history 15 events
-
2026-06-18days on market $125,000 Active 21 DOM
-
2026-06-17days on market $125,000 Active 20 DOM
-
2026-06-16days on market $125,000 Active 19 DOM
-
2026-06-15days on market $125,000 Active 18 DOM
-
2026-06-13days on market $125,000 Active 16 DOM
-
2026-06-13days on market $125,000 Active 15 DOM
-
2026-06-09days on market $125,000 Active 12 DOM
-
2026-06-08days on market $125,000 Active 11 DOM
-
2026-06-07days on market $125,000 Active 10 DOM
-
2026-06-05days on market $125,000 Active 7 DOM
-
2026-06-03days on market $125,000 Active 6 DOM
-
2026-06-02days on market $125,000 Active 5 DOM
-
2026-06-01days on market $125,000 Active 4 DOM
-
2026-05-31days on market $125,000 Active 3 DOM
-
2026-05-20historical $125,000
ⓘ Source: listings_history table (triggers on properties + properties_extension) + one-shot
backfill from property_details.listing_events for pre-trigger history.
Tax reassessment forecast OH · Partial reset (capped growth)
- Current annual tax
- $2,357 · $196/mo
- Projected year-2 tax
- $2,357 · $196/mo
- Expected delta
- $0/yr ($0/mo · 0.0%)
ⓘ Screening estimate from a state-policy table — verify with the county assessor before closing.
Climate risk First Street
- Flood 1/10 Low FEMA zone X (unshaded) · 0% chance over 30 yrs
- Wildfire 1/10 Low
- Heat 3/10 Moderate 7 d/yr ≥99°F today · 18 d/yr by 30 yrs out
- Wind 2/10 Low 0% chance of damaging wind over 30 yrs
- Air quality 2/10 Low 1 unhealthy d/yr today · 2 by 30 yrs out
Nearby sold comps map
Loading sold comps map…
Walkable amenities ~0.75 mi
Loading nearby amenities…
Taxation est. · year 1
- Rental income
- $21,210
- − Mortgage interest
- −$7,002
- − Property taxes
- −$2,357
- − Insurance
- −$625
- − Repairs & maintenance
- −$1,697
- − Management
- −$1,697
- − Depreciation
- −$3,636
- Taxable income
- $4,197
- Est. tax owed @ 24.0%
- −$1,007
- After-tax cash flow
- $4,901/yr
For passive investors: Depreciation is non-cash, so a rental often shows a tax loss while cash-flowing — sheltering income. Rental losses are passive: they offset passive income freely, and up to $25,000/yr can offset ordinary (W-2) income if you actively participate and your MAGI is under $100k (phasing out to $0 by $150k); unused losses carry forward. On sale, claimed depreciation is recaptured at up to 25%, and gains may owe capital-gains tax (a 1031 exchange can defer both). Figures are a year-1 estimate at your 24.0% rate — not tax advice; consult a CPA.
Schools (NCES district)
- District
- Heath City
- NCES district ID
- 3904411
- Math proficiency
- 62% ▼ -8.00%
- Reading proficiency
- 67% ▼ -2.00%
- Median HH income
- $47,796
- Composite
- 54.58/100
- National rank
- #1340
- State rank
- #226 of 656 in OH
Livability — Heath
- Score
- 72/100
- State rank
- #353
- US rank
- #5705
Category grades
Schools grade is shown separately in the Schools card above.
Census & demographics
- Census place
- Heath, OH
- County
- Licking · 160,960 people
- Metro
- Columbus, OH
- Population (ZIP)
- 17,485
- Household income
- $76,833
- Rent vs Own
- Severe rent burden
- 5.6
Population outlook (Licking County) Hauer SSP2
- Today (2025)
- 178,210 people
- By 2030
- 180,917 · +1.5%
- By 2040
- 183,885 · +3.2%
- By 2050
- 182,985 · +2.7%
- By 2075
- 178,377 · +0.1%
- By 2100
- 161,075 · -9.6%
Race, ethnicity, and origin ACS 2023
- Neighborhood character
- Predominantly White (92%)
- Race & ethnicity
- White 92% Two or more races 4% Hispanic / Latino 2% Asian 1% Black 1%
- Common ancestry
- Iranian 2% Serbian 2% Slovak 2%
- Foreign-born
- 2% · Canada, India
- Languages at home
- 97% English-only · Other Indo-European 1% German/W. Germanic 1% Spanish 1%
Political lean MEDSL · Licking
- 2024 margin
- Solid R (+30.0) · D 34.5% · R 64.6%
- 2008→2024 swing
- -14.2pp toward R · 2008: -15.8pp · 2024: -30.0pp
- All cycles
- 2024: R+30.0 2020: R+28.1 2016: R+28.9 2012: R+14.7 2008: R+15.8
Not yet ingested
- Civics
- —
Market trends
- HPI YoY
- ▼ -194.75%
- Current HPI
- 229.4048
- Rent YoY
- —
- Metro
- —
- State GDP YoY
- ▲ 1.98%
- F500 in state
- 48
Industry mix (Fortune 500 HQ in OH)
| Industry | F500 HQs | Revenue |
|---|---|---|
| Insurance | 3 | $145B |
|
||
| Industrial Machinery | 3 | $49B |
|
||
| Financial Services | 3 | $24B |
|
||
| Consumer Goods | 2 | $93B |
|
||
| Aerospace / Defense | 2 | $47B |
|
||
| Utilities | 2 | $33B |
|
||
Price history
1 event — show timeline
- 2026-05-20 Coming Soon $125,000 CBRMLS
Property tax history
+5.0%/yrLatest (2025): $2,357 · +2.1% YoY. Source: county tax records.
Cash-flow waterfall
monthlySold comps — $/sqft
last 12 mo · ≤1 miLoading sold comps…