 Multi-family
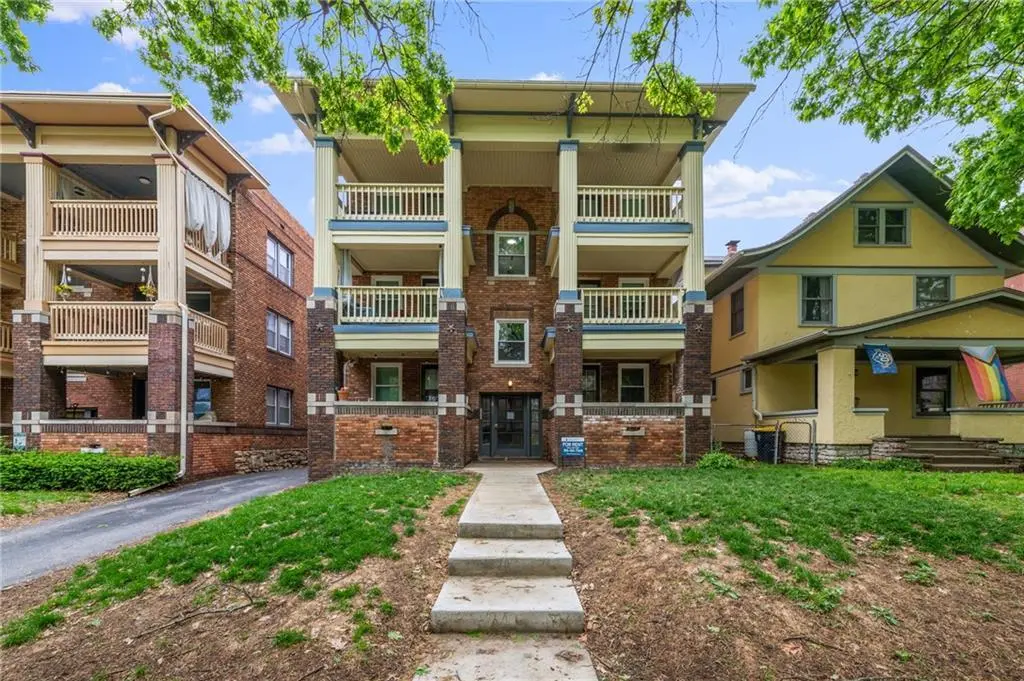
2805 Charlotte St · Kansas City, MO
Flood risk 1/10 · Minimal
- FEMA flood zone
- X (unshaded)
- Chance of flooding over 30 yrs
- 0.0%
- Est. flood insurance / yr
- $507 – $1,088
Fire risk 1/10 · Minimal
- Est. fire insurance / yr
- $1,054 – $1,958
Heat risk 4/10 · Minor
- Hot days now (above 106°F)
- 7 days/yr
- Hot days in 30 yrs
- 16 days/yr
Wind risk 2/10 · Minimal
- Chance of severe wind over 30 yrs
- —
Air-quality risk 3/10 · Minor
- Unhealthy air days now
- 2 days/yr
- Unhealthy air days in 30 yrs
- 3 days/yr
Risk factors via First Street. Map © Google.
Why this score? — see what drove the D- grade
The composite is a weighted blend of 9 inputs, each scored 0–100. Each bar is that input's sub-score; the figure is the points it added to the 100-point composite (weight × sub-score).
- Cash flow +14.7/30.0
- Rent growth +4.9/5.0
- DSCR +4.5/10.0
- Livability +3.9/5.0
- ARV discount +3.4/15.0
- 1% rule +2.9/10.0
- Condition / age +2.5/5.0
- Schools +1.5/10.0
- Appreciation +0.0/10.0
$950,000
🖨 Deal sheet 📄 Offer letter ✓ Due diligence
Multi-family units
County records classify this as Multi-Family (5+ Unit). Listing-text estimate: 1 unit. estimate disagrees with records
5+ unit building — per-unit beds/baths from public records are typically unavailable; the breakdown below (if shown) is an estimate from the listing text.
Listing remarks
The property at 2805 Charlotte is a meticulously restored, three-story brick complex located in the highly sought-after historic Longfellow neighborhood of Kansas City, Missouri. Constructed in 1920, this classic-style building exudes timeless charm while offering modern conveniences, making it an exceptional investment opportunity. The complex comprises six fully renovated 2-bedroom, 1-bathroom units, each with a thoughtfully designed footprint of approximately 900 square feet. Residents enjoy private patios or balconies with picturesque neighborhood views, as well as six off-street asphalt parking spaces conveniently located at the rear of the property. Following an extensive 18-month reh
Key facts
- Quartz countertops
- High-end finishes
- 7,230 sq ft lot
Tags
Property features AI
Finance
- Other: Property classified as residential income (apartment)
- Financial info: Gross annual income reported at $89,654; Operating expenses include accounting, advertising, electricity, exterminator, legal, maintenance, insurance, property management, real estate tax, refuse collection, water/sewer, and supplies
- HOA & community: No association fees
Exterior
- Parking: Off-street parking for 6 vehicles
- Security: N/A
- Utilities: Public water; Public sewer; Independent heating and air for units
- Home design: Residential income property (apartment); Three stories; Zoned R-2.5
- Construction: Brick and wood siding exterior; Composition roof
- Exterior features: Not located in a flood plain; Lot approximately 7,230 square feet
Interior
- Kitchen: N/A
- Bedrooms: Two-bedroom units
- Flooring: N/A
- Bathrooms: One bathroom per unit
- Heating & cooling: Forced air heating; Electric cooling
- Interior features: Basement present
- Laundry & utility: Individual water heaters; Separate meters
Neighborhood map
What this means for you Summary
Snapshot
- This is a 12-bed/6.0-bath multifamily listed at $950k.
Deal economics
- At list price, monthly cash flow is $251 ($3k/yr) — positive.
- The deal already cash-flows at list — no discount required.
- To meet the 1% rule (rent ≥ 1% of price), the offer needs to be $752k (20.9% below list).
- Recommended offer: $752k (20.9% below list) — sets the bar for 1% rule.
- Cap rate 6.6% vs local median 3.9% in Kansas City — top-decile yield for the area; either an underpriced asset or a hidden risk that comps aren't pricing in. Stress-test before assuming the spread holds.
Location & tenants
- Location reads 78/100 on livability (#28 in MO, #2,671 nationally) — a middle-class / working-renter tenant base. Strengths: amenities A+, commute A+, cost of living A+; Watch: schools C-, crime F.
- Kansas City 33 (urban): math 12% / reading 24% proficiency, ranked #308 of 324 in MO (top 95%) — low school quality limits family demand, transient renter base, plan for 1-2y turnover; 75% free/reduced lunch — lower-income household profile, screen leases tightly.
- Market conditions: Rents rising fast (+9.5%/yr); 97 active listings in the ZIP; lower-income renter base — watch delinquency; 4,002 units permitted in Jackson County in 2024 (2,271 in 5+ unit buildings).
- At $7,519/mo this rent would consume 215% of the median local household income ($42k/yr) (locally 853% of renters already pay >50% of income on rent) — very limited rent-growth headroom before tenants either downsize or default.
Forward outlook
- Local home prices are declining (-3.0%/yr); year-one equity from $7k of loan paydown is wiped out by about $28k of value loss. Plan a longer hold.
- Jackson County population projected at +4% by 2050 — modest demand growth; plan on rents tracking national, not racing it.
Negotiation context
- Only 1 days on market — expect competitive offers; lowballing is unlikely to land.
Risks & watch-outs
- Watch-outs: built in 1920 — expect roof / HVAC / electrical / plumbing capex.
Questions for the listing agent
- Built in 1920 — when were the roof, HVAC, electrical panel, plumbing, and water heater last replaced?
- Is there a deadline driving the sale (1031 exchange, divorce, estate, relocation)? That informs how much negotiation room exists.
- Crime grade is F in this area — have there been break-ins, vandalism, or insurance claims at this property in the last 3 years? What carrier currently insures it and at what premium?
- The area grade is low — what's the realistic commute time and amenity access for the typical tenant pool here? Any planned neighborhood developments (good or bad) we should know about?
- What's the average days-on-market for RENTAL listings here right now (not sales)? A rising rental-DOM trend means longer vacancies and softer asking-rent achievability than the comps imply.
- What's the recent tenant-quality profile in this submarket — average credit score on applications, eviction rate, late-payment / NSF rate, and stable-employment percentage? A property-management company in the area should have these aggregated.
- How much new apartment / multifamily construction is in the pipeline within 1–3 miles? Heavy new supply (>2% of stock underway) typically softens rents 12–24 months out; light construction supports rent growth.
Investment metrics
- 1% rule
- 0.79% ✗
- Cap rate
- 6.61%
- Cash-on-cash
- 1.13%
- DSCR
- 1.05
- GRM
- 10.5
CMA / ARV
- ARV (on-the-fly)
- $871,552
- Comps found
- 2
Show comp detail 2 sales within ~0.75 mi
| Address | Dist | Beds/Ba | Sqft | Sold | Price | $/sf | Match |
|---|---|---|---|---|---|---|---|
| 2805 Charlotte St | 0.00mi | 12/6.0 | 5,400 (+9%) | 1mo | $950,000 | $176 | 84 |
| 2543 Cherry St | 0.35mi | 12/3.0 | 5,400 (+9%) | 21mo | $750,000 | $139 | 39 |
Match score weights: distance 35% · size 25% · config 20% · recency 20%. Top-matched comps best support the ARV.
Projected returns pro-forma
-3.0% appreciation · 8.0% rent growth · sell at horizon
- IRR
- -9.7%
- Equity multiple
- 0.63×
- Total profit
- $-98,619
- Equity at exit
- $141,648
- IRR
- 4.9%
- Equity multiple
- 1.43×
- Total profit
- $113,869
- Equity at exit
- $82,139
Cash invested: $266,000 (down + closing). Projections, not guarantees.
Landlord ↔ Tenant lean methodology
- Overall (STATE)
- 81 Strongly Landlord-Friendly
- State Missouri
- 81 Strongly Landlord-Friendly · R+10
- County
- — inherits STATE
- City
- — inherits STATE
ZIP-level market 64109
- Rents YoY
- 9.5%
- Active inventory
- 97
- Price-to-rent
- 63.2×
Monthly cashflow live
- Estimated rent
- $7,519 high interval (Pro) →
- Mortgage (P&I)
- −$4,982
- Tax from tax record
- −$311 /mo · $3,731/yr
- Insurance
- −$396
- HOA
- −$0
- Vacancy / Maint / Mgmt
- −$1,579
- Net cashflow
- $251
Break-even live
6-unit breakdown (identical units grouped — click to expand)
| Units | Beds | Baths | Est. rent |
|---|---|---|---|
| 6× units | 2 | 1 | $7,518 |
| #1 | 2 | 1 | $1,253 |
| #2 | 2 | 1 | $1,253 |
| #3 | 2 | 1 | $1,253 |
| #4 | 2 | 1 | $1,253 |
| #5 | 2 | 1 | $1,253 |
| #6 | 2 | 1 | $1,253 |
| Total (6 units) | $7,519 | ||
UW: 25.0% down · 7.5% · 30yr · 1.5% tax · 5.0% vac · 8.0% maint · 8.0% mgmt
Financing live
Cash to close
- Down payment
- $237,500
- Closing costs
- $28,500
- Reserves months
- —
- Total cash needed
- —
Loan-product check · same deal, 3 products live
Conventional
25% down · 7.5% · 30yr
- Down + closing
- —
- Monthly P&I
- —
- Monthly cashflow
- —
- DSCR
- —
- Eligible?
- —
Personal DTI + credit; lowest rate.
DSCR
20% down · 8.5% · 30yr
- Down + closing
- —
- Monthly P&I
- —
- Monthly cashflow
- —
- DSCR
- —
- Eligible?
- —
No personal income docs; deal must DSCR.
Hard money
10% down · 12.0% · 12mo
- Down + closing
- —
- Monthly P&I
- —
- Monthly cashflow
- —
- DSCR
- —
- Eligible?
- —
Short-term bridge; refi at stabilization.
Listing history 5 events
-
2026-04-30status Pending
-
2026-04-30$950,000 Active
-
2022-01-19soldstatus
-
2009-02-27soldstatus
-
1991-06-14soldstatus
ⓘ Source: listings_history table (triggers on properties + properties_extension) + one-shot
backfill from property_details.listing_events for pre-trigger history.
Tax reassessment forecast MO · Resets to sale price
- Current annual tax
- $3,731 · $311/mo
- Projected year-2 tax
- $9,215 · $768/mo
- Expected delta
- +$5,484/yr (+$457/mo · 147.0%)
ⓘ Screening estimate from a state-policy table — verify with the county assessor before closing.
Climate risk First Street
- Flood 1/10 Low FEMA zone X (unshaded) · 0% chance over 30 yrs
- Wildfire 1/10 Low
- Heat 4/10 Moderate 7 d/yr ≥106°F today · 16 d/yr by 30 yrs out
- Wind 2/10 Low
- Air quality 3/10 Moderate 2 unhealthy d/yr today · 3 by 30 yrs out
Nearby sold comps map
Loading sold comps map…
Walkable amenities ~0.75 mi
Loading nearby amenities…
Taxation est. · year 1
- Rental income
- $90,228
- − Mortgage interest
- −$53,215
- − Property taxes
- −$3,731
- − Insurance
- −$4,750
- − Repairs & maintenance
- −$7,218
- − Management
- −$7,218
- − Depreciation
- −$27,636
- Taxable loss
- −$13,540
- Est. tax savings @ 24.0%
- +$3,250
- After-tax cash flow
- $6,266/yr
For passive investors: Depreciation is non-cash, so a rental often shows a tax loss while cash-flowing — sheltering income. Rental losses are passive: they offset passive income freely, and up to $25,000/yr can offset ordinary (W-2) income if you actively participate and your MAGI is under $100k (phasing out to $0 by $150k); unused losses carry forward. On sale, claimed depreciation is recaptured at up to 25%, and gains may owe capital-gains tax (a 1031 exchange can defer both). Figures are a year-1 estimate at your 24.0% rate — not tax advice; consult a CPA.
Schools (NCES district)
- District
- Kansas City 33
- NCES district ID
- 2916400
- Math proficiency
- 12% ▼ -8.00%
- Reading proficiency
- 24% ▬ 0.00%
- Median HH income
- $35,227
- Composite
- 14.8/100
- National rank
- #9387
- State rank
- #308 of 324 in MO
Livability — Kansas City
- Score
- 78/100
- State rank
- #28
- US rank
- #2671
Category grades
Schools grade is shown separately in the Schools card above.
Census & demographics
- Census place
- Kansas City, MO
- County
- Jackson County · 687,798 people
- City population
- 439,467
- Metro
- Kansas City, MO-KS
- Population (ZIP)
- 10,043
- Household income
- $41,943
- Rent vs Own
- Severe rent burden
- 853.0
Population outlook (Jackson County) Hauer SSP2
- Today (2025)
- 719,589 people
- By 2030
- 731,456 · +1.6%
- By 2040
- 746,689 · +3.8%
- By 2050
- 749,289 · +4.1%
- By 2075
- 736,227 · +2.3%
- By 2100
- 668,210 · -7.1%
Race, ethnicity, and origin ACS 2023
- Neighborhood character
- Diverse neighborhood (Simpson 0.64)
- Race & ethnicity
- Black 45% White 39% Hispanic / Latino 9% Two or more races 4% Asian 2%
- Hispanic origin (detail)
- Mexican 7%
- Common ancestry
- Slovak 1% Romanian 1% Lithuanian 1%
- Foreign-born
- 7% · Canada, Philippines, China
- Languages at home
- 88% English-only · Spanish 5% Other Asian/Pacific 3% Arabic 1%
Political lean MEDSL · Jackson
- 2024 margin
- D (+19.3) · D 58.9% · R 39.5% · Other 1.6%
- 2008→2024 swing
- -6.1pp toward R · 2008: 25.4pp · 2024: 19.3pp
- All cycles
- 2024: D+19.3 2020: D+22.0 2016: D+16.6 2012: D+19.0 2008: D+25.4
Not yet ingested
- Civics
- —
Market trends
- HPI YoY
- ▼ -275.12%
- Current HPI
- 243.6094
- Rent YoY
- ▲ 9.50%
- Metro
- Kansas City, MO-KS
- State GDP YoY
- ▲ 1.84%
- F500 in state
- 20
Industry mix (Fortune 500 HQ in MO)
| Industry | F500 HQs | Revenue |
|---|---|---|
| Healthcare | 1 | $163B |
|
||
| Insurance | 1 | $21B |
|
||
| Industrial Technology | 1 | $17B |
|
||
| Retail | 1 | $16B |
|
||
| Industrial Distribution | 1 | $10B |
|
||
| Utilities | 1 | $9B |
|
||
Price history
5 events — show timeline
- 2026-04-30 Pending — Heartland MLS as Distributed by MLS Grid
- 2026-04-30 Listed $950,000 Heartland MLS as Distributed by MLS Grid
- 2022-01-19 Sold (Public Records) — Public Records
- 2009-02-27 Sold (Public Records) — Public Records
- 1991-06-14 Sold (Public Records) — Public Records
Property tax history
+7.5%/yrLatest (2025): $3,731 · -63.5% YoY. Source: county tax records.
Cash-flow waterfall
monthlySold comps — $/sqft
last 12 mo · ≤1 miLoading sold comps…