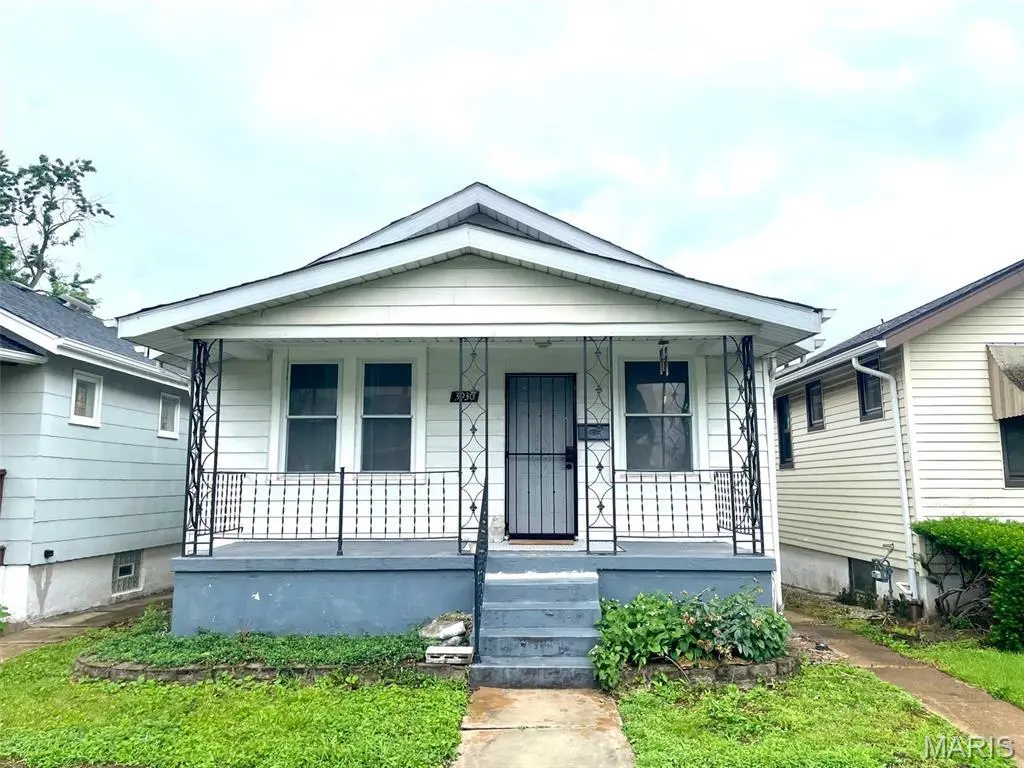
3930 Itaska St · St. Louis, MO
Flood risk 1/10 · Minimal
- FEMA flood zone
- X (unshaded)
- Chance of flooding over 30 yrs
- 0.0%
- Est. flood insurance / yr
- $473 – $860
Fire risk 1/10 · Minimal
- Est. fire insurance / yr
- $1,054 – $1,958
Heat risk 6/10 · Moderate
- Hot days now (above 108°F)
- 7 days/yr
- Hot days in 30 yrs
- 21 days/yr
Wind risk 2/10 · Minimal
- Chance of severe wind over 30 yrs
- 1.0%
Air-quality risk 3/10 · Minor
- Unhealthy air days now
- 3 days/yr
- Unhealthy air days in 30 yrs
- 4 days/yr
Risk factors via First Street. Map © Google.
Why this score? — see what drove the D grade
The composite is a weighted blend of 9 inputs, each scored 0–100. Each bar is that input's sub-score; the figure is the points it added to the 100-point composite (weight × sub-score).
- Cash flow +17.0/30.0
- ARV discount +9.1/15.0
- DSCR +5.3/10.0
- 1% rule +4.2/10.0
- Rent growth +3.2/5.0
- Livability +2.5/5.0
- Condition / age +2.5/5.0
- Schools +1.2/10.0
- Appreciation +0.0/10.0
$114,900
🖨 Deal sheet (PDF) 📄 Offer letter ✓ Due diligence
Listing remarks MLS
Don't pass this nice 1br, 1ba South City bungalow up! This home features spacious rooms, some wood floors, and a possible bonus bedroom in lower level. Large deck with steps down to backyard. This home sits on a level lot and is fenced. Close to public transportation. Schedule a showing on this one today! Please schedule all showings through the MLS showing assist link.
Key facts
- 3,031 sq ft lot
- Built 1927
- Listed 13 days
Property features AI
Exterior
- Utilities: Public water; Public sewer; Single phase electric; Cable available
- Home design: Single family residence; One level
- Construction: Vinyl siding; Architectural shingle roof; Basement with 8 ft+ poured concrete
- Exterior features: Deck; Back yard; Chain link fencing; Level lot
Interior
- Kitchen: Microwave; Free-standing gas oven; Refrigerator
- Bedrooms: 1 bedroom on the main level
- Bathrooms: 1 full bathroom on the main level
- Heating & cooling: Forced air heating; Central air; Ceiling fan(s)
- Interior features: Eat-in kitchen; Smart thermostat; Wi-Fi; Carbon monoxide detector(s); Smoke detector(s)
- Laundry & utility: Laundry in basement
Neighborhood map
What this means for you Summary
Snapshot
- This is a 1-bed/1.0-bath single-family listed at $115k.
Deal economics
- At list price, monthly cash flow is $77 ($930/yr) — positive.
- The deal already cash-flows at list — no discount required.
- To meet the 1% rule (rent ≥ 1% of price), the offer needs to be $106k (7.9% below list).
- Recommended offer: $106k (7.9% below list) — sets the bar for 1% rule.
- Cap rate 7.1% vs local median 5.0% in St. Louis — top-decile yield for the area; either an underpriced asset or a hidden risk that comps aren't pricing in. Stress-test before assuming the spread holds.
Location & tenants
- Location reads: area grade D — affects rentability + tenant quality, not the cash-flow math above.
- St. Louis City (urban): math 10% / reading 18% proficiency, ranked #312 of 324 in MO (top 96%) — low school quality limits family demand, transient renter base, plan for 1-2y turnover; 80% free/reduced lunch — lower-income household profile, screen leases tightly.
- Zoned schools: Oak Hill Elem. (math 12% / reading 12%, grade F, #1,016 of 1,115 statewide, top 92%, 238 students, 99% FRL); Gateway Middle (math 0% / reading 8%, grade F, #389 of 391 statewide, top 100%, 506 students, 99% FRL); Roosevelt High (math 2% / reading 8%, grade F, #517 of 521 statewide, top 100%, 460 students, 99% FRL) — zoned schools average 99% FRL vs 80% district-wide (19 pts higher); higher-poverty schools than district average — tighter screening recommended.
- Market conditions: Rents rising (+2.6%/yr); 261 active listings in the ZIP; 40 comparable units currently listed for rent nearby; rentals at typical pace (median 26d on market — plan ~3-4 weeks tenant-placement turnaround); 45% of comp listings sitting > 30 days — soft ceiling on asking rent; 294 units permitted in St. Louis city in 2024 (227 in 5+ unit buildings).
Forward outlook
- Local home prices are declining (-3.0%/yr); year-one equity from $794 of loan paydown is wiped out by about $3k of value loss. Plan a longer hold.
- St. Louis County population projected to shrink 6% by 2050 — rents likely to lag national; underwrite the cash flow, not the appreciation.
Negotiation context
- Only 13 days on market — expect competitive offers; lowballing is unlikely to land.
- Current owner paid $58k; list at $115k implies a 98% gain — meaningful room to come down on a strong offer.
Risks & watch-outs
- Watch-outs: built in 1927 — expect roof / HVAC / electrical / plumbing capex.
- Climate carrying-cost: extreme-heat days projected 7→21/yr by 2055 (HVAC capex compounding) — expect insurance premiums to compound above CPI over the hold.
Questions for the listing agent
- Built in 1927 — when were the roof, HVAC, electrical panel, plumbing, and water heater last replaced?
- Is there a deadline driving the sale (1031 exchange, divorce, estate, relocation)? That informs how much negotiation room exists.
- The area grade is low — what's the realistic commute time and amenity access for the typical tenant pool here? Any planned neighborhood developments (good or bad) we should know about?
- What's the average days-on-market for RENTAL listings here right now (not sales)? A rising rental-DOM trend means longer vacancies and softer asking-rent achievability than the comps imply.
- What's the recent tenant-quality profile in this submarket — average credit score on applications, eviction rate, late-payment / NSF rate, and stable-employment percentage? A property-management company in the area should have these aggregated.
- How much new for-sale + rental construction is in the pipeline within 1–3 miles? Heavy new supply typically softens prices + rents 12–24 months out; constrained supply supports both.
Investment metrics
- 1% rule
- 0.92% ✗
- Cap rate
- 7.10%
- Cash-on-cash
- 2.89%
- DSCR
- 1.13
- GRM
- 9.1
CMA / ARV
- ARV (on-the-fly)
- $119,040
- Comps found
- 12
Show comp detail 12 sales within ~0.75 mi
| Address | Dist | Beds/Ba | Sqft | Sold | Price | $/sf | Match |
|---|---|---|---|---|---|---|---|
| 4614 S 39th St | 0.23mi | 2/1.0 (+1) | 768 (0%) | 0mo | $149,800 | $195 | 84 |
| 4035 Schiller Pl | 0.34mi | 2/1.0 (+1) | 762 (-1%) | 2mo | $114,900 | $151 | 76 |
| 4045 Walsh St | 0.27mi | 2/1.0 (+1) | 803 (+5%) | 2mo | $55,635 | $69 | 73 |
| 3976 Eichelberger St | 0.30mi | 2/1.0 (+1) | 720 (-6%) | 1mo | $10,000 | $14 | 70 |
| 5039 Grace Ave | 0.48mi | 2/1.0 (+1) | 792 (+3%) | 0mo | $145,500 | $184 | 67 |
| 4454 S Spring Ave | 0.33mi | 2/1.0 (+1) | 816 (+6%) | 4mo | $129,900 | $159 | 66 |
| 3653 Taft Ave | 0.48mi | 1/2.0 | 741 (-4%) | 6mo | $109,900 | $148 | 63 |
| 4649 Louisiana Ave | 0.66mi | 2/1.0 (+1) | 743 (-3%) | 5mo | $115,000 | $155 | 55 |
| 3979 Burgen Ave | 0.52mi | 1/1.0 | 850 (+11%) | 4mo | $135,000 | $159 | 55 |
| 5610 Leona St | 0.50mi | 2/1.0 (+1) | 840 (+9%) | 4mo | $150,000 | $179 | 52 |
| 3618 Gasconade St | 0.73mi | 2/1.0 (+1) | 850 (+11%) | 2mo | $107,000 | $126 | 41 |
| 4327 Jessica Ave | 0.71mi | 2/1.0 (+1) | 656 (-15%) | 3mo | $100,000 | $152 | 35 |
Match score weights: distance 35% · size 25% · config 20% · recency 20%. Top-matched comps best support the ARV.
Projected returns pro-forma
-3.0% appreciation · 2.62% rent growth · sell at horizon
- IRR
- -12.2%
- Equity multiple
- 0.56×
- Total profit
- $-14,093
- Equity at exit
- $17,132
- IRR
- -3.6%
- Equity multiple
- 0.76×
- Total profit
- $-7,584
- Equity at exit
- $9,934
Cash invested: $32,172 (down + closing). Projections, not guarantees.
Landlord ↔ Tenant lean methodology
- Overall (STATE)
- 81 Strongly Landlord-Friendly
- State Missouri
- 81 Strongly Landlord-Friendly · R+10
- County
- — inherits STATE
- City
- — inherits STATE
ZIP-level market 63116
- Rents YoY
- 2.6%
- Active inventory
- 261
- Price-to-rent
- 9.1×
Monthly cashflow live
- Estimated rent
- $1,058 high interval (Pro) →
- Mortgage (P&I)
- −$603
- Tax from tax record
- −$108 /mo · $1,293/yr
- Insurance
- −$48
- HOA
- −$0
- Vacancy / Maint / Mgmt
- −$222
- Net cashflow
- $77
Break-even live
Sensitivity live
| Price | -10% $143 | -5% $110 | +0% $77 | +5% $45 | +10% $12 |
|---|---|---|---|---|---|
| Rent | -10% $-6 | -5% $36 | +0% $77 | +5% $119 | +10% $161 |
| Rate | -1.0pp $135 | -0.5pp $107 | base $77 | +0.5pp $48 | +1.0pp $17 |
UW: 25.0% down · 7.5% · 30yr · 1.5% tax · 5.0% vac · 8.0% maint · 8.0% mgmt
Financing live
Cash to close
- Down payment
- $28,725
- Closing costs
- $3,447
- Reserves months
- —
- Total cash needed
- —
Loan-product check · same deal, 3 products live
Conventional
25% down · 7.5% · 30yr
- Down + closing
- —
- Monthly P&I
- —
- Monthly cashflow
- —
- DSCR
- —
- Eligible?
- —
Personal DTI + credit; lowest rate.
DSCR
20% down · 8.5% · 30yr
- Down + closing
- —
- Monthly P&I
- —
- Monthly cashflow
- —
- DSCR
- —
- Eligible?
- —
No personal income docs; deal must DSCR.
Hard money
10% down · 12.0% · 12mo
- Down + closing
- —
- Monthly P&I
- —
- Monthly cashflow
- —
- DSCR
- —
- Eligible?
- —
Short-term bridge; refi at stabilization.
Rent comps 40 comps
| Address | Beds | Baths | Sqft | Rent | $/sqft | DOM | Units | Dist |
|---|---|---|---|---|---|---|---|---|
| 5033 Ulena Ave Saint Louis, MO | 2.0 | 1.0 | 960 | $1,575 | $1.64 | 45d | 1 | 0.16mi |
| 5021 Ray Ave Unit A St. Louis, MO | 1.0 | 1.0 | 768 | $1,194 | $1.55 | 16d | 1 | 0.29mi |
| 5021 Ray Ave Unit 1f St. Louis, MO | 1.0 | 1.0 | 768 | $1,095 | $1.43 | 16d | 1 | 0.29mi |
| 5021 Ray Ave Unit B St. Louis, MO | 1.0 | 1.0 | 768 | $1,195 | $1.56 | 16d | 1 | 0.29mi |
| 3765 Delor St Unit 37651-F St. Louis, MO | 2.0 | 1.5 | 900 | $1,225 | $1.36 | 25d | 1 | 0.30mi |
| 4740 Newport Ave Saint Louis, MO | 1.0 | 1.0 | 754 | $1,650 | $2.19 | 45d | 1 | 0.30mi |
| 3761 Delor St St. Louis, MO | 2.0 | 1.5 | 900 | $1,285 | $1.43 | 3d | 2 | 0.31mi |
| 3647 Delor St Unit 3647-1F St. Louis, MO | 2.0 | 1.5 | 900 | $1,115 | $1.24 | 45d | 1 | 0.32mi |
| 4028 Schiller Pl Saint Louis, MO | 2.0 | 1.0 | 802 | $1,440 | $1.80 | 45d | 1 | 0.33mi |
| 3737 Delor St Unit 3737-1F St. Louis, MO | 2.0 | 1.5 | 900 | $1,115 | $1.24 | 25d | 1 | 0.34mi |
| 3737 Delor St Unit 3737-2F St. Louis, MO | 2.0 | 1.5 | 900 | $1,115 | $1.24 | 45d | 1 | 0.34mi |
| 3729 Delor St Unit 37292-F St. Louis, MO | 2.0 | 1.5 | 900 | $1,115 | $1.24 | 25d | 1 | 0.34mi |
| 3723 Delor St Unit 3723-1F St. Louis, MO | 2.0 | 1.5 | 900 | $1,225 | $1.36 | 45d | 1 | 0.35mi |
| 3719 Delor St Unit 3719-1F St. Louis, MO | 2.0 | 1.5 | 900 | $1,115 | $1.24 | 45d | 1 | 0.35mi |
| 3717 Delor St Unit 37172-F St. Louis, MO | 2.0 | 1.5 | 900 | $1,115 | $1.24 | 25d | 1 | 0.36mi |
| 3711 Delor St Unit 3711-1F St. Louis, MO | 2.0 | 1.5 | 900 | $1,225 | $1.36 | 25d | 1 | 0.37mi |
| 3709 Delor St Unit 3709-1F St. Louis, MO | 2.0 | 1.5 | 900 | $1,225 | $1.36 | 45d | 1 | 0.38mi |
| 3707a Delor St Unit 3707-2F St. Louis, MO | 2.0 | 1.5 | 900 | $1,115 | $1.24 | 45d | 1 | 0.38mi |
| 3824 Eiler St Saint Louis, MO | 2.0 | 1.0 | 1000 | $1,050 | $1.05 | 25d | 1 | 0.39mi |
| 3705 Delor St Unit 3705-1F St. Louis, MO | 2.0 | 1.5 | 900 | $1,225 | $1.36 | 45d | 1 | 0.39mi |
| 3661 Delor St Unit 3661-1F St. Louis, MO | 2.0 | 1.5 | 900 | $1,225 | $1.36 | 45d | 1 | 0.40mi |
| 3661 Delor St Unit 3661-2F St. Louis, MO | 2.0 | 1.5 | 900 | $1,115 | $1.24 | 45d | 1 | 0.40mi |
| 3664 Neosho St Saint Louis, MO | 1.0 | 1.0 | 700 | $750 | $1.07 | 45d | 1 | 0.42mi |
| 3659 Delor St Unit 3659-1F St. Louis, MO | 2.0 | 1.5 | 900 | $1,115 | $1.24 | 45d | 1 | 0.42mi |
| 3654 Neosho St Saint Louis, MO | 1.0 | 1.0 | 850 | $725 | $0.85 | 9d | 1 | 0.44mi |
| 3608 Delor St Apt C St. Louis, MO | — | 1.0 | 700 | $850 | $1.21 | 45d | 1 | 0.51mi |
| 4301 S 38th St Unit 1s St. Louis, MO | 1.0 | 1.0 | 686 | $900 | $1.31 | 0d | 1 | 0.52mi |
| 4301 S 38th St Unit 1s St. Louis, MO | 1.0 | 1.0 | 686 | $900 | $1.31 | 25d | 1 | 0.52mi |
| 4451 Grace Ave Saint Louis, MO | 2.0 | 1.0 | 700 | $750 | $1.07 | 19d | 1 | 0.53mi |
| 4523 Gravois Ave Apt 204 St. Louis, MO | — | 1.0 | 700 | $699 | $1.00 | 45d | 1 | 0.54mi |
| 4523 Gravois Ave Unit 305 St. Louis, MO | — | 1.0 | 700 | $799 | $1.14 | 19d | 1 | 0.54mi |
| 4722 S Grand Blvd Unit 2N St. Louis, MO | 1.0 | 1.0 | 925 | $750 | $0.81 | 16d | 1 | 0.54mi |
| 4684 S Grand Blvd Saint Louis, MO | 1.0 | 1.0 | 1000 | $800 | $0.80 | 12d | 1 | 0.54mi |
| 4205 Ellenwood Ave Unit 202 St. Louis, MO | 1.0 | 1.0 | 750 | $899 | $1.20 | 25d | 1 | 0.55mi |
| 4205 Ellenwood Ave Unit 102 St. Louis, MO | 1.0 | 1.0 | 750 | $899 | $1.20 | 45d | 1 | 0.55mi |
| 4215 Neosho St Unit 101 St. Louis, MO | 2.0 | 1.0 | 750 | $825 | $1.10 | 45d | 1 | 0.55mi |
| 5217 S Grand Blvd Saint Louis, MO | 2.0 | 1.0 | 870 | $1,125 | $1.29 | 16d | 1 | 0.56mi |
| 4226 Neosho St Apt 4 St. Louis, MO | 1.0 | 1.0 | 600 | $725 | $1.21 | 0d | 1 | 0.57mi |
| 4733 Morgan Ford Rd Unit 3 St. Louis, MO | 1.0 | 1.0 | 800 | $799 | $1.00 | 25d | 1 | 0.58mi |
| 4729 Morgan Ford Rd Unit 7 St. Louis, MO | 1.0 | 1.0 | 800 | $799 | $1.00 | 14d | 1 | 0.58mi |
Listing history 10 events
-
2026-06-21days on market $114,900 Active 13 DOM
-
2026-06-18days on market $114,900 Active 10 DOM
-
2026-06-17days on market $114,900 Active 9 DOM
-
2026-06-16days on market $114,900 Active 8 DOM
-
2026-06-15days on market $114,900 Active 7 DOM
-
2026-06-13days on market $114,900 Active 5 DOM
-
2026-06-08remarks 699-char remark
-
2026-06-08status $114,900 Active 1 DOM
-
2026-06-08remarks 576-char remark
-
2026-06-08$114,900 Coming Soon 1 DOM
ⓘ Source: listings_history table (triggers on properties + properties_extension) + one-shot
backfill from property_details.listing_events for pre-trigger history.
Tax reassessment forecast MO · Resets to sale price
- Current annual tax
- $1,293 · $108/mo
- Projected year-2 tax
- $1,293 · $108/mo
- Expected delta
- $0/yr ($0/mo · 0.0%)
ⓘ Screening estimate from a state-policy table — verify with the county assessor before closing.
Climate risk First Street
- Flood 1/10 Low FEMA zone X (unshaded) · 0% chance over 30 yrs
- Wildfire 1/10 Low
- Heat 6/10 Major 7 d/yr ≥108°F today · 21 d/yr by 30 yrs out
- Wind 2/10 Low 100% chance of damaging wind over 30 yrs
- Air quality 3/10 Moderate 3 unhealthy d/yr today · 4 by 30 yrs out
Nearby sold comps map
Loading sold comps map…
Walkable amenities ~0.75 mi
Loading nearby amenities…
Taxation est. · year 1
- Rental income
- $12,693
- − Mortgage interest
- −$6,436
- − Property taxes
- −$1,293
- − Insurance
- −$574
- − Repairs & maintenance
- −$1,015
- − Management
- −$1,015
- − Depreciation
- −$3,343
- Taxable loss
- −$984
- Est. tax savings @ 24.0%
- +$236
- After-tax cash flow
- $1,166/yr
For passive investors: Depreciation is non-cash, so a rental often shows a tax loss while cash-flowing — sheltering income. Rental losses are passive: they offset passive income freely, and up to $25,000/yr can offset ordinary (W-2) income if you actively participate and your MAGI is under $100k (phasing out to $0 by $150k); unused losses carry forward. On sale, claimed depreciation is recaptured at up to 25%, and gains may owe capital-gains tax (a 1031 exchange can defer both). Figures are a year-1 estimate at your 24.0% rate — not tax advice; consult a CPA.
Schools (NCES district)
- District
- St. Louis City
- NCES district ID
- 2929280
- Math proficiency
- 10% ▼ -6.00%
- Reading proficiency
- 18% ▼ -3.00%
- Median HH income
- $35,685
- Composite
- 11.54/100
- National rank
- #9699
- State rank
- #312 of 324 in MO
Livability — St. Louis
No livability data for this city. (Only ~50 U.S. cities are tracked.)
Census & demographics
- Census place
- St. Louis, MO
- County
- Saint Louis City · 254,015 people
- City population
- 283,259
- Metro
- St. Louis, MO-IL
- Population (ZIP)
- 42,170
- Household income
- $61,433
- Rent vs Own
- Severe rent burden
- 1923.0
Population outlook (St. Louis County) Hauer SSP2
- Today (2025)
- 315,737 people
- By 2030
- 313,865 · -0.6%
- By 2040
- 305,439 · -3.3%
- By 2050
- 296,529 · -6.1%
- By 2075
- 271,028 · -14.2%
- By 2100
- 255,359 · -19.1%
Race, ethnicity, and origin ACS 2023
- Neighborhood character
- Diverse neighborhood (Simpson 0.63)
- Race & ethnicity
- White 54% Black 27% Hispanic / Latino 10% Two or more races 8% Asian 5%
- Hispanic origin (detail)
- Mexican 7%
- Common ancestry
- Lithuanian 4% Romanian 2% Italian 2%
- Foreign-born
- 11% · Canada, Vietnam, Philippines
- Languages at home
- 85% English-only · Spanish 6% Vietnamese 2% Arabic 2%
Political lean MEDSL · St. Louis
- 2024 margin
- Solid D (+64.7) · D 81.4% · R 16.7% · Other 2.0%
- 2008→2024 swing
- -3.5pp toward R · 2008: 68.2pp · 2024: 64.7pp
- All cycles
- 2024: D+64.7 2020: D+66.2 2016: D+63.7 2012: D+66.6 2008: D+68.2
Not yet ingested
- Civics
- —
Market trends
- HPI YoY
- ▼ -271.19%
- Current HPI
- 215.7108
- Rent YoY
- ▲ 2.62%
- Metro
- St. Louis, MO-IL
- State GDP YoY
- ▲ 1.84%
- F500 in state
- 20
Industry mix (Fortune 500 HQ in MO)
| Industry | F500 HQs | Revenue |
|---|---|---|
| Healthcare | 1 | $163B |
|
||
| Insurance | 1 | $21B |
|
||
| Industrial Technology | 1 | $17B |
|
||
| Retail | 1 | $16B |
|
||
| Industrial Distribution | 1 | $10B |
|
||
| Utilities | 1 | $9B |
|
||
Price history
+98.1% since first listed4 events — show timeline
- 2026-06-08 Coming Soon $114,900 MARIS as Distributed by MLS Grid
- 2013-08-16 Sold (MLS) — MARIS as Distributed by MLS Grid
- 2013-05-22 Listed $17,000 MARIS as Distributed by MLS Grid
- 2001-08-03 Sold (Public Records) $58,000 Public Records
Property tax history
+5.9%/yrLatest (2024): $1,293 · +5.1% YoY. Source: county tax records.
Cash-flow waterfall
monthlySold comps — $/sqft
last 12 mo · ≤1 miLoading sold comps…