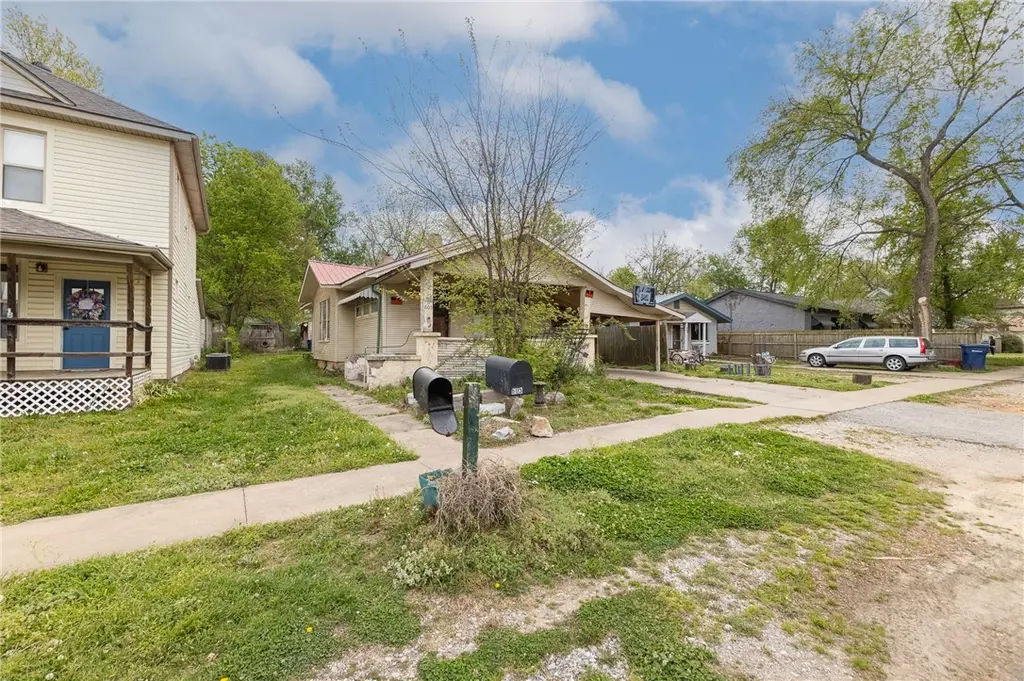
605 S Maxwell St · Siloam Springs, AR
Flood risk 1/10 · Minimal
- FEMA flood zone
- X (unshaded)
- Chance of flooding over 30 yrs
- 0.0%
- Est. flood insurance / yr
- $507 – $1,088
Fire risk 6/10 · Moderate
- Est. fire insurance / yr
- $1,499 – $2,785
Heat risk 5/10 · Moderate
- Hot days now (above 106°F)
- 7 days/yr
- Hot days in 30 yrs
- 20 days/yr
Wind risk 2/10 · Minimal
- Chance of severe wind over 30 yrs
- 2.0%
Air-quality risk 2/10 · Minimal
- Unhealthy air days now
- 1 days/yr
- Unhealthy air days in 30 yrs
- 2 days/yr
Risk factors via First Street. Map © Google.
Why this score? — see what drove the B- grade
The composite is a weighted blend of 9 inputs, each scored 0–100. Each bar is that input's sub-score; the figure is the points it added to the 100-point composite (weight × sub-score).
- Cash flow +30.0/30.0
- DSCR +10.0/10.0
- 1% rule +9.2/10.0
- ARV discount +7.5/15.0
- Livability +3.7/5.0
- Schools +3.6/10.0
- Rent growth +2.5/5.0
- Condition / age +2.5/5.0
- Appreciation +0.0/10.0
$89,000
🖨 Deal sheet 📄 Offer letter ✓ Due diligence
Listing remarks MLS
Investor special in the heart of Siloam Springs! This property at 605 Maxwell St offers a compelling opportunity with an attractive price per square foot, making it an excellent value-add deal. Whether you’re looking to renovate, hold, live in, or reposition for resale, the numbers make sense here. The layout and location also lend themselves well to multiple exit strategies, including long-term rental income, mid-term furnished housing, or even a short-term rental setup. Potential for bed/bath additions. For owner-occupants, this is a chance to renovate and customize a home to your liking while building equity over time. Investors will appreciate the flexibility and upside potential, while homeowners can take advantage of a lower entry price and create their ideal living space. Don’t miss this versatile opportunity with strong upside, whether you’re expanding your portfolio or planning your next home project!
Key facts
- 7,405 sq ft lot
- Parking
- Built 1950
Neighborhood map
What this means for you Summary
Snapshot
- This is a 2-bed/1.0-bath single-family listed at $89k.
Deal economics
- At list price, monthly cash flow is $409 ($5k/yr) — positive.
- The deal already cash-flows at list — no discount required.
- Meets the 1% rule at list price ($1k rent vs $89k).
- Recommended offer: $86k (3.0% below list) — sets the bar for market timing.
- Cap rate 11.8% vs local median 3.9% in Siloam Springs — top-decile yield for the area; either an underpriced asset or a hidden risk that comps aren't pricing in. Stress-test before assuming the spread holds.
Location & tenants
- Location reads 74/100 on livability (#17 in AR, #4,621 nationally) — a middle-class / working-renter tenant base. Strengths: cost of living A+, housing A+, health & safety A+; Watch: schools D, crime D, amenities F.
- Siloam Springs School District (town): math 44% / reading 40% proficiency, ranked #53 of 238 in AR (top 22%) — families likely to look elsewhere, expect single-tenant / working-renter base with shorter leases.
- Market conditions: 362 active listings in the ZIP; 10 comparable units currently listed for rent nearby; rentals at typical pace (median 21d on market — plan ~3-4 weeks tenant-placement turnaround); solid renter incomes; 4,359 units permitted in Benton County in 2024 (402 in 5+ unit buildings).
Forward outlook
- Local home prices are declining (-3.0%/yr); year-one equity from $615 of loan paydown is wiped out by about $3k of value loss. Plan a longer hold.
- Benton County population projected at +56% by 2050 — long-run rental-demand tailwind backs the buy-and-hold thesis.
- At projected returns (-3.0% appreciation + 3.0% rent growth), your $25k cash investment doubles in ~7 years — after that, you're playing with house money.
Negotiation context
- It's been on market 45 days — a 3% lower offer ($86k) is reasonable based on typical stale-listing flexibility.
- Current owner paid $35k; list at $89k implies a 154% gain — meaningful room to come down on a strong offer.
Risks & watch-outs
- Watch-outs: built in 1950 — expect roof / HVAC / electrical / plumbing capex.
- Climate carrying-cost: major wildfire risk; extreme-heat days projected 7→20/yr by 2055 (HVAC capex compounding) — expect insurance premiums to compound above CPI over the hold.
Questions for the listing agent
- It's been on market 45 days. Have you received any prior offers? Is the seller open to a 3% concession, seller financing, or rate buy-down credit?
- Built in 1950 — when were the roof, HVAC, electrical panel, plumbing, and water heater last replaced?
- Is there a deadline driving the sale (1031 exchange, divorce, estate, relocation)? That informs how much negotiation room exists.
- Schools are D-rated, which usually means shorter tenancies and higher turnover. Who's the typical renter profile here, and what's been the actual vacancy rate?
- Crime grade is D in this area — have there been break-ins, vandalism, or insurance claims at this property in the last 3 years? What carrier currently insures it and at what premium?
- What's the average days-on-market for RENTAL listings here right now (not sales)? A rising rental-DOM trend means longer vacancies and softer asking-rent achievability than the comps imply.
- What's the recent tenant-quality profile in this submarket — average credit score on applications, eviction rate, late-payment / NSF rate, and stable-employment percentage? A property-management company in the area should have these aggregated.
- How much new for-sale + rental construction is in the pipeline within 1–3 miles? Heavy new supply typically softens prices + rents 12–24 months out; constrained supply supports both.
Investment metrics
- 1% rule
- 1.42% ✓
- Cap rate
- 11.80%
- Cash-on-cash
- 19.69%
- DSCR
- 1.88
- GRM
- 5.9
CMA / ARV
- ARV (median comp)
- $186,375
- List price
- $89,000
- Delta
- -52.25%
- Verdict
- UNDERPRICED
- Comps
- 20 within 1.0 mi
Show comp detail 12 sales within ~0.75 mi
| Address | Dist | Beds/Ba | Sqft | Sold | Price | $/sf | Match |
|---|---|---|---|---|---|---|---|
| 608 S Maxwell St | 0.03mi | 2/1.0 | 900 (-5%) | 9mo | $179,000 | $199 | 83 |
| 421 S Washington St | 0.20mi | 2/1.0 | 1,008 (+6%) | 2mo | $75,000 | $74 | 78 |
| 614 W Harvard St | 0.47mi | 2/1.0 | 925 (-2%) | 4mo | $193,000 | $209 | 71 |
| 823 S Wright St | 0.27mi | 2/1.0 | 1,023 (+8%) | 8mo | $189,000 | $185 | 68 |
| 717 S Hico St | 0.41mi | 2/1.0 | 900 (-5%) | 13mo | $177,000 | $197 | 61 |
| 926 S Elm St | 0.55mi | 3/1.0 (+1) | 930 (-2%) | 8mo | $183,700 | $198 | 60 |
| 613 Central St | 0.40mi | 2/1.0 | 972 (+2%) | 24mo | $189,200 | $195 | 58 |
| 405 W Siloam Pl | 0.56mi | 3/1.0 (+1) | 884 (-7%) | 1mo | $140,000 | $158 | 57 |
| 624 Hico St | 0.37mi | 3/1.0 (+1) | 872 (-8%) | 20mo | $150,000 | $172 | 48 |
| 707 S Hico St | 0.41mi | 3/1.0 (+1) | 1,053 (+11%) | 12mo | $164,000 | $156 | 47 |
| 1780 S Washington St | 0.71mi | 2/1.0 | 1,012 (+7%) | 16mo | $160,000 | $158 | 43 |
| 503 W Tahlequah St | 0.71mi | 2/1.0 | 1,048 (+10%) | 12mo | $163,000 | $156 | 40 |
Match score weights: distance 35% · size 25% · config 20% · recency 20%. Top-matched comps best support the ARV.
Projected returns pro-forma
-3.0% appreciation · 3.0% rent growth · sell at horizon
- IRR
- 11.7%
- Equity multiple
- 1.47×
- Total profit
- $11,617
- Equity at exit
- $13,270
- IRR
- 20.7%
- Equity multiple
- 2.75×
- Total profit
- $43,651
- Equity at exit
- $7,695
Cash invested: $24,920 (down + closing). Projections, not guarantees.
Landlord ↔ Tenant lean methodology
- Overall (STATE)
- 92 Strongly Landlord-Friendly
- State Arkansas
- 92 Strongly Landlord-Friendly · R+14
- County
- — inherits STATE
- City
- — inherits STATE
ZIP-level market 72761
- Home prices YoY
- -13.6%
- Active inventory
- 362
- Price-to-rent
- 5.9×
Monthly cashflow live
- Estimated rent
- $1,261 high interval (Pro) →
- Mortgage (P&I)
- −$467
- Tax from tax record
- −$84 /mo · $1,007/yr
- Insurance
- −$37
- HOA
- −$0
- Vacancy / Maint / Mgmt
- −$265
- Net cashflow
- $409
Break-even live
UW: 25.0% down · 7.5% · 30yr · 1.5% tax · 5.0% vac · 8.0% maint · 8.0% mgmt
Financing live
Cash to close
- Down payment
- $22,250
- Closing costs
- $2,670
- Reserves months
- —
- Total cash needed
- —
Loan-product check · same deal, 3 products live
Conventional
25% down · 7.5% · 30yr
- Down + closing
- —
- Monthly P&I
- —
- Monthly cashflow
- —
- DSCR
- —
- Eligible?
- —
Personal DTI + credit; lowest rate.
DSCR
20% down · 8.5% · 30yr
- Down + closing
- —
- Monthly P&I
- —
- Monthly cashflow
- —
- DSCR
- —
- Eligible?
- —
No personal income docs; deal must DSCR.
Hard money
10% down · 12.0% · 12mo
- Down + closing
- —
- Monthly P&I
- —
- Monthly cashflow
- —
- DSCR
- —
- Eligible?
- —
Short-term bridge; refi at stabilization.
Rent comps 10 comps
| Address | Beds | Baths | Sqft | Rent | $/sqft | DOM | Units | Dist |
|---|---|---|---|---|---|---|---|---|
| 426 S Washington St Unit 1520922P Siloam Springs, AR | 1.0 | 1.0 | 699 | $2,608 | $3.73 | 21d | 1 | 0.17mi |
| 400 E Twin Springs St Unit 1 Siloam Springs, AR | 2.0 | 1.0 | 1000 | $1,400 | $1.40 | 23d | 1 | 0.20mi |
| 250 N Madison St Unit c Siloam Springs, AR | 2.0 | 1.5 | 960 | $1,095 | $1.14 | 23d | 1 | 0.45mi |
| 605 W Benton St Unit C Siloam Springs, AR | 2.0 | 1.5 | 1120 | $1,050 | $0.94 | 13d | 1 | 0.71mi |
| 460 N Garrett St Unit D Siloam Springs, AR | 2.0 | 1.0 | 1020 | $1,000 | $0.98 | 23d | 1 | 0.72mi |
| 207 E Franklin St Unit 1520952P Siloam Springs, AR | 2.0 | 2.0 | 1119 | $2,901 | $2.59 | 14d | 1 | 0.75mi |
| 806 W Tahlequah St Unit B Siloam Springs, AR | 1.0 | 1.0 | 600 | $875 | $1.46 | 13d | 1 | 0.83mi |
| 2004 Azlin Pl Siloam Springs, AR | 2.0 | 1.5 | 1100 | $1,250 | $1.14 | 23d | 1 | 0.85mi |
| 1707 Montclair Ave Siloam Springs, AR | 3.0 | 2.0 | 1101 | $1,399 | $1.27 | 13d | 2 | 0.94mi |
| 1050 N Britt St Siloam Springs, AR | 1.0–2.0 | 1.0–2.0 | 881 | $1,100 | $1.25 | 13d | 5 | 0.95mi |
Listing history 6 events
-
2026-05-11price $89,000 941-char remark
Show marketing remark (941 chars)
Investor special in the heart of Siloam Springs! This property at 605 Maxwell St offers a compelling opportunity with an attractive price per square foot, making it an excellent value-add deal. Whether you’re looking to renovate, hold, live in, or reposition for resale, the numbers make sense here. The layout and location also lend themselves well to multiple exit strategies, including long-term rental income, mid-term furnished housing, or even a short-term rental setup. Potential for bed/bath additions. For owner-occupants, this is a chance to renovate and customize a home to your liking while building equity over time. Investors will appreciate the flexibility and upside potential, while homeowners can take advantage of a lower entry price and create their ideal living space. Don’t miss this versatile opportunity with strong upside, whether you’re expanding your portfolio or planning your next home project!
-
2026-04-24price $94,500 941-char remark
Show marketing remark (941 chars)
Investor special in the heart of Siloam Springs! This property at 605 Maxwell St offers a compelling opportunity with an attractive price per square foot, making it an excellent value-add deal. Whether you’re looking to renovate, hold, live in, or reposition for resale, the numbers make sense here. The layout and location also lend themselves well to multiple exit strategies, including long-term rental income, mid-term furnished housing, or even a short-term rental setup. Potential for bed/bath additions. For owner-occupants, this is a chance to renovate and customize a home to your liking while building equity over time. Investors will appreciate the flexibility and upside potential, while homeowners can take advantage of a lower entry price and create their ideal living space. Don’t miss this versatile opportunity with strong upside, whether you’re expanding your portfolio or planning your next home project!
-
2026-04-12$99,000 Active 941-char remark
Show marketing remark (941 chars)
Investor special in the heart of Siloam Springs! This property at 605 Maxwell St offers a compelling opportunity with an attractive price per square foot, making it an excellent value-add deal. Whether you’re looking to renovate, hold, live in, or reposition for resale, the numbers make sense here. The layout and location also lend themselves well to multiple exit strategies, including long-term rental income, mid-term furnished housing, or even a short-term rental setup. Potential for bed/bath additions. For owner-occupants, this is a chance to renovate and customize a home to your liking while building equity over time. Investors will appreciate the flexibility and upside potential, while homeowners can take advantage of a lower entry price and create their ideal living space. Don’t miss this versatile opportunity with strong upside, whether you’re expanding your portfolio or planning your next home project!
-
2026-03-03soldstatus $35,000
-
2025-08-15price $155,000
-
1996-07-31soldstatus $40,000
ⓘ Source: listings_history table (triggers on properties + properties_extension) + one-shot
backfill from property_details.listing_events for pre-trigger history.
Tax reassessment forecast AR · Resets to sale price
- Current annual tax
- $1,007 · $84/mo
- Projected year-2 tax
- $1,007 · $84/mo
- Expected delta
- $0/yr ($0/mo · 0.0%)
ⓘ Screening estimate from a state-policy table — verify with the county assessor before closing.
Climate risk First Street
- Flood 1/10 Low FEMA zone X (unshaded) · 0% chance over 30 yrs
- Wildfire 6/10 Major
- Heat 5/10 Major 7 d/yr ≥106°F today · 20 d/yr by 30 yrs out
- Wind 2/10 Low 2% chance of damaging wind over 30 yrs
- Air quality 2/10 Low 1 unhealthy d/yr today · 2 by 30 yrs out
Nearby sold comps map
Loading sold comps map…
Walkable amenities ~0.75 mi
Loading nearby amenities…
Taxation est. · year 1
- Rental income
- $15,137
- − Mortgage interest
- −$4,985
- − Property taxes
- −$1,007
- − Insurance
- −$445
- − Repairs & maintenance
- −$1,211
- − Management
- −$1,211
- − Depreciation
- −$2,589
- Taxable income
- $3,689
- Est. tax owed @ 24.0%
- −$885
- After-tax cash flow
- $4,020/yr
For passive investors: Depreciation is non-cash, so a rental often shows a tax loss while cash-flowing — sheltering income. Rental losses are passive: they offset passive income freely, and up to $25,000/yr can offset ordinary (W-2) income if you actively participate and your MAGI is under $100k (phasing out to $0 by $150k); unused losses carry forward. On sale, claimed depreciation is recaptured at up to 25%, and gains may owe capital-gains tax (a 1031 exchange can defer both). Figures are a year-1 estimate at your 24.0% rate — not tax advice; consult a CPA.
Schools (NCES district)
- District
- Siloam Springs School District
- NCES district ID
- 0512450
- Math proficiency
- 44% ▼ -7.00%
- Reading proficiency
- 40% ▼ -2.00%
- Median HH income
- $46,222
- Composite
- 35.81/100
- National rank
- #4828
- State rank
- #53 of 238 in AR
Livability — Siloam Springs
- Score
- 74/100
- State rank
- #17
- US rank
- #4621
Category grades
Schools grade is shown separately in the Schools card above.
Census & demographics
- Census place
- Siloam Springs, AR
- County
- Benton County · 259,241 people
- City population
- 24,745
- Metro
- Fayetteville-Springdale-Rogers, AR
- Population (ZIP)
- 24,745
- Household income
- $76,122
- Rent vs Own
- Severe rent burden
- 176.0
Population outlook (Benton County) Hauer SSP2
- Today (2025)
- 318,683 people
- By 2030
- 353,481 · +10.9%
- By 2040
- 425,280 · +33.4%
- By 2050
- 497,239 · +56.0%
- By 2075
- 662,114 · +107.8%
- By 2100
- 776,431 · +143.6%
Race, ethnicity, and origin ACS 2023
- Neighborhood character
- Diverse neighborhood (Simpson 0.63)
- Race & ethnicity
- White 58% Two or more races 24% Hispanic / Latino 19% Native American 4% Asian 3%
- Hispanic origin (detail)
- Mexican 8% Puerto Rican 2%
- Common ancestry
- Italian 2% Slovak 1% Serbian 1%
- Foreign-born
- 11% · Canada
- Languages at home
- 85% English-only · Spanish 13% Other Indo-European 1%
Political lean MEDSL · Benton
- 2024 margin
- Strong R (+27.0) · D 35.2% · R 62.1% · Other 2.7%
- 2008→2024 swing
- +9.6pp toward D · 2008: -36.5pp · 2024: -27.0pp
- All cycles
- 2024: R+27.0 2020: R+26.4 2016: R+34.9 2012: R+40.4 2008: R+36.5
Not yet ingested
- Civics
- —
Market trends
- HPI YoY
- ▼ -45.93%
- Current HPI
- 291.1062
- Rent YoY
- —
- Metro
- Fayetteville-Springdale-Rogers, AR
- State GDP YoY
- ▲ 3.80%
- F500 in state
- 10
Industry mix (Fortune 500 HQ in AR)
| Industry | F500 HQs | Revenue |
|---|---|---|
| Retail | 1 | $681B |
|
||
| Food / Agriculture | 1 | $53B |
|
||
| Retail / Energy | 1 | $22B |
|
||
| Transportation / Logistics | 1 | $12B |
|
||
| Energy | 1 | $4B |
|
||
Price history
+122.5% since first listed6 events — show timeline
- 2026-05-11 Price Changed $89,000 NWARMLS
- 2026-04-24 Price Changed $94,500 NWARMLS
- 2026-04-12 Listed $99,000 NWARMLS
- 2026-03-03 Sold (Public Records) $35,000 Public Records
- 2025-08-15 Price Changed $155,000 NWARMLS
- 1996-07-31 Sold (Public Records) $40,000 Public Records
Property tax history
+6.5%/yrLatest (2025): $1,007 · +10.2% YoY. Source: county tax records.
Cash-flow waterfall
monthlySold comps — $/sqft
last 12 mo · ≤1 miLoading sold comps…