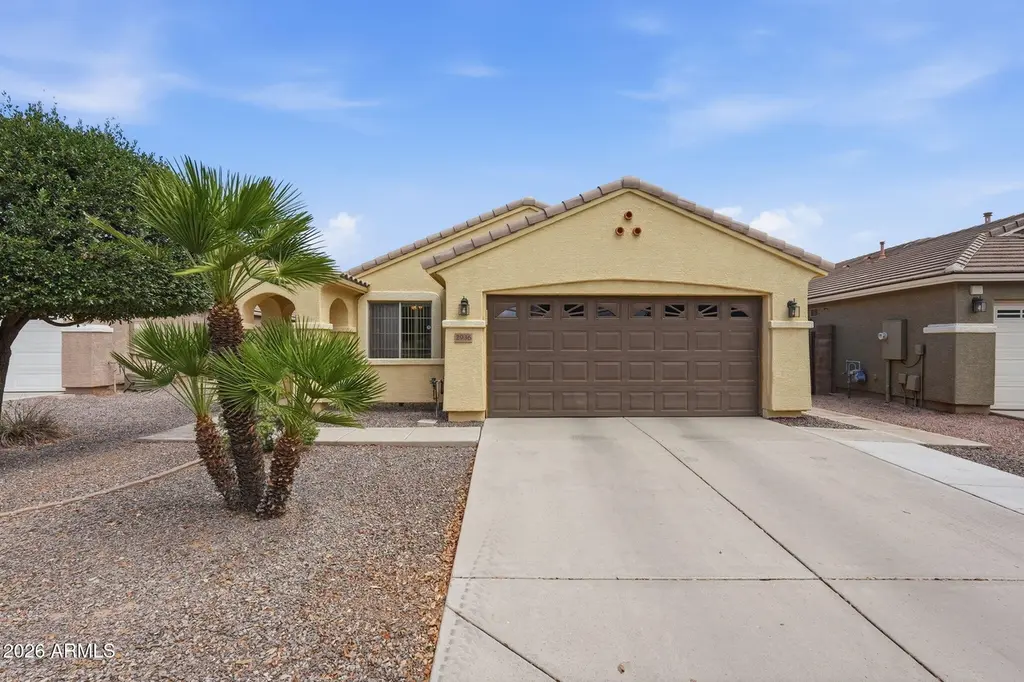
2936 E Crescent Way · Gilbert, AZ
Flood risk 1/10 · Minimal
- FEMA flood zone
- X (shaded)
- Chance of flooding over 30 yrs
- 0.0%
- Est. flood insurance / yr
- $507 – $1,088
Fire risk 5/10 · Moderate
- Est. fire insurance / yr
- $610 – $1,132
Heat risk 9/10 · Severe
- Hot days now (above 112°F)
- 7 days/yr
- Hot days in 30 yrs
- 19 days/yr
Wind risk 1/10 · Minimal
- Chance of severe wind over 30 yrs
- —
Air-quality risk 2/10 · Minimal
- Unhealthy air days now
- 0 days/yr
- Unhealthy air days in 30 yrs
- 1 days/yr
Risk factors via First Street. Map © Google.
Why this score? — see what drove the D grade
The composite is a weighted blend of 9 inputs, each scored 0–100. Each bar is that input's sub-score; the figure is the points it added to the 100-point composite (weight × sub-score).
- ARV discount +9.5/15.0
- Appreciation +9.2/10.0
- Cash flow +6.6/30.0
- Schools +4.8/10.0
- Livability +4.4/5.0
- Rent growth +3.6/5.0
- Condition / age +2.5/5.0
- DSCR +0.9/10.0
- 1% rule +0.7/10.0
$459,000
🖨 Deal sheet 📄 Offer letter ✓ Due diligence
Listing remarks MLS
***VACANT LOCKBOX VACANT*** Completed spec home! Please call sales office for more incentive information. HOURS; SAT-THURS 10-6, FRI, 12-6.
Key facts
- 6,178 sq ft lot
- 2 garage spots
- Built 2007
Property features AI
Finance
- Financial info: Current financing: Conventional
- HOA & community: Community association with quarterly fee; Association fee covers grounds maintenance; Association restricts visible trucks, trailers, RVs, and boats
Exterior
- Parking: 2 covered parking spaces; 2 open parking spaces; 2-car garage with garage door opener
- Utilities: City water; Public sewer
- Home design: Single family residence; Fee simple ownership
- Construction: Stucco and painted wood frame construction; Tile roof
- Exterior features: Sprinklers in front and rear; Desert front and back landscaping; Block and wrought iron fencing; Asphalt road access; Playground and biking/walking path in community
Interior
- Kitchen: Built-in microwave; Refrigerator; Dishwasher; Garbage disposal; Kitchen island; Pantry; Laminate countertops; Eat-in kitchen
- Bedrooms: Up to 4 bedrooms
- Flooring: Carpet; Tile
- Bathrooms: 2 full bathrooms
- Heating & cooling: Heat pump with natural gas; Central air; Ceiling fans; Programmable thermostat
- Interior features: High-speed internet; Double vanity in bath; Eat-in kitchen; Vaulted ceilings; Kitchen island; Pantry; 3/4 master bath; Laminate counters; Dual-pane windows
- Laundry & utility: Inside laundry
Neighborhood map
What this means for you Summary
Snapshot
- This is a 3-bed/3.0-bath single-family listed at $459k.
Deal economics
- At list price, monthly cash flow is $-754 ($-9k/yr) — negative.
- To cash-flow at today's rent, offer at most $326k (29.0% below list).
- To meet the 1% rule (rent ≥ 1% of price), the offer needs to be $264k (42.6% below list).
- Recommended offer: $264k (42.6% below list) — sets the bar for 1% rule.
- Cap rate 4.3% vs local median 3.2% in Gilbert — top-decile yield for the area; either an underpriced asset or a hidden risk that comps aren't pricing in. Stress-test before assuming the spread holds.
Location & tenants
- Location reads 87/100 on livability (#1 in AZ, #240 nationally) — a professional / high-income tenant draw. Strengths: amenities A+, employment A+, housing A+; Watch: health & safety C-, cost of living F.
- Chandler Unified District #80 (4242) (suburban): math 49% / reading 57% proficiency, ranked #31 of 249 in AZ (top 12%) — acceptable for families but not a draw, mixed tenant base, ~2y average lease.
- Zoned schools: Chandler Traditional Academy-Freedom (math 71% / reading 74%, grade A, #42 of 1,109 statewide, top 4%, 619 students, 9% FRL); Dr. Camille Casteel High School (math 45% / reading 53%, grade D, #43 of 381 statewide, top 11%, 3,140 students, 12% FRL).
- Market conditions: Rents rising fast (+4.3%/yr); 329 active listings in the ZIP; 19 comparable units currently listed for rent nearby; rentals at typical pace (median 17d on market — plan ~3-4 weeks tenant-placement turnaround); high-income renter base; 36,011 units permitted in Maricopa County in 2024 (12,801 in 5+ unit buildings).
Forward outlook
- In year one you build about $42k of equity ($3k loan paydown + $38k appreciation (8.4% local appreciation)).
- Maricopa County population projected at +38% by 2050 — long-run rental-demand tailwind backs the buy-and-hold thesis.
- By year 2, paydown + projected appreciation supports a ~$67k cash-out refi (75% LTV) — recoverable capital for the next deal without selling this one.
Negotiation context
- It's been on market 34 days — a 3% lower offer ($445k) is reasonable based on typical stale-listing flexibility.
- 3 sale attempts since 19y ago with the ask held roughly flat each time — persistent listings suggest the price (not the market) is what's stuck; bring a comps-based counter.
- Current owner paid $234k; list at $459k implies a 96% gain — meaningful room to come down on a strong offer.
Risks & watch-outs
- Climate carrying-cost: moderate wildfire risk; extreme-heat days projected 7→19/yr by 2055 (HVAC capex compounding) — expect insurance premiums to compound above CPI over the hold.
Questions for the listing agent
- What do current leases actually rent for vs. the listed asking? Can we see a recent rent roll and the last 12 months of T-12 income?
- It's been on market 34 days. Have you received any prior offers? Is the seller open to a 43% concession, seller financing, or rate buy-down credit?
- What does the HOA fee cover, when was the last increase, and are there any pending special assessments or reserve-fund shortfalls?
- Is there a deadline driving the sale (1031 exchange, divorce, estate, relocation)? That informs how much negotiation room exists.
- Schools are A-rated — typically a magnet for longer-tenancy family renters. What's the average tenant stay here, and is there a school-zone premium baked into asking?
- The area grade is low — what's the realistic commute time and amenity access for the typical tenant pool here? Any planned neighborhood developments (good or bad) we should know about?
- What's the average days-on-market for RENTAL listings here right now (not sales)? A rising rental-DOM trend means longer vacancies and softer asking-rent achievability than the comps imply.
- What's the recent tenant-quality profile in this submarket — average credit score on applications, eviction rate, late-payment / NSF rate, and stable-employment percentage? A property-management company in the area should have these aggregated.
- How much new for-sale + rental construction is in the pipeline within 1–3 miles? Heavy new supply typically softens prices + rents 12–24 months out; constrained supply supports both.
Investment metrics
- 1% rule
- 0.57% ✗
- Cap rate
- 4.32%
- Cash-on-cash
- -7.04%
- DSCR
- 0.69
- GRM
- 14.5
CMA / ARV
- ARV (on-the-fly)
- $480,441
- Comps found
- 12
Show comp detail 12 sales within ~0.75 mi
| Address | Dist | Beds/Ba | Sqft | Sold | Price | $/sf | Match |
|---|---|---|---|---|---|---|---|
| 2937 E Aris Dr | 0.06mi | 3/2.0 | 1,651 (0%) | 4mo | $470,000 | $285 | 90 |
| 6028 S Connie Ln | 0.11mi | 4/2.0 (+1) | 1,651 (0%) | 5mo | $526,000 | $319 | 82 |
| 2943 E Mead Dr | 0.06mi | 4/2.0 (+1) | 1,651 (0%) | 8mo | $466,000 | $282 | 81 |
| 3021 E Tonto Dr | 0.17mi | 4/2.0 (+1) | 1,651 (0%) | 3mo | $455,000 | $276 | 81 |
| 2904 E Mead Dr | 0.08mi | 4/2.0 (+1) | 1,651 (0%) | 9mo | $500,000 | $303 | 80 |
| 6482 S Claiborne Ave | 0.61mi | 3/2.0 | 1,652 (+0%) | 10mo | $480,000 | $291 | 59 |
| 6092 S Bridal Vail Dr | 0.58mi | 3/2.0 | 1,749 (+6%) | 1mo | $535,000 | $306 | 58 |
| 5871 S Parkcrest St | 0.49mi | 3/2.0 | 1,762 (+7%) | 5mo | $500,000 | $284 | 58 |
| 3298 E Morning Star Ln | 0.71mi | 3/2.5 | 1,675 (+2%) | 10mo | $455,000 | $272 | 54 |
| 3284 E Powell Ct | 0.50mi | 3/2.0 | 1,486 (-10%) | 10mo | $440,000 | $296 | 47 |
| 3435 E Anika Ct | 0.61mi | 4/2.0 (+1) | 1,749 (+6%) | 7mo | $485,000 | $277 | 47 |
| 2590 E Penedes Dr | 0.66mi | 4/2.0 (+1) | 1,762 (+7%) | 5mo | $564,000 | $320 | 45 |
Match score weights: distance 35% · size 25% · config 20% · recency 20%. Top-matched comps best support the ARV.
Projected returns pro-forma
8.36% appreciation · 4.31% rent growth · sell at horizon
- IRR
- 15.9%
- Equity multiple
- 2.21×
- Total profit
- $155,136
- Equity at exit
- $360,108
- IRR
- 15.6%
- Equity multiple
- 4.84×
- Total profit
- $493,787
- Equity at exit
- $725,960
Cash invested: $128,520 (down + closing). Projections, not guarantees.
Landlord ↔ Tenant lean methodology
- Overall (STATE)
- 87 Strongly Landlord-Friendly
- State Arizona
- 87 Strongly Landlord-Friendly · R+3
- County
- — inherits STATE
- City
- — inherits STATE
ZIP-level market 85298
- Home prices YoY
- 2.5%
- Rents YoY
- 4.3%
- Active inventory
- 329
- Price-to-rent
- 14.5×
Monthly cashflow live
- Estimated rent
- $2,637 high interval (Pro) →
- Mortgage (P&I)
- −$2,407
- Tax from tax record
- −$134 /mo · $1,602/yr
- Insurance
- −$191
- HOA
- −$105
- Vacancy / Maint / Mgmt
- −$554
- Net cashflow
- $-754
Break-even live
UW: 25.0% down · 7.5% · 30yr · 1.5% tax · 5.0% vac · 8.0% maint · 8.0% mgmt
Financing live
Cash to close
- Down payment
- $114,750
- Closing costs
- $13,770
- Reserves months
- —
- Total cash needed
- —
Loan-product check · same deal, 3 products live
Conventional
25% down · 7.5% · 30yr
- Down + closing
- —
- Monthly P&I
- —
- Monthly cashflow
- —
- DSCR
- —
- Eligible?
- —
Personal DTI + credit; lowest rate.
DSCR
20% down · 8.5% · 30yr
- Down + closing
- —
- Monthly P&I
- —
- Monthly cashflow
- —
- DSCR
- —
- Eligible?
- —
No personal income docs; deal must DSCR.
Hard money
10% down · 12.0% · 12mo
- Down + closing
- —
- Monthly P&I
- —
- Monthly cashflow
- —
- DSCR
- —
- Eligible?
- —
Short-term bridge; refi at stabilization.
Rent comps 19 comps
| Address | Beds | Baths | Sqft | Rent | $/sqft | DOM | Units | Dist |
|---|---|---|---|---|---|---|---|---|
| 2927 E Mead Dr Gilbert, AZ | 4.0 | 2.0 | 1651 | $2,250 | $1.36 | 18d | 1 | 0.07mi |
| 2954 E Coconino Dr Gilbert, AZ | 4.0 | 2.0 | 2180 | $2,590 | $1.19 | 2d | 1 | 0.25mi |
| 3329 E Powell Ct Gilbert, AZ | 3.0 | 2.0 | 1486 | $2,345 | $1.58 | 14d | 1 | 0.55mi |
| 2971 E Ridgewood Ln Gilbert, AZ | 3.0 | 2.0 | 1675 | $2,380 | $1.42 | 43d | 1 | 0.67mi |
| 3486 E Anika Ct Gilbert, AZ | 4.0 | 2.0 | 1749 | $2,600 | $1.49 | 43d | 1 | 0.68mi |
| 3462 E Powell Way Gilbert, AZ | 3.0 | 2.0 | 1665 | $2,295 | $1.38 | 24d | 1 | 0.68mi |
| 3067 E Palmdale Ln Gilbert, AZ | 3.0 | 2.0 | 1675 | $2,300 | $1.37 | 14d | 1 | 0.77mi |
| 6770 S Tucana Ln Gilbert, AZ | 3.0 | 2.0 | 2070 | $4,500 | $2.17 | 24d | 1 | 0.95mi |
| 3636 E Lodgepole Dr Gilbert, AZ | 3.0 | 2.0 | 1818 | $3,075 | $1.69 | 16d | 1 | 1.12mi |
| 2304 E Kelly Dr Gilbert, AZ | 4.0 | 2.0 | 1797 | $2,400 | $1.34 | 12d | 1 | 1.17mi |
| 3808 E Flower Ct Gilbert, AZ | 3.0 | 2.5 | 1628 | $2,095 | $1.29 | 4d | 1 | 1.17mi |
| 3725 E Meadowview Dr Gilbert, AZ | 3.0 | 2.0 | 1404 | $2,750 | $1.96 | 24d | 1 | 1.17mi |
| 3443 E Riopelle Ave Gilbert, AZ | 3.0 | 2.0 | 1284 | $2,350 | $1.83 | 43d | 1 | 1.18mi |
| 3710 E Lodgepole Dr Gilbert, AZ | 3.0 | 2.0 | 1818 | $2,650 | $1.46 | 12d | 1 | 1.20mi |
| 3868 E Palmer St Gilbert, AZ | 3.0 | 2.5 | 1899 | $2,000 | $1.05 | 43d | 1 | 1.22mi |
| 6334 S Blake St Gilbert, AZ | 3.0 | 2.0 | 1421 | $2,100 | $1.48 | 43d | 1 | 1.24mi |
| 3147 E Vallejo Dr Gilbert, AZ | 3.0 | 2.0 | 2171 | $2,350 | $1.08 | 16d | 1 | 1.25mi |
| 5149 S Moccasin Trl Gilbert, AZ | 3.0 | 2.5 | 1675 | $2,750 | $1.64 | 14d | 1 | 1.30mi |
| 3068 E Ravenswood Dr Gilbert, AZ | 4.0 | 2.0 | 1815 | $2,550 | $1.40 | 12d | 1 | 1.41mi |
HOA detail
- Monthly dues
- $105 · $1,260/yr
Listing history 19 events
-
2026-06-13statusdays on market $459,000 Pending 34 DOM
-
2026-06-09days on market $459,000 Under Contract Accepting Backups 32 DOM
-
2026-06-08days on market $459,000 Under Contract Accepting Backups 31 DOM
-
2026-06-07days on market $459,000 Under Contract Accepting Backups 30 DOM
-
2026-06-04days on market $459,000 Under Contract Accepting Backups 27 DOM
-
2026-06-03days on market $459,000 Under Contract Accepting Backups 26 DOM
-
2026-06-02days on market $459,000 Under Contract Accepting Backups 25 DOM
-
2026-06-01days on market $459,000 Under Contract Accepting Backups 24 DOM
-
2026-05-31days on market $459,000 Under Contract Accepting Backups 23 DOM
-
2026-05-11historical Under Contract Accepting Backups
-
2026-05-08$459,000 Active
-
2015-12-22soldstatus $233,900
-
2015-11-10status Pending
-
2015-10-26price $233,990
-
2015-09-12price $239,000
-
2015-09-05$243,000 Active
-
2008-01-07soldstatus $241,605 139-char remark
Show marketing remark (139 chars)
***VACANT LOCKBOX VACANT*** Completed spec home! Please call sales office for more incentive information. HOURS; SAT-THURS 10-6, FRI, 12-6.
-
2008-01-04historical 139-char remark
Show marketing remark (139 chars)
***VACANT LOCKBOX VACANT*** Completed spec home! Please call sales office for more incentive information. HOURS; SAT-THURS 10-6, FRI, 12-6.
-
2007-05-11$248,765 139-char remark
Show marketing remark (139 chars)
***VACANT LOCKBOX VACANT*** Completed spec home! Please call sales office for more incentive information. HOURS; SAT-THURS 10-6, FRI, 12-6.
ⓘ Source: listings_history table (triggers on properties + properties_extension) + one-shot
backfill from property_details.listing_events for pre-trigger history.
Tax reassessment forecast AZ · Resets to sale price
- Current annual tax
- $1,602 · $134/mo
- Projected year-2 tax
- $3,029 · $252/mo
- Expected delta
- +$1,427/yr (+$119/mo · 89.0%)
ⓘ Screening estimate from a state-policy table — verify with the county assessor before closing.
Climate risk First Street
- Flood 1/10 Low FEMA zone X (shaded) · 0% chance over 30 yrs
- Wildfire 5/10 Major
- Heat 9/10 Extreme 7 d/yr ≥112°F today · 19 d/yr by 30 yrs out
- Wind 1/10 Low
- Air quality 2/10 Low 0 unhealthy d/yr today · 1 by 30 yrs out
Nearby sold comps map
Loading sold comps map…
Walkable amenities ~0.75 mi
Loading nearby amenities…
Taxation est. · year 1
- Rental income
- $31,641
- − Mortgage interest
- −$25,711
- − Property taxes
- −$1,602
- − Insurance
- −$2,295
- − Repairs & maintenance
- −$2,531
- − Management
- −$2,531
- − HOA
- −$1,260
- − Depreciation
- −$13,353
- Taxable loss
- −$17,643
- Est. tax savings @ 24.0%
- +$4,234
- After-tax cash flow
- $-4,811/yr
For passive investors: Depreciation is non-cash, so a rental often shows a tax loss while cash-flowing — sheltering income. Rental losses are passive: they offset passive income freely, and up to $25,000/yr can offset ordinary (W-2) income if you actively participate and your MAGI is under $100k (phasing out to $0 by $150k); unused losses carry forward. On sale, claimed depreciation is recaptured at up to 25%, and gains may owe capital-gains tax (a 1031 exchange can defer both). Figures are a year-1 estimate at your 24.0% rate — not tax advice; consult a CPA.
Schools (NCES district)
- District
- Chandler Unified District #80 (4242)
- NCES district ID
- 0401870
- Math proficiency
- 49% ▼ -8.00%
- Reading proficiency
- 57% ▼ -2.00%
- Median HH income
- $74,048
- Composite
- 47.54/100
- National rank
- #2268
- State rank
- #31 of 249 in AZ
Livability — Gilbert
- Score
- 87/100
- State rank
- #1
- US rank
- #240
Category grades
Schools grade is shown separately in the Schools card above.
Census & demographics
- Census place
- Gilbert, AZ
- County
- Maricopa County · 4,537,380 people
- City population
- 281,769
- Metro
- Phoenix-Mesa-Chandler, AZ
- Population (ZIP)
- 44,114
- Household income
- $156,425
- Rent vs Own
- Severe rent burden
- 173.0
Population outlook (Maricopa County) Hauer SSP2
- Today (2025)
- 4,979,203 people
- By 2030
- 5,378,229 · +8.0%
- By 2040
- 6,156,598 · +23.6%
- By 2050
- 6,872,376 · +38.0%
- By 2075
- 8,401,270 · +68.7%
- By 2100
- 9,247,439 · +85.7%
Race, ethnicity, and origin ACS 2023
- Neighborhood character
- Predominantly White (72%)
- Race & ethnicity
- White 72% Hispanic / Latino 14% Two or more races 11% Asian 7% Black 2%
- Hispanic origin (detail)
- Mexican 10%
- Common ancestry
- Italian 4% Romanian 3% Lithuanian 3%
- Foreign-born
- 9% · Canada, China, Vietnam
- Languages at home
- 85% English-only · Spanish 7% Other Indo-European 2% Chinese 1%
Political lean MEDSL · Maricopa
- 2024 margin
- Toss-up / Even · D 47.7% · R 51.2% · Other 1.1%
- 2008→2024 swing
- +7.1pp toward D · 2008: -10.6pp · 2024: -3.5pp
- All cycles
- 2024: R+3.5 2020: D+2.2 2016: R+3.5 2012: R+12.0 2008: R+10.6
Not yet ingested
- Civics
- —
Market trends
- HPI YoY
- ▲ 8.36%
- Current HPI
- 343.6932
- Rent YoY
- ▲ 4.31%
- Metro
- Phoenix-Mesa-Chandler, AZ
- State GDP YoY
- ▲ 4.54%
- F500 in state
- 20
Industry mix (Fortune 500 HQ in AZ)
| Industry | F500 HQs | Revenue |
|---|---|---|
| Technology | 2 | $13B |
|
||
| Mining / Metals | 1 | $23B |
|
||
| Environmental Services | 1 | $16B |
|
||
| Metals / Steel | 1 | $14B |
|
||
| Technology Distribution | 1 | $9B |
|
||
| Homebuilding | 1 | $8B |
|
||
Price history
+84.5% since first listed10 events — show timeline
- 2026-05-11 Contingent — ARMLS
- 2026-05-08 Listed $459,000 ARMLS
- 2015-12-22 Sold (Public Records) $233,900 Public Records
- 2015-11-10 Pending — ARMLS
- 2015-10-26 Price Changed $233,990 ARMLS
- 2015-09-12 Price Changed $239,000 ARMLS
- 2015-09-05 Listed $243,000 ARMLS
- 2008-01-07 Sold (MLS) $241,605 ARMLS
- 2008-01-04 Listing Removed — ARMLS
- 2007-05-11 Listed $248,765 ARMLS
Property tax history
+0.0%/yrLatest (2025): $1,602 · +0.9% YoY. Source: county tax records.
Cash-flow waterfall
monthlySold comps — $/sqft
last 12 mo · ≤1 miLoading sold comps…