936 W Sullivan St · Miami, AZ
Flood risk 1/10 · Minimal
- FEMA flood zone
- X (unshaded)
- Chance of flooding over 30 yrs
- 0.0%
- Est. flood insurance / yr
- $507 – $1,088
Fire risk 5/10 · Moderate
- Est. fire insurance / yr
- $610 – $1,132
Heat risk 6/10 · Moderate
- Hot days now (above 97°F)
- 7 days/yr
- Hot days in 30 yrs
- 21 days/yr
Wind risk 1/10 · Minimal
- Chance of severe wind over 30 yrs
- —
Air-quality risk 1/10 · Minimal
- Unhealthy air days now
- 0 days/yr
- Unhealthy air days in 30 yrs
- 0 days/yr
Risk factors via First Street. Map © Google.
Why this score? — see what drove the B- grade
The composite is a weighted blend of 9 inputs, each scored 0–100. Each bar is that input's sub-score; the figure is the points it added to the 100-point composite (weight × sub-score).
- Cash flow +30.0/30.0
- 1% rule +10.0/10.0
- DSCR +10.0/10.0
- ARV discount +5.1/15.0
- Appreciation +3.5/10.0
- Livability +2.7/5.0
- Rent growth +2.5/5.0
- Condition / age +2.5/5.0
- Schools +1.1/10.0
$60,000
🖨 Deal sheet 📄 Offer letter ✓ Due diligence
Listing remarks MLS
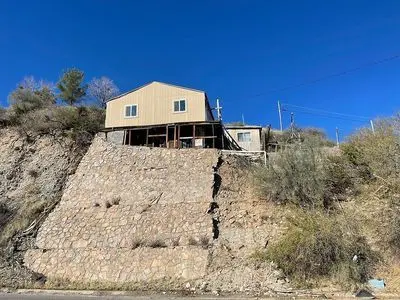
Top of the hill - perched near the top of M Mountain - beautiful views of downtown Miami - Fix up 1920's house - great for first time buyer, investor, rental, etc - great price.
Key facts
- Built 1950
- Listed 23 days
Neighborhood map
What this means for you Summary
Snapshot
- This is a 3-bed/1.0-bath single-family listed at $60k.
Deal economics
- At list price, monthly cash flow is $662 ($8k/yr) — positive.
- The deal already cash-flows at list — no discount required.
- Meets the 1% rule at list price ($1k rent vs $60k).
- Recommended offer: $59k (1.5% below list) — sets the bar for market timing.
Location & tenants
- Location reads 53/100 on livability (#289 in AZ) — a working-class tenant base; expect higher turnover. Strengths: cost of living A+, housing A, crime B+; Watch: schools F, amenities F, commute F.
- Miami Unified District (4211) (rural): math 8% / reading 19% proficiency, ranked #221 of 249 in AZ (top 89%) — low school quality limits family demand, transient renter base, plan for 1-2y turnover.
- Market conditions: 31 active listings in the ZIP; 1 comparable units currently listed for rent nearby; 217 units permitted in Gila County in 2024 (0 in 5+ unit buildings).
Forward outlook
- Local home prices are declining (-2.9%/yr); year-one equity from $415 of loan paydown is wiped out by about $2k of value loss. Plan a longer hold.
- Gila County population projected at -18% by 2050 — secular population decline; favor cash flow + early exit over multi-decade hold.
- At projected returns (-2.9% appreciation + 3.0% rent growth), your $17k cash investment doubles in ~3 years — after that, you're playing with house money.
Negotiation context
- It's been on market 24 days — a 2% lower offer ($59k) is reasonable based on typical stale-listing flexibility.
- 3 sale attempts since 4y ago with the ask held roughly flat each time — persistent listings suggest the price (not the market) is what's stuck; bring a comps-based counter.
- Current owner paid $20k; list at $60k implies a 200% gain — meaningful room to come down on a strong offer.
Risks & watch-outs
- Watch-outs: built in 1950 — expect roof / HVAC / electrical / plumbing capex.
- Climate carrying-cost: moderate wildfire risk; extreme-heat days projected 7→21/yr by 2055 (HVAC capex compounding) — expect insurance premiums to compound above CPI over the hold.
Questions for the listing agent
- Built in 1950 — when were the roof, HVAC, electrical panel, plumbing, and water heater last replaced?
- Is there a deadline driving the sale (1031 exchange, divorce, estate, relocation)? That informs how much negotiation room exists.
- Schools are F-rated, which usually means shorter tenancies and higher turnover. Who's the typical renter profile here, and what's been the actual vacancy rate?
- What's the average days-on-market for RENTAL listings here right now (not sales)? A rising rental-DOM trend means longer vacancies and softer asking-rent achievability than the comps imply.
- What's the recent tenant-quality profile in this submarket — average credit score on applications, eviction rate, late-payment / NSF rate, and stable-employment percentage? A property-management company in the area should have these aggregated.
- How much new for-sale + rental construction is in the pipeline within 1–3 miles? Heavy new supply typically softens prices + rents 12–24 months out; constrained supply supports both.
Investment metrics
- 1% rule
- 2.17% ✓
- Cap rate
- 19.53%
- Cash-on-cash
- 47.27%
- DSCR
- 3.10
- GRM
- 3.8
CMA / ARV
- ARV (on-the-fly)
- $57,015
- Comps found
- 4
Show comp detail 4 sales within ~0.75 mi
| Address | Dist | Beds/Ba | Sqft | Sold | Price | $/sf | Match |
|---|---|---|---|---|---|---|---|
| 1157 W Frederick St | 0.27mi | 3/1.0 | 1,004 (+11%) | 6mo | $149,000 | $148 | 64 |
| 512 W Pinto St | 0.34mi | 3/1.0 | 1,040 (+15%) | 1mo | $50,000 | $48 | 59 |
| 512 W Pinto St | 0.34mi | 3/1.0 | 1,040 (+15%) | 2mo | $65,000 | $63 | 58 |
| 239 S Latham Blvd | 0.69mi | 2/1.0 (-1) | 816 (-10%) | 17mo | $45,000 | $55 | 32 |
Match score weights: distance 35% · size 25% · config 20% · recency 20%. Top-matched comps best support the ARV.
Projected returns pro-forma
-2.92% appreciation · 3.0% rent growth · sell at horizon
- IRR
- 44.7%
- Equity multiple
- 2.94×
- Total profit
- $32,608
- Equity at exit
- $9,149
- IRR
- 50.6%
- Equity multiple
- 5.93×
- Total profit
- $82,789
- Equity at exit
- $5,537
Cash invested: $16,800 (down + closing). Projections, not guarantees.
Landlord ↔ Tenant lean methodology
- Overall (STATE)
- 87 Strongly Landlord-Friendly
- State Arizona
- 87 Strongly Landlord-Friendly · R+3
- County
- — inherits STATE
- City
- — inherits STATE
ZIP-level market 85539
- Home prices YoY
- -1.4%
- Active inventory
- 31
- Price-to-rent
- 3.8×
Monthly cashflow live
- Estimated rent
- $1,300 medium interval (Pro) →
- Mortgage (P&I)
- −$315
- Tax from tax record
- −$26 /mo · $307/yr
- Insurance
- −$25
- HOA
- −$0
- Vacancy / Maint / Mgmt
- −$273
- Net cashflow
- $662
Break-even live
UW: 25.0% down · 7.5% · 30yr · 1.5% tax · 5.0% vac · 8.0% maint · 8.0% mgmt
Financing live
Cash to close
- Down payment
- $15,000
- Closing costs
- $1,800
- Reserves months
- —
- Total cash needed
- —
Loan-product check · same deal, 3 products live
Conventional
25% down · 7.5% · 30yr
- Down + closing
- —
- Monthly P&I
- —
- Monthly cashflow
- —
- DSCR
- —
- Eligible?
- —
Personal DTI + credit; lowest rate.
DSCR
20% down · 8.5% · 30yr
- Down + closing
- —
- Monthly P&I
- —
- Monthly cashflow
- —
- DSCR
- —
- Eligible?
- —
No personal income docs; deal must DSCR.
Hard money
10% down · 12.0% · 12mo
- Down + closing
- —
- Monthly P&I
- —
- Monthly cashflow
- —
- DSCR
- —
- Eligible?
- —
Short-term bridge; refi at stabilization.
Rent comps 1 comps
| Address | Beds | Baths | Sqft | Rent | $/sqft | DOM | Units | Dist |
|---|---|---|---|---|---|---|---|---|
| 1122 Bird St Unit A Miami, AZ | 2.0 | 1.0 | 1100 | $1,300 | $1.18 | 43d | 1 | 0.21mi |
Listing history 23 events
-
2026-06-19days on market $60,000 Active 24 DOM
-
2026-06-18days on market $60,000 Active 23 DOM
-
2026-06-17days on market $60,000 Active 22 DOM
-
2026-06-16days on market $60,000 Active 21 DOM
-
2026-06-15days on market $60,000 Active 20 DOM
-
2026-06-14days on market $60,000 Active 18 DOM
-
2026-06-12days on market $60,000 Active 17 DOM
-
2026-06-09days on market $60,000 Active 14 DOM
-
2026-06-08days on market $60,000 Active 13 DOM
-
2026-06-07days on market $60,000 Active 12 DOM
-
2026-06-07days on market $60,000 Active 11 DOM
-
2026-06-04days on market $60,000 Active 8 DOM
-
2026-06-02days on market $60,000 Active 7 DOM
-
2026-06-01days on market $60,000 Active 6 DOM
-
2026-05-31days on market $60,000 Active 5 DOM
-
2026-05-31days on market $60,000 Active 4 DOM
-
2026-05-26$60,000 Active
-
2022-08-16soldstatus $20,000 Closed 177-char remark
Show marketing remark (177 chars)
Top of the hill - perched near the top of M Mountain - beautiful views of downtown Miami - Fix up 1920's house - great for first time buyer, investor, rental, etc - great price.
-
2022-08-14status Pending 177-char remark
Show marketing remark (177 chars)
Top of the hill - perched near the top of M Mountain - beautiful views of downtown Miami - Fix up 1920's house - great for first time buyer, investor, rental, etc - great price.
-
2022-08-03price $25,000 177-char remark
Show marketing remark (177 chars)
Top of the hill - perched near the top of M Mountain - beautiful views of downtown Miami - Fix up 1920's house - great for first time buyer, investor, rental, etc - great price.
-
2022-06-21status Active 177-char remark
Show marketing remark (177 chars)
Top of the hill - perched near the top of M Mountain - beautiful views of downtown Miami - Fix up 1920's house - great for first time buyer, investor, rental, etc - great price.
-
2022-03-14status Pending 177-char remark
Show marketing remark (177 chars)
Top of the hill - perched near the top of M Mountain - beautiful views of downtown Miami - Fix up 1920's house - great for first time buyer, investor, rental, etc - great price.
-
2022-03-06$30,000 Active 177-char remark
Show marketing remark (177 chars)
Top of the hill - perched near the top of M Mountain - beautiful views of downtown Miami - Fix up 1920's house - great for first time buyer, investor, rental, etc - great price.
ⓘ Source: listings_history table (triggers on properties + properties_extension) + one-shot
backfill from property_details.listing_events for pre-trigger history.
Tax reassessment forecast AZ · Resets to sale price
- Current annual tax
- $307 · $26/mo
- Projected year-2 tax
- $396 · $33/mo
- Expected delta
- +$89/yr (+$7/mo · 29.2%)
ⓘ Screening estimate from a state-policy table — verify with the county assessor before closing.
Climate risk First Street
- Flood 1/10 Low FEMA zone X (unshaded) · 0% chance over 30 yrs
- Wildfire 5/10 Major
- Heat 6/10 Major 7 d/yr ≥97°F today · 21 d/yr by 30 yrs out
- Wind 1/10 Low
- Air quality 1/10 Low 0 unhealthy d/yr today · 0 by 30 yrs out
Nearby sold comps map
Loading sold comps map…
Walkable amenities ~0.75 mi
Loading nearby amenities…
Taxation est. · year 1
- Rental income
- $15,600
- − Mortgage interest
- −$3,361
- − Property taxes
- −$307
- − Insurance
- −$300
- − Repairs & maintenance
- −$1,248
- − Management
- −$1,248
- − Depreciation
- −$1,745
- Taxable income
- $7,391
- Est. tax owed @ 24.0%
- −$1,774
- After-tax cash flow
- $6,168/yr
For passive investors: Depreciation is non-cash, so a rental often shows a tax loss while cash-flowing — sheltering income. Rental losses are passive: they offset passive income freely, and up to $25,000/yr can offset ordinary (W-2) income if you actively participate and your MAGI is under $100k (phasing out to $0 by $150k); unused losses carry forward. On sale, claimed depreciation is recaptured at up to 25%, and gains may owe capital-gains tax (a 1031 exchange can defer both). Figures are a year-1 estimate at your 24.0% rate — not tax advice; consult a CPA.
Schools (NCES district)
- District
- Miami Unified District (4211)
- NCES district ID
- 0405030
- Math proficiency
- 8% ▼ -17.00%
- Reading proficiency
- 19% ▼ -5.00%
- Median HH income
- $33,063
- Composite
- 10.86/100
- National rank
- #9760
- State rank
- #221 of 249 in AZ
Livability — Miami
- Score
- 53/100
- State rank
- #289
- US rank
- #24461
Category grades
Schools grade is shown separately in the Schools card above.
Census & demographics
- Census place
- Miami, AZ
- Population (ZIP)
- 3,066
Population outlook (Gila County) Hauer SSP2
- Today (2025)
- 50,229 people
- By 2030
- 48,202 · -4.0%
- By 2040
- 44,101 · -12.2%
- By 2050
- 41,041 · -18.3%
- By 2075
- 37,536 · -25.3%
- By 2100
- 32,485 · -35.3%
Race, ethnicity, and origin ACS 2023
- Neighborhood character
- Diverse neighborhood (Simpson 0.63)
- Race & ethnicity
- Hispanic / Latino 47% White 39% Two or more races 33% Native American 5%
- Hispanic origin (detail)
- Mexican 44%
- Common ancestry
- Slovak 6% Italian 2% Romanian 2%
- Foreign-born
- 4% · Canada
- Languages at home
- 85% English-only · Spanish 12%
Political lean MEDSL · Gila
- 2024 margin
- Solid R (+37.6) · D 30.8% · R 68.4%
- 2008→2024 swing
- -9.8pp toward R · 2008: -27.8pp · 2024: -37.6pp
- All cycles
- 2024: R+37.6 2020: R+34.1 2016: R+32.4 2012: R+26.4 2008: R+27.8
Not yet ingested
- Civics
- —
Market trends
- HPI YoY
- ▼ -2.92%
- Current HPI
- 207.4672
- Rent YoY
- —
- Metro
- —
- State GDP YoY
- ▲ 4.54%
- F500 in state
- 20
Industry mix (Fortune 500 HQ in AZ)
| Industry | F500 HQs | Revenue |
|---|---|---|
| Technology | 2 | $13B |
|
||
| Mining / Metals | 1 | $23B |
|
||
| Environmental Services | 1 | $16B |
|
||
| Metals / Steel | 1 | $14B |
|
||
| Technology Distribution | 1 | $9B |
|
||
| Homebuilding | 1 | $8B |
|
||
Price history
+100.0% since first listed7 events — show timeline
- 2026-05-26 Listed $60,000 FSBO.com
- 2022-08-16 Sold (MLS) $20,000 ARMLS
- 2022-08-14 Pending — ARMLS
- 2022-08-03 Price Changed $25,000 ARMLS
- 2022-06-21 Relisted — ARMLS
- 2022-03-14 Pending — ARMLS
- 2022-03-06 Listed $30,000 ARMLS
Property tax history
+7.9%/yrLatest (2025): $307 · +5.3% YoY. Source: county tax records.
Cash-flow waterfall
monthlySold comps — $/sqft
last 12 mo · ≤1 miLoading sold comps…