25533 Flora Bella Ln · Elgin, TX
Flood risk 1/10 · Minimal
- FEMA flood zone
- X (unshaded)
- Chance of flooding over 30 yrs
- 0.0%
- Est. flood insurance / yr
- $507 – $1,088
Fire risk 3/10 · Minor
- Est. fire insurance / yr
- $1,222 – $2,270
Heat risk 8/10 · Major
- Hot days now (above 109°F)
- 7 days/yr
- Hot days in 30 yrs
- 22 days/yr
Wind risk 8/10 · Major
- Chance of severe wind over 30 yrs
- 80.0%
Air-quality risk 1/10 · Minimal
- Unhealthy air days now
- 0 days/yr
- Unhealthy air days in 30 yrs
- 0 days/yr
Risk factors via First Street. Map © Google.
Why this score? — see what drove the D- grade
The composite is a weighted blend of 9 inputs, each scored 0–100. Each bar is that input's sub-score; the figure is the points it added to the 100-point composite (weight × sub-score).
- Appreciation +10.0/10.0
- ARV discount +7.8/15.0
- Cash flow +6.3/30.0
- Livability +3.7/5.0
- Rent growth +3.3/5.0
- Condition / age +2.5/5.0
- Schools +2.0/10.0
- 1% rule +1.9/10.0
- DSCR +0.6/10.0
$309,900
🖨 Deal sheet (PDF) 📄 Offer letter ✓ Due diligence
Listing remarks MLS
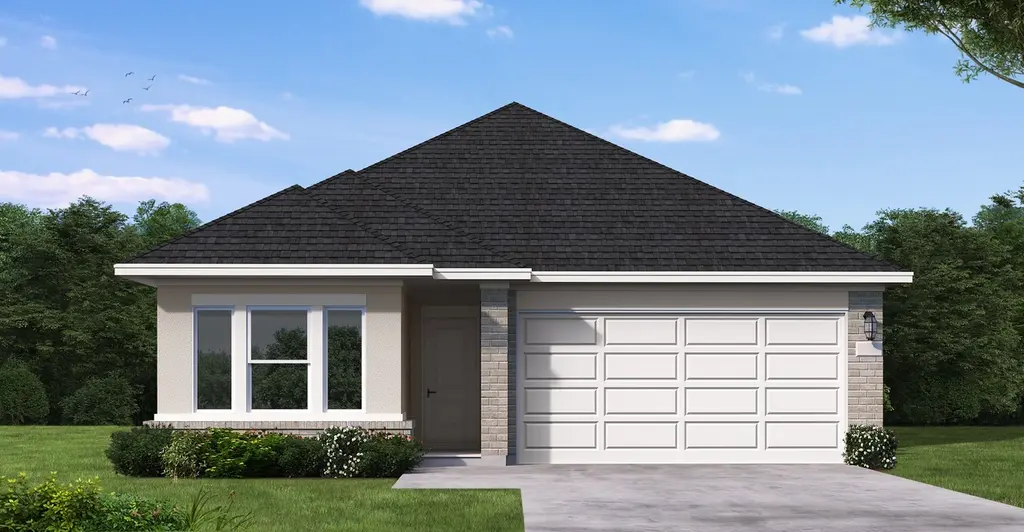
New Dream Finders Home! Experience the perfect upgrade in the Cooke floorplan by Dream Finders Homes, a standout residence in the premier Briarwood community. This expansive 4-bedroom, 2-bathroom home is designed for those who need room to grow without sacrificing style. The heart of the home opens to a bright, airy living space that leads directly to a private covered patio—your new favorite spot for morning coffee or weekend BBQs. The primary suite is a true homeowner’s retreat, boasting impressive square footage and a massive walk-in closet with storage to spare. Combining luxury with peace of mind, this home is 3.2 Energy Star certified, offering industry-leading energy efficiency and year-round comfort. Don’t miss your chance to own this blend of space, sophistication, and sustainability—schedule your showing today!
Key facts
- 5,401 sq ft lot
- 2 garage spots
- Community pool
Tags
Neighborhood map
What this means for you Summary
Snapshot
- This is a 4-bed/2.0-bath single-family listed at $310k.
Deal economics
- At list price, monthly cash flow is $-557 ($-7k/yr) — negative.
- To cash-flow at today's rent, offer at most $229k (26.0% below list).
- To meet the 1% rule (rent ≥ 1% of price), the offer needs to be $213k (31.3% below list).
- Recommended offer: $213k (31.3% below list) — sets the bar for 1% rule.
Location & tenants
- Location reads 74/100 on livability (#167 in TX, #4,404 nationally) — a middle-class / working-renter tenant base. Strengths: cost of living A+, housing A+, health & safety A+; Watch: amenities F, commute F.
- Elgin ISD (rural): math 17% / reading 26% proficiency, ranked #741 of 826 in TX (top 90%) — low school quality limits family demand, transient renter base, plan for 1-2y turnover; 67% free/reduced lunch — lower-income household profile, screen leases tightly.
- Zoned schools: Neidig El (math 32% / reading 32%, grade F, #2,268 of 4,322 statewide, top 55%, 599 students, 79% FRL); Elgin Middle (math 22% / reading 24%, grade F, #1,327 of 1,662 statewide, top 81%, 780 students, 82% FRL); Elgin H S (math 12% / reading 37%, grade F, #1,264 of 1,632 statewide, top 82%, 1,672 students, 74% FRL).
- Market conditions: Rents rising (+3.1%/yr); 814 active listings in the ZIP; 40 comparable units currently listed for rent nearby; rentals at typical pace (median 19d on market — plan ~3-4 weeks tenant-placement turnaround); solid renter incomes; 17,121 units permitted in Travis County in 2024 (11,963 in 5+ unit buildings).
Forward outlook
- In year one you build about $33k of equity ($2k loan paydown + $31k appreciation (10.0% local appreciation)).
- Travis County population projected at +60% by 2050 — long-run rental-demand tailwind backs the buy-and-hold thesis.
- By year 2, paydown + projected appreciation supports a ~$53k cash-out refi (75% LTV) — recoverable capital for the next deal without selling this one.
Negotiation context
- It's been on market 131 days — a 12% lower offer ($273k) is reasonable based on typical stale-listing flexibility.
Risks & watch-outs
- Climate carrying-cost: severe wind risk, 80% chance of damaging wind over 30y; extreme-heat days projected 7→22/yr by 2055 (HVAC capex compounding) — expect insurance premiums to compound above CPI over the hold.
Questions for the listing agent
- What do current leases actually rent for vs. the listed asking? Can we see a recent rent roll and the last 12 months of T-12 income?
- It's been on market 131 days. Have you received any prior offers? Is the seller open to a 31% concession, seller financing, or rate buy-down credit?
- What does the HOA fee cover, when was the last increase, and are there any pending special assessments or reserve-fund shortfalls?
- Why hasn't it sold? Are there any deal-killer items the seller is aware of (foundation, flood, title, zoning, code violations)?
- Is there a deadline driving the sale (1031 exchange, divorce, estate, relocation)? That informs how much negotiation room exists.
- Schools are F-rated, which usually means shorter tenancies and higher turnover. Who's the typical renter profile here, and what's been the actual vacancy rate?
- The area grade is low — what's the realistic commute time and amenity access for the typical tenant pool here? Any planned neighborhood developments (good or bad) we should know about?
- What's the average days-on-market for RENTAL listings here right now (not sales)? A rising rental-DOM trend means longer vacancies and softer asking-rent achievability than the comps imply.
- What's the recent tenant-quality profile in this submarket — average credit score on applications, eviction rate, late-payment / NSF rate, and stable-employment percentage? A property-management company in the area should have these aggregated.
- How much new for-sale + rental construction is in the pipeline within 1–3 miles? Heavy new supply typically softens prices + rents 12–24 months out; constrained supply supports both.
Investment metrics
- 1% rule
- 0.69% ✗
- Cap rate
- 4.14%
- Cash-on-cash
- -7.70%
- DSCR
- 0.66
- GRM
- 12.1
CMA / ARV
- ARV (median comp)
- $311,769
- List price
- $309,900
- Delta
- -0.60%
- Verdict
- FAIR
- Comps
- 20 within 1.0 mi
Show comp detail 12 sales within ~0.75 mi
| Address | Dist | Beds/Ba | Sqft | Sold | Price | $/sf | Match |
|---|---|---|---|---|---|---|---|
| 13701 Scarlett Song Dr | 0.13mi | 3/2.0 (-1) | 1,721 (+2%) | 1mo | $299,999 | $174 | 85 |
| 25641 Flora Bella Ln | 0.19mi | 3/2.0 (-1) | 1,680 (-1%) | 2mo | $299,999 | $179 | 84 |
| 25632 Wheat Seed Ln | 0.26mi | 3/2.0 (-1) | 1,680 (-1%) | 1mo | $299,999 | $179 | 81 |
| 13817 Tucker Hedge Pass | 0.24mi | 3/2.0 (-1) | 1,732 (+2%) | 3mo | $326,700 | $189 | 78 |
| 13601 Hamilton Hart Dr | 0.20mi | 3/2.0 (-1) | 1,840 (+9%) | 1mo | $329,890 | $179 | 71 |
| 18309 Rock Sage Cv | 0.51mi | 4/2.0 | 1,766 (+4%) | 2mo | $279,900 | $158 | 68 |
| 13605 Barn Chime St | 0.48mi | 3/2.0 (-1) | 1,610 (-5%) | 2mo | $289,990 | $180 | 63 |
| 13500 Barn Chime St | 0.59mi | 3/2.0 (-1) | 1,650 (-3%) | 3mo | $274,990 | $167 | 61 |
| 13512 Muny Pkwy | 0.60mi | 3/2.0 (-1) | 1,650 (-3%) | 3mo | $289,990 | $176 | 60 |
| 13420 Barn Chime St | 0.65mi | 3/2.0 (-1) | 1,650 (-3%) | 3mo | $284,990 | $173 | 58 |
| 101 Bandera Woods Blvd | 0.41mi | 3/2.0 (-1) | 1,499 (-12%) | 1mo | $254,000 | $169 | 56 |
| 13708 Sierra Wind Ln | 0.50mi | 3/2.5 (-1) | 1,833 (+8%) | 1mo | $254,999 | $139 | 55 |
Match score weights: distance 35% · size 25% · config 20% · recency 20%. Top-matched comps best support the ARV.
Projected returns pro-forma
10.0% appreciation · 3.12% rent growth · sell at horizon
- IRR
- 18.9%
- Equity multiple
- 2.54×
- Total profit
- $133,666
- Equity at exit
- $279,182
- IRR
- 17.5%
- Equity multiple
- 5.87×
- Total profit
- $422,217
- Equity at exit
- $602,068
Cash invested: $86,772 (down + closing). Projections, not guarantees.
Landlord ↔ Tenant lean methodology
- Overall (STATE)
- 87 Strongly Landlord-Friendly
- State Texas
- 87 Strongly Landlord-Friendly · R+5
- County
- — inherits STATE
- City
- — inherits STATE
ZIP-level market 78621
- Home prices YoY
- 7.6%
- Rents YoY
- 3.1%
- Active inventory
- 814
- Price-to-rent
- 12.1×
Monthly cashflow live
- Estimated rent
- $2,128 high interval (Pro) →
- Mortgage (P&I)
- −$1,625
- Tax est. 1.5%
- −$387 /mo · $4,648/yr
- Insurance
- −$129
- HOA
- −$96
- Vacancy / Maint / Mgmt
- −$447
- Net cashflow
- $-557
Break-even live
Sensitivity live
| Price | -10% $-343 | -5% $-450 | +0% $-557 | +5% $-664 | +10% $-771 |
|---|---|---|---|---|---|
| Rent | -10% $-725 | -5% $-641 | +0% $-557 | +5% $-473 | +10% $-389 |
| Rate | -1.0pp $-401 | -0.5pp $-478 | base $-557 | +0.5pp $-637 | +1.0pp $-719 |
UW: 25.0% down · 7.5% · 30yr · 1.5% tax · 5.0% vac · 8.0% maint · 8.0% mgmt
Financing live
Cash to close
- Down payment
- $77,475
- Closing costs
- $9,297
- Reserves months
- —
- Total cash needed
- —
Loan-product check · same deal, 3 products live
Conventional
25% down · 7.5% · 30yr
- Down + closing
- —
- Monthly P&I
- —
- Monthly cashflow
- —
- DSCR
- —
- Eligible?
- —
Personal DTI + credit; lowest rate.
DSCR
20% down · 8.5% · 30yr
- Down + closing
- —
- Monthly P&I
- —
- Monthly cashflow
- —
- DSCR
- —
- Eligible?
- —
No personal income docs; deal must DSCR.
Hard money
10% down · 12.0% · 12mo
- Down + closing
- —
- Monthly P&I
- —
- Monthly cashflow
- —
- DSCR
- —
- Eligible?
- —
Short-term bridge; refi at stabilization.
Rent comps 40 comps
| Address | Beds | Baths | Sqft | Rent | $/sqft | DOM | Units | Dist |
|---|---|---|---|---|---|---|---|---|
| 18436 Weatherby Ln Elgin, TX | 4.0 | 2.5 | 2095 | $2,000 | $0.95 | 6d | 1 | 0.34mi |
| 101 Bandara Woods Blvd Elgin, TX | 3.0 | 2.0 | 1499 | $1,769 | $1.18 | 17d | 1 | 0.40mi |
| 401 Bandara Woods Blvd Elgin, TX | 3.0 | 2.0 | 1665 | $1,875 | $1.13 | 46d | 1 | 0.57mi |
| 13501 Sierra Wind Ln Elgin, TX | 4.0 | 2.5 | 2066 | $2,500 | $1.21 | 22d | 1 | 0.66mi |
| 13817 County Line Rd Elgin, TX | 1.0–3.0 | 1.0–2.0 | 937 | $1,890 | $2.02 | 0d | 6 | 0.71mi |
| 18505 Quiet Range Dr Unit 18505 Elgin, TX | 4.0 | 2.0 | 1794 | $1,785 | $0.99 | 6d | 1 | 0.73mi |
| 18505 Quiet Range Dr Elgin, TX | 4.0 | 2.0 | 1794 | $1,950 | $1.09 | 26d | 1 | 0.73mi |
| 18525 Quiet Range Dr Elgin, TX | 4.0 | 2.0 | 1794 | $1,725 | $0.96 | 20d | 1 | 0.75mi |
| 18721 Quiet Range Dr Elgin, TX | 3.0–5.0 | 2.0–3.5 | 1773 | $2,452 | $1.38 | 0d | 1 | 0.76mi |
| 722 Lavaca Loop Elgin, TX | 4.0 | 2.5 | 2075 | $1,895 | $0.91 | 20d | 1 | 0.78mi |
| 19405 Bear Grass Dr Elgin, TX | 3.0 | 2.0 | 1495 | $1,760 | $1.18 | 46d | 1 | 0.80mi |
| 14101 Prospector Way Unit 14101 Elgin, TX | 4.0 | 2.5 | 2198 | $2,099 | $0.95 | 26d | 1 | 0.82mi |
| 14101 Prospector Way Elgin, TX | 4.0 | 2.5 | 2198 | $2,099 | $0.95 | 46d | 1 | 0.82mi |
| 18500 Allen Welch Dr Elgin, TX | 3.0 | 2.0 | 1525 | $1,875 | $1.23 | 0d | 1 | 0.84mi |
| 18612 Allen Welch Dr Elgin, TX | 4.0 | 2.0 | 1794 | $1,935 | $1.08 | 0d | 1 | 0.85mi |
| 14300 Boomtown Way Elgin, TX | 4.0 | 2.0 | 1794 | $2,050 | $1.14 | 26d | 1 | 0.90mi |
| 14141 Prospector Way Elgin, TX | 3.0 | 2.0 | 1520 | $1,650 | $1.09 | 46d | 1 | 0.90mi |
| 18300 Speculator Ln Elgin, TX | 4.0 | 2.0 | 1794 | $1,995 | $1.11 | 26d | 1 | 0.96mi |
| 18224 Speculator Ln Elgin, TX | 3.0 | 2.5 | 1599 | $1,700 | $1.06 | 46d | 1 | 0.96mi |
| 14421 Prairie Sod Ln Elgin, TX | 3.0 | 2.0 | 1525 | $1,650 | $1.08 | 4d | 1 | 0.98mi |
| 14129 Tordillo Dr Unit NA Elgin, TX | 4.0 | 2.5 | 1874 | $2,495 | $1.33 | 0d | 1 | 0.99mi |
| 14129 Tordillo Dr Elgin, TX | 4.0 | 2.5 | 1874 | $2,675 | $1.43 | 26d | 1 | 0.99mi |
| 107 Tillage Rd Elgin, TX | 3.0 | 2.0 | 1548 | $1,765 | $1.14 | 0d | 1 | 1.04mi |
| 14508 Wahlbergs Way Elgin, TX | 3.0 | 2.0 | 1076 | $2,045 | $1.90 | 13d | 1 | 1.05mi |
| 18200 Papuan Cv Elgin, TX | 3.0 | 2.0 | 1402 | $1,900 | $1.36 | 5d | 1 | 1.08mi |
| 234 Heritage Mill Trl Elgin, TX | 3.0 | 2.0 | 1530 | $1,800 | $1.18 | 0d | 1 | 1.13mi |
| 13804 Knights Branch Dr Elgin, TX | 3.0 | 2.5 | 1427 | $1,900 | $1.33 | 6d | 1 | 1.14mi |
| 13725 Knights Branch Dr Elgin, TX | 4.0 | 2.5 | 1800 | $2,100 | $1.17 | 26d | 1 | 1.17mi |
| 13121 Blackeyed Susan Trl Elgin, TX | 4.0 | 2.0 | 1586 | $1,800 | $1.13 | 20d | 1 | 1.18mi |
| 14521 Gurneys Eagle Dr Elgin, TX | 3.0 | 2.0 | 1878 | $1,895 | $1.01 | 3d | 1 | 1.19mi |
| 18316 Stellers Sea St Elgin, TX | 3.0 | 2.0 | 1076 | $2,045 | $1.90 | 21d | 1 | 1.19mi |
| 419 Gettysburg Loop Elgin, TX | 3.0 | 2.0 | 1565 | $1,850 | $1.18 | 14d | 1 | 1.20mi |
| 13604 Menard Way Elgin, TX | 3.0 | 2.0 | 1474 | $1,875 | $1.27 | 26d | 1 | 1.22mi |
| 13520 Knights Branch Dr Elgin, TX | 3.0 | 2.5 | 1600 | $1,850 | $1.16 | 4d | 1 | 1.26mi |
| 13501 Mussel Run Elgin, TX | 4.0 | 2.0 | 1667 | $1,800 | $1.08 | 18d | 1 | 1.34mi |
| 116 Honeybee Ln Elgin, TX | 3.0 | 2.5 | 1782 | $2,000 | $1.12 | 6d | 1 | 1.34mi |
| 13305 Banquete St Elgin, TX | 4.0 | 2.0 | 1707 | $1,995 | $1.17 | 46d | 1 | 1.37mi |
| 13124 Maidenhair Trl Elgin, TX | 4.0 | 2.0 | 1448 | $1,775 | $1.23 | 18d | 1 | 1.39mi |
| 13124 Maidenhair Trl Elgin, TX | 4.0 | 2.0 | 1448 | $1,775 | $1.23 | 26d | 1 | 1.39mi |
| 242 Barley Ln Elgin, TX | 3.0 | 2.5 | 1782 | $2,150 | $1.21 | 0d | 1 | 1.42mi |
HOA detail
- Monthly dues
- $96 · $1,152/yr
Listing history 19 events
-
2026-06-21days on market $309,900 Active 131 DOM
-
2026-06-18price $309,900 Active 128 DOM
-
2026-06-18days on market $314,900 Active 128 DOM
-
2026-06-17days on market $314,900 Active 127 DOM
-
2026-06-16days on market $314,900 Active 126 DOM
-
2026-06-15days on market $314,900 Active 125 DOM
-
2026-06-13days on market $314,900 Active 123 DOM
-
2026-06-10price $314,900 Active 119 DOM
-
2026-06-09days on market $320,590 Active 119 DOM
-
2026-06-08days on market $320,590 Active 118 DOM
-
2026-06-07days on market $320,590 Active 117 DOM
-
2026-06-04days on market $320,590 Active 114 DOM
-
2026-06-03days on market $320,590 Active 113 DOM
-
2026-06-02days on market $320,590 Active 112 DOM
-
2026-06-01days on market $320,590 Active 111 DOM
-
2026-05-31days on market $320,590 Active 110 DOM
-
2026-05-18price $320,590 856-char remark
Show marketing remark (856 chars)
New Dream Finders Home! Experience the perfect upgrade in the Cooke floorplan by Dream Finders Homes, a standout residence in the premier Briarwood community. This expansive 4-bedroom, 2-bathroom home is designed for those who need room to grow without sacrificing style. The heart of the home opens to a bright, airy living space that leads directly to a private covered patio—your new favorite spot for morning coffee or weekend BBQs. The primary suite is a true homeowner’s retreat, boasting impressive square footage and a massive walk-in closet with storage to spare. Combining luxury with peace of mind, this home is 3.2 Energy Star certified, offering industry-leading energy efficiency and year-round comfort. Don’t miss your chance to own this blend of space, sophistication, and sustainability—schedule your showing today!
-
2026-03-01price $318,590 856-char remark
Show marketing remark (856 chars)
New Dream Finders Home! Experience the perfect upgrade in the Cooke floorplan by Dream Finders Homes, a standout residence in the premier Briarwood community. This expansive 4-bedroom, 2-bathroom home is designed for those who need room to grow without sacrificing style. The heart of the home opens to a bright, airy living space that leads directly to a private covered patio—your new favorite spot for morning coffee or weekend BBQs. The primary suite is a true homeowner’s retreat, boasting impressive square footage and a massive walk-in closet with storage to spare. Combining luxury with peace of mind, this home is 3.2 Energy Star certified, offering industry-leading energy efficiency and year-round comfort. Don’t miss your chance to own this blend of space, sophistication, and sustainability—schedule your showing today!
-
2026-02-10$315,590 Active 856-char remark
Show marketing remark (856 chars)
New Dream Finders Home! Experience the perfect upgrade in the Cooke floorplan by Dream Finders Homes, a standout residence in the premier Briarwood community. This expansive 4-bedroom, 2-bathroom home is designed for those who need room to grow without sacrificing style. The heart of the home opens to a bright, airy living space that leads directly to a private covered patio—your new favorite spot for morning coffee or weekend BBQs. The primary suite is a true homeowner’s retreat, boasting impressive square footage and a massive walk-in closet with storage to spare. Combining luxury with peace of mind, this home is 3.2 Energy Star certified, offering industry-leading energy efficiency and year-round comfort. Don’t miss your chance to own this blend of space, sophistication, and sustainability—schedule your showing today!
ⓘ Source: listings_history table (triggers on properties + properties_extension) + one-shot
backfill from property_details.listing_events for pre-trigger history.
Climate risk First Street
- Flood 1/10 Low FEMA zone X (unshaded) · 0% chance over 30 yrs
- Wildfire 3/10 Moderate
- Heat 8/10 Severe 7 d/yr ≥109°F today · 22 d/yr by 30 yrs out
- Wind 8/10 Severe 80% chance of damaging wind over 30 yrs
- Air quality 1/10 Low 0 unhealthy d/yr today · 0 by 30 yrs out
Nearby sold comps map
Loading sold comps map…
Walkable amenities ~0.75 mi
Loading nearby amenities…
Taxation est. · year 1
- Rental income
- $25,532
- − Mortgage interest
- −$17,359
- − Property taxes
- −$4,648
- − Insurance
- −$1,550
- − Repairs & maintenance
- −$2,043
- − Management
- −$2,043
- − HOA
- −$1,152
- − Depreciation
- −$9,015
- Taxable loss
- −$12,278
- Est. tax savings @ 24.0%
- +$2,947
- After-tax cash flow
- $-3,735/yr
For passive investors: Depreciation is non-cash, so a rental often shows a tax loss while cash-flowing — sheltering income. Rental losses are passive: they offset passive income freely, and up to $25,000/yr can offset ordinary (W-2) income if you actively participate and your MAGI is under $100k (phasing out to $0 by $150k); unused losses carry forward. On sale, claimed depreciation is recaptured at up to 25%, and gains may owe capital-gains tax (a 1031 exchange can defer both). Figures are a year-1 estimate at your 24.0% rate — not tax advice; consult a CPA.
Schools (NCES district)
- District
- Elgin ISD
- NCES district ID
- 4818360
- Math proficiency
- 17% ▼ -9.00%
- Reading proficiency
- 26% ▼ -5.00%
- Median HH income
- $55,176
- Composite
- 19.62/100
- National rank
- #8749
- State rank
- #741 of 826 in TX
Livability — Elgin
- Score
- 74/100
- State rank
- #167
- US rank
- #4404
Category grades
Schools grade is shown separately in the Schools card above.
Census & demographics
- Census place
- Elgin, TX
- County
- Bastrop County · 68,601 people
- City population
- 27,860
- Metro
- Austin-Round Rock-Georgetown, TX
- Population (ZIP)
- 30,411
- Household income
- $98,534
- Rent vs Own
- Severe rent burden
- 235.0
Population outlook (Travis County) Hauer SSP2
- Today (2025)
- 1,545,133 people
- By 2030
- 1,729,269 · +11.9%
- By 2040
- 2,097,596 · +35.8%
- By 2050
- 2,463,890 · +59.5%
- By 2075
- 3,249,374 · +110.3%
- By 2100
- 3,801,868 · +146.1%
Race, ethnicity, and origin ACS 2023
- Neighborhood character
- Diverse neighborhood (Simpson 0.64)
- Race & ethnicity
- Hispanic / Latino 46% White 38% Two or more races 19% Black 11% Native American 1%
- Hispanic origin (detail)
- Mexican 38%
- Common ancestry
- Slovak 2% Italian 2% Romanian 1%
- Foreign-born
- 17% · Canada, Vietnam
- Languages at home
- 63% English-only · Spanish 36%
Political lean MEDSL · Travis
- 2024 margin
- Solid D (+39.3) · D 68.8% · R 29.4% · Other 1.8%
- 2008→2024 swing
- +9.9pp toward D · 2008: 29.4pp · 2024: 39.3pp
- All cycles
- 2024: D+39.3 2020: D+45.0 2016: D+38.9 2012: D+23.9 2008: D+29.4
Not yet ingested
- Civics
- —
Market trends
- HPI YoY
- ▲ 29.47%
- Current HPI
- 416.87
- Rent YoY
- ▲ 3.12%
- Metro
- Austin-Round Rock-Georgetown, TX
- State GDP YoY
- ▲ 3.95%
- F500 in state
- 110
Industry mix (Fortune 500 HQ in TX)
| Industry | F500 HQs | Revenue |
|---|---|---|
| Energy | 16 | $1,198B |
|
||
| Technology | 5 | $198B |
|
||
| Engineering / Construction | 4 | $72B |
|
||
| Energy Services | 3 | $60B |
|
||
| Utilities | 3 | $41B |
|
||
| Healthcare | 2 | $330B |
|
||
Price history
+1.6% since first listed3 events — show timeline
- 2026-05-18 Price Changed $320,590 Unlock MLS
- 2026-03-01 Price Changed $318,590 Unlock MLS
- 2026-02-10 Listed $315,590 Unlock MLS
Cash-flow waterfall
monthlySold comps — $/sqft
last 12 mo · ≤1 miLoading sold comps…