17705 S Western Unit 118 Ave · Torrance, CA
Flood risk 1/10 · Minimal
- FEMA flood zone
- X (unshaded)
- Chance of flooding over 30 yrs
- 0.0%
- Est. flood insurance / yr
- $507 – $1,088
Fire risk 1/10 · Minimal
- Est. fire insurance / yr
- $659 – $1,223
Heat risk 4/10 · Minor
- Hot days now (above 86°F)
- 4 days/yr
- Hot days in 30 yrs
- 12 days/yr
Wind risk 1/10 · Minimal
- Chance of severe wind over 30 yrs
- —
Air-quality risk 5/10 · Moderate
- Unhealthy air days now
- 7 days/yr
- Unhealthy air days in 30 yrs
- 7 days/yr
Risk factors via First Street. Map © Google.
Why this score? — see what drove the B- grade
The composite is a weighted blend of 9 inputs, each scored 0–100. Each bar is that input's sub-score; the figure is the points it added to the 100-point composite (weight × sub-score).
- Cash flow +30.0/30.0
- 1% rule +10.0/10.0
- DSCR +10.0/10.0
- Schools +5.9/10.0
- Livability +3.8/5.0
- ARV discount +3.3/15.0
- Rent growth +2.5/5.0
- Condition / age +2.5/5.0
- Appreciation +0.0/10.0
$139,900
🖨 Deal sheet (PDF) 📄 Offer letter ✓ Due diligence
Listing remarks MLS
No HOA ONLY land rent
Key facts
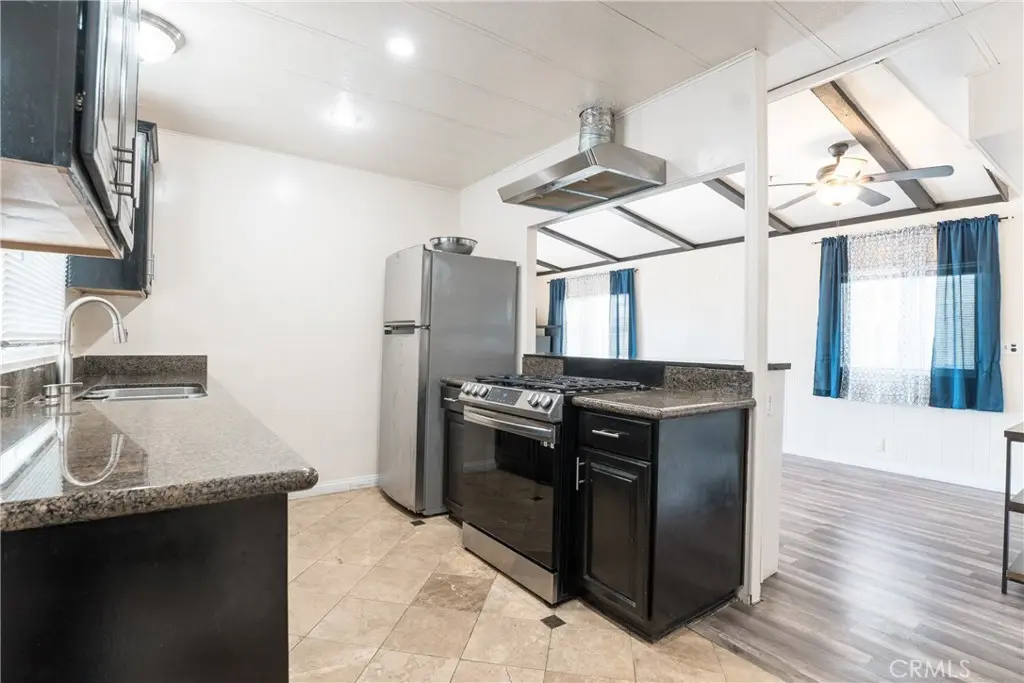
- Dual ac heater unit
- Newer outside paint
- Great outdoor area
Tags
Neighborhood map
What this means for you Summary
Snapshot
- This is a 2-bed/2.0-bath single-family listed at $140k.
Deal economics
- At list price, monthly cash flow is $1k ($17k/yr) — positive.
- The deal already cash-flows at list — no discount required.
- Meets the 1% rule at list price ($3k rent vs $140k).
- Recommended offer: $123k (12.0% below list) — sets the bar for market timing.
- Cap rate 18.4% vs local median 2.1% in Torrance — top-decile yield for the area; either an underpriced asset or a hidden risk that comps aren't pricing in. Stress-test before assuming the spread holds.
Location & tenants
- Location reads 76/100 on livability (#95 in CA, #3,501 nationally) — a middle-class / working-renter tenant base. Strengths: schools A+, amenities A+, commute A+; Watch: health & safety C-, crime D+, cost of living F.
- Torrance Unified (urban): math 62% / reading 67% proficiency, ranked #150 of 1,400 in CA (top 11%) — acceptable for families but not a draw, mixed tenant base, ~2y average lease; only 20% free/reduced lunch — higher-income household profile.
- Market conditions: 27 active listings in the ZIP; 38 comparable units currently listed for rent nearby; rentals at typical pace (median 26d on market — plan ~3-4 weeks tenant-placement turnaround); 42% of comp listings sitting > 30 days — soft ceiling on asking rent; 19,697 units permitted in Los Angeles County in 2024 (9,426 in 5+ unit buildings).
Forward outlook
- Local home prices are declining (-3.0%/yr); year-one equity from $967 of loan paydown is wiped out by about $4k of value loss. Plan a longer hold.
- Los Angeles County population projected at +9% by 2050 — modest demand growth; plan on rents tracking national, not racing it.
- At projected returns (-3.0% appreciation + 3.0% rent growth), your $39k cash investment doubles in ~3 years — after that, you're playing with house money.
Negotiation context
- It's been on market 159 days — a 12% lower offer ($123k) is reasonable based on typical stale-listing flexibility.
- 2 sale attempts; this cycle's ask has dropped $40k (22%) from the opening price — seller is motivated, your offer sets the floor, not the list.
Questions for the listing agent
- It's been on market 159 days. Have you received any prior offers? Is the seller open to a 12% concession, seller financing, or rate buy-down credit?
- Built in 1977 — when were the roof, HVAC, electrical panel, plumbing, and water heater last replaced?
- Why hasn't it sold? Are there any deal-killer items the seller is aware of (foundation, flood, title, zoning, code violations)?
- Is there a deadline driving the sale (1031 exchange, divorce, estate, relocation)? That informs how much negotiation room exists.
- Schools are A-rated — typically a magnet for longer-tenancy family renters. What's the average tenant stay here, and is there a school-zone premium baked into asking?
- Crime grade is D in this area — have there been break-ins, vandalism, or insurance claims at this property in the last 3 years? What carrier currently insures it and at what premium?
- What's the average days-on-market for RENTAL listings here right now (not sales)? A rising rental-DOM trend means longer vacancies and softer asking-rent achievability than the comps imply.
- What's the recent tenant-quality profile in this submarket — average credit score on applications, eviction rate, late-payment / NSF rate, and stable-employment percentage? A property-management company in the area should have these aggregated.
- How much new for-sale + rental construction is in the pipeline within 1–3 miles? Heavy new supply typically softens prices + rents 12–24 months out; constrained supply supports both.
Investment metrics
- 1% rule
- 2.16% ✓
- Cap rate
- 18.45%
- Cash-on-cash
- 43.40%
- DSCR
- 2.93
- GRM
- 3.9
CMA / ARV
- ARV (median comp)
- $128,012
- List price
- $139,900
- Delta
- 9.29%
- Verdict
- FAIR
- Comps
- 15 within 1.0 mi
Show comp detail 12 sales within ~0.75 mi
| Address | Dist | Beds/Ba | Sqft | Sold | Price | $/sf | Match |
|---|---|---|---|---|---|---|---|
| 1537 W 180th | 0.43mi | 3/2.0 (+1) | 1,153 (+11%) | 3mo | $600,000 | $520 | 54 |
| 17019 S Harvard Blvd | 0.47mi | 3/1.0 (+1) | 999 (-4%) | 13mo | $775,000 | $776 | 51 |
| 1825 West 182nd St | 0.28mi | 3/2.0 (+1) | 1,170 (+12%) | 16mo | $881,000 | $753 | 48 |
| 18311 S Harvard Blvd | 0.42mi | 3/1.5 (+1) | 1,187 (+14%) | 4mo | $820,000 | $691 | 46 |
| 1657 W 184th St | 0.42mi | 3/1.5 (+1) | 1,187 (+14%) | 7mo | $799,000 | $673 | 44 |
| 2306 W 177th St | 0.49mi | 3/1.5 (+1) | 1,151 (+11%) | 12mo | $920,000 | $799 | 43 |
| 17104 Van Ness Ave | 0.53mi | 3/2.0 (+1) | 1,148 (+10%) | 13mo | $960,000 | $836 | 42 |
| 2008 West 166th St | 0.72mi | 3/1.0 (+1) | 1,081 (+4%) | 11mo | $750,000 | $694 | 42 |
| 1619 W 183rd St | 0.43mi | 3/2.0 (+1) | 1,187 (+14%) | 12mo | $875,000 | $737 | 41 |
| 1636 W 182nd St | 0.37mi | 3/2.0 (+1) | 1,187 (+14%) | 16mo | $820,000 | $691 | 41 |
| 1486 W 186th St | 0.74mi | 2/1.0 | 1,132 (+9%) | 8mo | $800,000 | $707 | 40 |
| 18107 S Harvard Blvd | 0.31mi | 3/1.0 (+1) | 1,195 (+15%) | 19mo | $630,000 | $527 | 35 |
Match score weights: distance 35% · size 25% · config 20% · recency 20%. Top-matched comps best support the ARV.
Projected returns pro-forma
-3.0% appreciation · 3.0% rent growth · sell at horizon
- IRR
- 40.3%
- Equity multiple
- 2.73×
- Total profit
- $67,612
- Equity at exit
- $20,860
- IRR
- 46.6%
- Equity multiple
- 5.47×
- Total profit
- $175,254
- Equity at exit
- $12,096
Cash invested: $39,172 (down + closing). Projections, not guarantees.
Landlord ↔ Tenant lean methodology
- Overall (STATE)
- 18 Strongly Tenant-Friendly
- State California
- 18 Strongly Tenant-Friendly · D+13
- County
- — inherits STATE
- City
- — inherits STATE
ZIP-level market 90248
- Active inventory
- 27
- Price-to-rent
- 3.9×
Monthly cashflow live
- Estimated rent
- $3,017 high interval (Pro) →
- Mortgage (P&I)
- −$734
- Tax est. 1.5%
- −$175 /mo · $2,098/yr
- Insurance
- −$58
- HOA
- −$0
- Vacancy / Maint / Mgmt
- −$634
- Net cashflow
- $1,417
Break-even live
Sensitivity live
| Price | -10% $1,513 | -5% $1,465 | +0% $1,417 | +5% $1,368 | +10% $1,320 |
|---|---|---|---|---|---|
| Rent | -10% $1,178 | -5% $1,298 | +0% $1,417 | +5% $1,536 | +10% $1,655 |
| Rate | -1.0pp $1,487 | -0.5pp $1,452 | base $1,417 | +0.5pp $1,381 | +1.0pp $1,344 |
UW: 25.0% down · 7.5% · 30yr · 1.5% tax · 5.0% vac · 8.0% maint · 8.0% mgmt
Financing live
Cash to close
- Down payment
- $34,975
- Closing costs
- $4,197
- Reserves months
- —
- Total cash needed
- —
Loan-product check · same deal, 3 products live
Conventional
25% down · 7.5% · 30yr
- Down + closing
- —
- Monthly P&I
- —
- Monthly cashflow
- —
- DSCR
- —
- Eligible?
- —
Personal DTI + credit; lowest rate.
DSCR
20% down · 8.5% · 30yr
- Down + closing
- —
- Monthly P&I
- —
- Monthly cashflow
- —
- DSCR
- —
- Eligible?
- —
No personal income docs; deal must DSCR.
Hard money
10% down · 12.0% · 12mo
- Down + closing
- —
- Monthly P&I
- —
- Monthly cashflow
- —
- DSCR
- —
- Eligible?
- —
Short-term bridge; refi at stabilization.
Rent comps 38 comps
| Address | Beds | Baths | Sqft | Rent | $/sqft | DOM | Units | Dist |
|---|---|---|---|---|---|---|---|---|
| 18012 Manhattan Pl Torrance, CA | 3.0 | 2.0 | 1446 | $3,595 | $2.49 | 3d | 1 | 0.21mi |
| 17405 Van Ness Ave Torrance, CA | 2.0 | 2.0 | 850 | $2,775 | $3.26 | 16d | 1 | 0.44mi |
| 17313 Denker Ave Unit 4 Gardena, CA | 2.0 | 1.0 | 985 | $2,300 | $2.34 | 44d | 1 | 0.44mi |
| 17310 S Dalton Ave #3 Gardena, CA | 2.0 | 2.5 | 1400 | $3,500 | $2.50 | 25d | 1 | 0.50mi |
| 18405 Haas Ave Torrance, CA | 3.0 | 2.0 | 1240 | $3,500 | $2.82 | 44d | 1 | 0.56mi |
| 1443 W 179th St Unit 107 Gardena, CA | 2.0 | 1.0 | 800 | $2,450 | $3.06 | 25d | 1 | 0.61mi |
| 1443 W 179th St Apt 104 Gardena, CA | 2.0 | 2.0 | 850 | $2,500 | $2.94 | 44d | 1 | 0.61mi |
| 16507 Saint Andrews Pl Unit C Gardena, CA | 2.0 | 1.0 | 850 | $2,650 | $3.12 | 44d | 1 | 0.74mi |
| 1243 Electric St Gardena, CA | 2.0 | 2.0 | 866 | $2,850 | $3.29 | 8d | 1 | 0.88mi |
| 1616 W Gardena Blvd Gardena, CA | 2.0 | 1.0 | 882 | $2,800 | $3.17 | 4d | 1 | 0.88mi |
| 17229 Atkinson Ave Torrance, CA | 3.0 | 1.0 | 967 | $3,600 | $3.72 | 44d | 1 | 0.88mi |
| 2314 W 165th St Torrance, CA | 3.0 | 2.0 | 1304 | $4,000 | $3.07 | 18d | 1 | 0.90mi |
| 16326 Denker Ave Gardena, CA | 2.0 | 1.0 | 908 | $3,000 | $3.30 | 44d | 1 | 0.93mi |
| 16901 Crenshaw Blvd Unit 1 Torrance, CA | 2.0 | 1.0 | 800 | $2,500 | $3.12 | 25d | 1 | 1.03mi |
| 1328 W Gardena Blvd Apt 3 Gardena, CA | 2.0 | 2.0 | 1080 | $2,700 | $2.50 | 44d | 1 | 1.04mi |
| 17309 Elgar Ave Torrance, CA | 2.0 | 1.0 | 838 | $3,400 | $4.06 | 8d | 1 | 1.05mi |
| 17309 Elgar Ave Torrance, CA | 2.0 | 1.0 | 838 | $3,400 | $4.06 | 13d | 1 | 1.05mi |
| 1261 W 166th St Gardena, CA | 3.0 | 2.0 | 1280 | $3,000 | $2.34 | 44d | 1 | 1.07mi |
| 16713 Crenshaw Blvd Torrance, CA | 3.0 | 1.0 | 850 | $2,450 | $2.88 | 44d | 1 | 1.08mi |
| 1343 W 164th St Gardena, CA | 2.0 | 2.0 | 800 | $2,700 | $3.38 | 25d | 1 | 1.10mi |
| 17032 Falda Ave Torrance, CA | 3.0 | 2.0 | 1487 | $4,995 | $3.36 | 0d | 1 | 1.11mi |
| 17513 Glenburn Ave Torrance, CA | 2.0 | 2.0 | 800 | $3,195 | $3.99 | 44d | 1 | 1.13mi |
| 3313 Artesia Blvd Torrance, CA | 1.0 | 1.0 | 750 | $1,895 | $2.53 | 44d | 1 | 1.17mi |
| 15825 Denker Ave Unit A Gardena, CA | 2.0 | 1.0 | 900 | $2,750 | $3.06 | 44d | 1 | 1.22mi |
| 16935 S Vermont Ave Gardena, CA | 2.0 | 1.0 | 850 | $2,295 | $2.70 | 25d | 1 | 1.23mi |
| 16920 S Vermont Ave Unit D Gardena, CA | 2.0 | 1.5 | 1100 | $2,795 | $2.54 | 20d | 1 | 1.27mi |
| 16920 S Vermont Ave Gardena, CA | 2.0 | 1.5 | 1100 | $2,795 | $2.54 | 25d | 1 | 1.27mi |
| 1040 W 165th Pl Unit A Gardena, CA | 3.0 | 3.0 | 1500 | $4,500 | $3.00 | 0d | 1 | 1.27mi |
| 1040 W 165th Pl Unit 1 Gardena, CA | 3.0 | 3.0 | 1500 | $4,501 | $3.00 | 0d | 1 | 1.27mi |
| 2125 W 157th St Unit 10 Gardena, CA | 1.0 | 1.0 | 700 | $2,050 | $2.93 | 5d | 1 | 1.30mi |
| 860 W 165th Pl Apt 201 Gardena, CA | 2.0 | 2.0 | 925 | $2,395 | $2.59 | 44d | 1 | 1.36mi |
| 17302 Yukon Ave Torrance, CA | 2.0 | 2.0 | 990 | $2,782 | $2.81 | 25d | 2 | 1.38mi |
| 15702 Brighton Ave Unit 4 Gardena, CA | 2.0 | 1.0 | 750 | $2,500 | $3.33 | 20d | 1 | 1.43mi |
| 17035 Yukon Ave Torrance, CA | 1.0 | 1.0 | 720 | $2,195 | $3.05 | 44d | 1 | 1.46mi |
| 3619 W 172nd St Torrance, CA | 3.0 | 2.0 | 999 | $4,200 | $4.20 | 44d | 1 | 1.48mi |
| 16915 Yukon Ave Unit 6 Torrance, CA | 2.0 | 1.0 | 903 | $2,650 | $2.93 | 25d | 1 | 1.48mi |
| 16700 Yukon Ave #108 Torrance, CA | 2.0 | 2.0 | 859 | $3,200 | $3.73 | 44d | 1 | 1.49mi |
| 16724 Yukon Ave Torrance, CA | 1.0 | 1.0 | 705 | $2,595 | $3.68 | 25d | 1 | 1.49mi |
Listing history 21 events
-
2026-06-21days on market $139,900 Active 159 DOM
-
2026-06-18days on market $139,900 Active 156 DOM
-
2026-06-17days on market $139,900 Active 155 DOM
-
2026-06-16days on market $139,900 Active 154 DOM
-
2026-06-15days on market $139,900 Active 153 DOM
-
2026-06-13days on market $139,900 Active 151 DOM
-
2026-06-13days on market $139,900 Active 150 DOM
-
2026-06-09days on market $139,900 Active 147 DOM
-
2026-06-08days on market $139,900 Active 146 DOM
-
2026-06-07days on market $139,900 Active 145 DOM
-
2026-06-04days on market $139,900 Active 142 DOM
-
2026-06-03days on market $139,900 Active 141 DOM
-
2026-06-02days on market $139,900 Active 140 DOM
-
2026-06-01days on market $139,900 Active 139 DOM
-
2026-05-31pricedays on market $139,900 Active 138 DOM
-
2026-05-13price $170,000 21-char remark
Show marketing remark (21 chars)
No HOA ONLY land rent
-
2026-05-12$180,000 Active 21-char remark
Show marketing remark (21 chars)
No HOA ONLY land rent
-
2026-05-03price $149,900 1016-char remark
Show marketing remark (1016 chars)
Wow!!! Best priced mobile home in the park. Stunning move-in ready 2-bedroom 2-bathroom home with a large LIVING AND DINING AREA is now available. Enjoy the Well kept laminate wood flooring, fixtures, a spectacular roof, dual AC/Heater unit, newer outside paint, dual pane windows, and a great outdoor area for family and friends gathering. Both bathrooms have been tastefully upgraded with tile showers and a deluxe tile tub. The Stove, Fridge, Washer & Dryer will remain in the unit. The Main Bedroom has walk in closet and a adjoining full bath. Park is a great All Age Manufactured Home Community in the South Bay Region of LA County. Enjoy community amenities like a large pool, jacuzzi, Club House and Laundry facilities. There is a community Club House for parties, celebrations, and park events. Close to shopping, public transportation, and easy freeway access to the 110, 405, and 91 freeways. Space rent is 2150 per month. This Great Community is a few minutes away from Redondo and Manhattan Beach.
-
2026-03-26price $159,900 1016-char remark
Show marketing remark (1016 chars)
Wow!!! Best priced mobile home in the park. Stunning move-in ready 2-bedroom 2-bathroom home with a large LIVING AND DINING AREA is now available. Enjoy the Well kept laminate wood flooring, fixtures, a spectacular roof, dual AC/Heater unit, newer outside paint, dual pane windows, and a great outdoor area for family and friends gathering. Both bathrooms have been tastefully upgraded with tile showers and a deluxe tile tub. The Stove, Fridge, Washer & Dryer will remain in the unit. The Main Bedroom has walk in closet and a adjoining full bath. Park is a great All Age Manufactured Home Community in the South Bay Region of LA County. Enjoy community amenities like a large pool, jacuzzi, Club House and Laundry facilities. There is a community Club House for parties, celebrations, and park events. Close to shopping, public transportation, and easy freeway access to the 110, 405, and 91 freeways. Space rent is 2150 per month. This Great Community is a few minutes away from Redondo and Manhattan Beach.
-
2026-02-01historical
-
2026-01-13$164,900 Active 1016-char remark
Show marketing remark (1016 chars)
Wow!!! Best priced mobile home in the park. Stunning move-in ready 2-bedroom 2-bathroom home with a large LIVING AND DINING AREA is now available. Enjoy the Well kept laminate wood flooring, fixtures, a spectacular roof, dual AC/Heater unit, newer outside paint, dual pane windows, and a great outdoor area for family and friends gathering. Both bathrooms have been tastefully upgraded with tile showers and a deluxe tile tub. The Stove, Fridge, Washer & Dryer will remain in the unit. The Main Bedroom has walk in closet and a adjoining full bath. Park is a great All Age Manufactured Home Community in the South Bay Region of LA County. Enjoy community amenities like a large pool, jacuzzi, Club House and Laundry facilities. There is a community Club House for parties, celebrations, and park events. Close to shopping, public transportation, and easy freeway access to the 110, 405, and 91 freeways. Space rent is 2150 per month. This Great Community is a few minutes away from Redondo and Manhattan Beach.
ⓘ Source: listings_history table (triggers on properties + properties_extension) + one-shot
backfill from property_details.listing_events for pre-trigger history.
Climate risk First Street
- Flood 1/10 Low FEMA zone X (unshaded) · 0% chance over 30 yrs
- Wildfire 1/10 Low
- Heat 4/10 Moderate 4 d/yr ≥86°F today · 12 d/yr by 30 yrs out
- Wind 1/10 Low
- Air quality 5/10 Major 7 unhealthy d/yr today · 7 by 30 yrs out
Nearby sold comps map
Loading sold comps map…
Walkable amenities ~0.75 mi
Loading nearby amenities…
Taxation est. · year 1
- Rental income
- $36,207
- − Mortgage interest
- −$7,837
- − Property taxes
- −$2,098
- − Insurance
- −$700
- − Repairs & maintenance
- −$2,897
- − Management
- −$2,897
- − Depreciation
- −$4,070
- Taxable income
- $15,709
- Est. tax owed @ 24.0%
- −$3,770
- After-tax cash flow
- $13,231/yr
For passive investors: Depreciation is non-cash, so a rental often shows a tax loss while cash-flowing — sheltering income. Rental losses are passive: they offset passive income freely, and up to $25,000/yr can offset ordinary (W-2) income if you actively participate and your MAGI is under $100k (phasing out to $0 by $150k); unused losses carry forward. On sale, claimed depreciation is recaptured at up to 25%, and gains may owe capital-gains tax (a 1031 exchange can defer both). Figures are a year-1 estimate at your 24.0% rate — not tax advice; consult a CPA.
Schools (NCES district)
- District
- Torrance Unified
- NCES district ID
- 0639420
- Math proficiency
- 62% ▲ 2.00%
- Reading proficiency
- 67% ▬ 0.00%
- Median HH income
- $78,640
- Composite
- 58.96/100
- National rank
- #1969
- State rank
- #150 of 1400 in CA
Livability — Torrance
- Score
- 76/100
- State rank
- #95
- US rank
- #3501
Category grades
Schools grade is shown separately in the Schools card above.
Census & demographics
- Census place
- Torrance, CA
- City population
- 153,473
- Population (ZIP)
- 11,144
Population outlook (Los Angeles County) Hauer SSP2
- Today (2025)
- 10,940,515 people
- By 2030
- 11,256,481 · +2.9%
- By 2040
- 11,729,929 · +7.2%
- By 2050
- 11,948,407 · +9.2%
- By 2075
- 11,818,114 · +8.0%
- By 2100
- 10,842,928 · -0.9%
Race, ethnicity, and origin ACS 2023
- Neighborhood character
- Highly diverse neighborhood (Simpson 0.75)
- Race & ethnicity
- Asian 32% Hispanic / Latino 31% Black 21% Two or more races 12% White 7%
- Hispanic origin (detail)
- Mexican 20% Puerto Rican 2%
- Common ancestry
- British 1%
- Foreign-born
- 37% · Canada, South Korea, Vietnam
- Languages at home
- 53% English-only · Spanish 25% Other Asian/Pacific 10% Tagalog/Filipino 6%
Political lean MEDSL · Los Angeles
- 2024 margin
- Solid D (+32.9) · D 64.8% · R 31.9% · Other 3.3%
- 2008→2024 swing
- -7.4pp toward R · 2008: 40.4pp · 2024: 32.9pp
- All cycles
- 2024: D+32.9 2020: D+44.2 2016: D+48.0 2012: D+40.0 2008: D+40.4
Not yet ingested
- Civics
- —
Market trends
- HPI YoY
- ▼ -318.63%
- Current HPI
- 409.9768
- Rent YoY
- —
- Metro
- —
- State GDP YoY
- ▲ 3.21%
- F500 in state
- 116
Industry mix (Fortune 500 HQ in CA)
| Industry | F500 HQs | Revenue |
|---|---|---|
| Technology | 27 | $1,492B |
|
||
| Financial Services | 3 | $174B |
|
||
| Retail | 3 | $44B |
|
||
| Insurance | 3 | $26B |
|
||
| Media / Entertainment | 2 | $115B |
|
||
| Pharmaceuticals / Biotech | 2 | $62B |
|
||
Price history
+3.1% since first listed6 events — show timeline
- 2026-05-13 Price Changed $170,000 FSBO.com
- 2026-05-12 Listed $180,000 FSBO.com
- 2026-05-03 Price Changed $149,900 CRMLS
- 2026-03-26 Price Changed $159,900 CRMLS
- 2026-02-01 Coming Soon — CRMLS
- 2026-01-13 Listed $164,900 CRMLS
Cash-flow waterfall
monthlySold comps — $/sqft
last 12 mo · ≤1 miLoading sold comps…