2161 Peachtree Rd NE · Atlanta, GA
Flood risk 1/10 · Minimal
- FEMA flood zone
- X (unshaded)
- Chance of flooding over 30 yrs
- 0.0%
- Est. flood insurance / yr
- $507 – $1,088
Fire risk 1/10 · Minimal
- Est. fire insurance / yr
- $963 – $1,789
Heat risk 6/10 · Moderate
- Hot days now (above 104°F)
- 7 days/yr
- Hot days in 30 yrs
- 19 days/yr
Wind risk 4/10 · Minor
- Chance of severe wind over 30 yrs
- 21.0%
Air-quality risk 4/10 · Minor
- Unhealthy air days now
- 5 days/yr
- Unhealthy air days in 30 yrs
- 7 days/yr
Risk factors via First Street. Map © Google.
Why this score? — see what drove the C+ grade
The composite is a weighted blend of 9 inputs, each scored 0–100. Each bar is that input's sub-score; the figure is the points it added to the 100-point composite (weight × sub-score).
- Cash flow +23.0/30.0
- ARV discount +13.2/15.0
- DSCR +7.4/10.0
- 1% rule +6.0/10.0
- Livability +4.2/5.0
- Rent growth +3.3/5.0
- Schools +2.7/10.0
- Condition / age +2.5/5.0
- Appreciation +0.0/10.0
$229,000
🖨 Deal sheet (PDF) 📄 Offer letter ✓ Due diligence
Listing remarks MLS
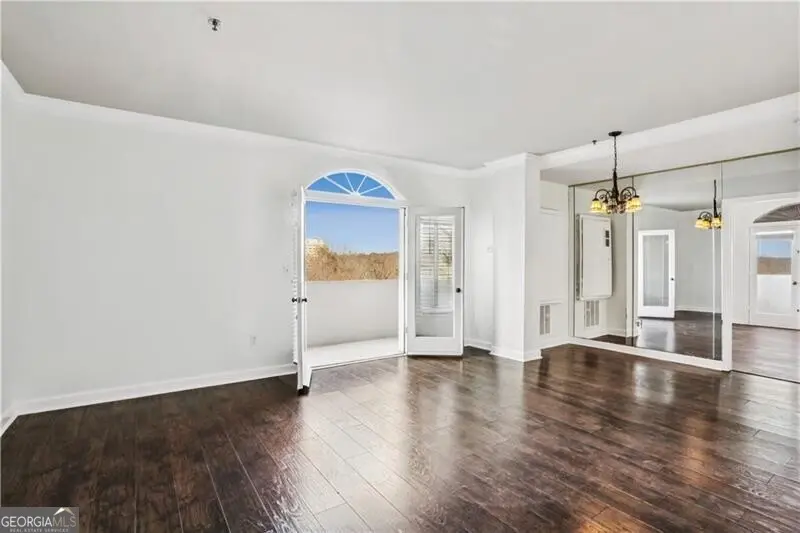
Retro, groovy and cool - all in the PERFECT location. Walk to shops and restaurants or watch the Peachtree Road Race from one of your two balconies! This condo has it all. Generous sized ensuite bedrooms with walk in closets. This corner unit boasts great city views and lots of light. Open concept. Perfect for first time home buyer, downsizer or investor. The building and garage are secured with fob controlled access. No short term rentals but long term (6months+) are allowed.
Key facts
- Garage
- Built 1986
- Listed 42 days
Property features AI
Finance
- Other: Lot approximately 0.03 acre (about 1,306.8 sq ft); Near public transport, walkable to schools and shopping
- HOA & community: Has association; Association fees include maintenance of structure, maintenance of grounds, and water
Exterior
- Parking: Garage with assigned parking
- Security: Fire sprinkler system; Gated community; Key card entry; Smoke detector(s)
- Utilities: Public water; Public sewer; Cable available; Electricity available; Phone available; Water available
- Home design: Attached condominium in a high-rise; One level; Resale property; Has a view
- Construction: Built in 1986; Stucco construction; Other roof
- Exterior features: Balcony; Patio
Interior
- Kitchen: Breakfast bar; Dishwasher; Disposal
- Bedrooms: 2 bedrooms (both on main level)
- Flooring: Hardwood floors
- Bathrooms: 2 full bathrooms (main level)
- Heating & cooling: Central heating (forced air); Central air; Ceiling fan(s)
- Interior features: Accessible entrance; Roommate floor plan; Soaking tub; Walk-in closet(s); Foyer
- Laundry & utility: Washer; Dryer; Laundry in kitchen; Laundry closet
Neighborhood map
What this means for you Summary
Snapshot
- This is a 2-bed/2.0-bath townhouse listed at $229k.
Deal economics
- At list price, monthly cash flow is $408 ($5k/yr) — positive.
- The deal already cash-flows at list — no discount required.
- Meets the 1% rule at list price ($3k rent vs $229k).
- Recommended offer: $222k (3.0% below list) — sets the bar for market timing.
- Cap rate 8.4% vs local median 3.1% in Atlanta — top-decile yield for the area; either an underpriced asset or a hidden risk that comps aren't pricing in. Stress-test before assuming the spread holds.
Location & tenants
- Location reads 83/100 on livability (#6 in GA, #919 nationally) — a professional / high-income tenant draw. Strengths: amenities A+, commute A+, housing A+; Watch: cost of living C-.
- Atlanta Public Schools (urban): math 28% / reading 35% proficiency, ranked #80 of 174 in GA (top 46%) — families likely to look elsewhere, expect single-tenant / working-renter base with shorter leases; 71% free/reduced lunch — lower-income household profile, screen leases tightly.
- Zoned schools: E. Rivers Elementary School (math 33% / reading 52%, grade F, #374 of 1,228 statewide, top 31%, 708 students, 32% FRL); Willis A. Sutton Middle School (math 36% / reading 55%, grade D+, #97 of 470 statewide, top 22%, 1,548 students, 34% FRL); North Atlanta High School (math 27% / reading 17%, grade F, #213 of 424 statewide, top 51%, 2,316 students, 24% FRL) — zoned schools average 30% FRL vs 71% district-wide (41 pts lower); this property's tenant base skews higher-income than the district average.
- Market conditions: Rents rising (+3.1%/yr); 408 active listings in the ZIP; 40 comparable units currently listed for rent nearby; rentals leasing fast (median 9d on market — plan ~1-2 weeks tenant-placement turnaround); high-income renter base; 11,565 units permitted in Fulton County in 2024 (8,159 in 5+ unit buildings).
Forward outlook
- Local home prices are declining (-3.0%/yr); year-one equity from $2k of loan paydown is wiped out by about $7k of value loss. Plan a longer hold.
- Fulton County population projected at +38% by 2050 — long-run rental-demand tailwind backs the buy-and-hold thesis.
Negotiation context
- It's been on market 42 days — a 3% lower offer ($222k) is reasonable based on typical stale-listing flexibility.
- 15 sale attempts since 3y ago with the ask held roughly flat each time — persistent listings suggest the price (not the market) is what's stuck; bring a comps-based counter.
Risks & watch-outs
- Climate carrying-cost: extreme-heat days projected 7→19/yr by 2055 (HVAC capex compounding) — expect insurance premiums to compound above CPI over the hold.
Questions for the listing agent
- It's been on market 42 days. Have you received any prior offers? Is the seller open to a 3% concession, seller financing, or rate buy-down credit?
- Is there a deadline driving the sale (1031 exchange, divorce, estate, relocation)? That informs how much negotiation room exists.
- What's the average days-on-market for RENTAL listings here right now (not sales)? A rising rental-DOM trend means longer vacancies and softer asking-rent achievability than the comps imply.
- What's the recent tenant-quality profile in this submarket — average credit score on applications, eviction rate, late-payment / NSF rate, and stable-employment percentage? A property-management company in the area should have these aggregated.
- How much new for-sale + rental construction is in the pipeline within 1–3 miles? Heavy new supply typically softens prices + rents 12–24 months out; constrained supply supports both.
Investment metrics
- 1% rule
- 1.10% ✓
- Cap rate
- 8.43%
- Cash-on-cash
- 7.63%
- DSCR
- 1.34
- GRM
- 7.6
CMA / ARV
- ARV (median comp)
- $262,253
- List price
- $229,000
- Delta
- -12.68%
- Verdict
- UNDERPRICED
- Comps
- 20 within 1.0 mi
Show comp detail 12 sales within ~0.75 mi
| Address | Dist | Beds/Ba | Sqft | Sold | Price | $/sf | Match |
|---|---|---|---|---|---|---|---|
| 50 Biscayne Dr NW #2111 | 0.15mi | 2/2.0 | 1,350 (+4%) | 1mo | $340,000 | $252 | 86 |
| 2277 NE Peachtree Rd NE #404 | 0.22mi | 2/2.0 | 1,281 (-2%) | 2mo | $350,000 | $273 | 86 |
| 115 Biscayne Dr NW Unit E3 | 0.24mi | 3/2.0 (+1) | 1,300 (-0%) | 2mo | $225,000 | $173 | 82 |
| 115 Biscayne Dr NW Unit F10 | 0.24mi | 3/2.0 (+1) | 1,300 (-0%) | 2mo | $270,000 | $208 | 82 |
| 2277 Peachtree Rd NE #402 | 0.22mi | 2/2.0 | 1,242 (-4%) | 1mo | $344,000 | $277 | 81 |
| 78 Peachtree Memorial Dr NW #2 | 0.25mi | 2/2.0 | 1,357 (+4%) | 2mo | $375,000 | $276 | 79 |
| 1 Biscayne Dr NW #112 | 0.16mi | 2/2.0 | 1,200 (-8%) | 3mo | $276,200 | $230 | 77 |
| 136 Peachtree Memorial Dr NW Unit PA4 | 0.34mi | 2/1.5 | 1,108 (-15%) | 1mo | $263,500 | $238 | 57 |
| 2840 Peachtree Rd NE #311 | 0.61mi | 2/2.0 | 1,188 (-9%) | 1mo | $282,000 | $237 | 56 |
| 136 Peachtree Memorial Dr NW Unit CT-6 | 0.34mi | 2/1.5 | 1,108 (-15%) | 2mo | $265,000 | $239 | 56 |
| 136 Peachtree Memorial Dr NW Unit NJ10 | 0.34mi | 2/1.5 | 1,108 (-15%) | 2mo | $310,000 | $280 | 56 |
| 2499 Peachtree Rd NE #506 | 0.73mi | 2/2.0 | 1,399 (+8%) | 2mo | $331,370 | $237 | 52 |
Match score weights: distance 35% · size 25% · config 20% · recency 20%. Top-matched comps best support the ARV.
Projected returns pro-forma
-3.0% appreciation · 3.09% rent growth · sell at horizon
- IRR
- -4.5%
- Equity multiple
- 0.83×
- Total profit
- $-10,875
- Equity at exit
- $34,145
- IRR
- 5.3%
- Equity multiple
- 1.39×
- Total profit
- $25,059
- Equity at exit
- $19,800
Cash invested: $64,120 (down + closing). Projections, not guarantees.
Landlord ↔ Tenant lean methodology
- Overall (STATE)
- 90 Strongly Landlord-Friendly
- State Georgia
- 90 Strongly Landlord-Friendly · R+3
- County
- — inherits STATE
- City
- — inherits STATE
ZIP-level market 30309
- Rents YoY
- 3.1%
- Active inventory
- 408
- Price-to-rent
- 7.6×
Monthly cashflow live
- Estimated rent
- $2,519 high interval (Pro) →
- Mortgage (P&I)
- −$1,201
- Tax est. 1.5%
- −$286 /mo · $3,435/yr
- Insurance
- −$95
- HOA
- −$0
- Vacancy / Maint / Mgmt
- −$529
- Net cashflow
- $408
Break-even live
Sensitivity live
| Price | -10% $566 | -5% $487 | +0% $408 | +5% $329 | +10% $249 |
|---|---|---|---|---|---|
| Rent | -10% $209 | -5% $308 | +0% $408 | +5% $507 | +10% $607 |
| Rate | -1.0pp $523 | -0.5pp $466 | base $408 | +0.5pp $348 | +1.0pp $288 |
UW: 25.0% down · 7.5% · 30yr · 1.5% tax · 5.0% vac · 8.0% maint · 8.0% mgmt
Financing live
Cash to close
- Down payment
- $57,250
- Closing costs
- $6,870
- Reserves months
- —
- Total cash needed
- —
Loan-product check · same deal, 3 products live
Conventional
25% down · 7.5% · 30yr
- Down + closing
- —
- Monthly P&I
- —
- Monthly cashflow
- —
- DSCR
- —
- Eligible?
- —
Personal DTI + credit; lowest rate.
DSCR
20% down · 8.5% · 30yr
- Down + closing
- —
- Monthly P&I
- —
- Monthly cashflow
- —
- DSCR
- —
- Eligible?
- —
No personal income docs; deal must DSCR.
Hard money
10% down · 12.0% · 12mo
- Down + closing
- —
- Monthly P&I
- —
- Monthly cashflow
- —
- DSCR
- —
- Eligible?
- —
Short-term bridge; refi at stabilization.
Rent comps 40 comps
| Address | Beds | Baths | Sqft | Rent | $/sqft | DOM | Units | Dist |
|---|---|---|---|---|---|---|---|---|
| 2171 Peachtree Rd NE Atlanta, GA | 1.0–3.0 | 1.0–3.0 | 1727 | $4,240 | $2.45 | 6d | 7 | 0.05mi |
| 2171 Peachtree Rd NW Unit 1B1BA Atlanta, GA | 1.0 | 1.0 | 1306 | $2,772 | $2.12 | 25d | 1 | 0.05mi |
| 2171 Peachtree Rd NW Unit 2B2BA Atlanta, GA | 2.0 | 2.0 | 1509 | $2,708 | $1.79 | 25d | 1 | 0.05mi |
| 100 Colonial Homes Dr NW Atlanta, GA | 1.0–3.0 | 1.0–2.0 | 1188 | $2,287 | $1.92 | 2d | 28 | 0.08mi |
| 200 Colonial Homes Dr NW Atlanta, GA | 1.0–2.0 | 1.0–2.0 | 980 | $2,345 | $2.39 | 2d | 9 | 0.15mi |
| 40 Peachtree Valley Rd NE Atlanta, GA | 3.0 | 1.0–2.0 | 1103 | $2,008 | $1.82 | 2d | 47 | 0.18mi |
| 1000 Peachtree Park Dr NE Atlanta, GA | 1.0–3.0 | 1.0–2.0 | 994 | $1,631 | $1.64 | 3d | 22 | 0.18mi |
| 2277 Peachtree Rd Atlanta, GA | 1.0 | 1.0 | 1144 | $1,100 | $0.96 | 25d | 1 | 0.22mi |
| 222 Colonial Homes Dr NW Atlanta, GA | 1.0–3.0 | 1.0–2.0 | 968 | $2,897 | $2.99 | 2d | 14 | 0.24mi |
| 2035 Peachtree Rd NW Atlanta, GA | 2.0 | 2.0 | 988 | $2,037 | $2.06 | 16d | 1 | 0.24mi |
| 115 Biscayne Dr NW Unit B1 Atlanta, GA | 3.0 | 2.0 | 1300 | $1,899 | $1.46 | 25d | 1 | 0.25mi |
| 2035 Peachtree Rd NE Atlanta, GA | 1.0–2.0 | 1.0–2.0 | 771 | $1,636 | $2.12 | 2d | 18 | 0.26mi |
| 120 Biscayne Dr NW Unit B10 Atlanta, GA | 2.0 | 1.5 | 1036 | $1,795 | $1.73 | 19d | 1 | 0.26mi |
| 1899 Anjaco Rd NW #1 Atlanta, GA | 2.0 | 2.0 | 1800 | $4,000 | $2.22 | 14d | 1 | 0.47mi |
| 1820 Peachtree St NW #1003 Atlanta, GA | 2.0 | 2.5 | 1381 | $4,000 | $2.90 | 17d | 1 | 0.55mi |
| 2420 Peachtree Rd NW Atlanta, GA | 1.0–2.0 | 1.0–2.0 | 957 | $2,911 | $3.04 | 21d | 5 | 0.57mi |
| 2425 Peachtree Rd NE #503 Atlanta, GA | 2.0 | 2.5 | 1470 | $8,500 | $5.78 | 22d | 1 | 0.60mi |
| 1777 Peachtree St NE Atlanta, GA | 2.0 | 1.0–2.0 | 886 | $3,079 | $3.47 | 8d | 6 | 0.66mi |
| 1777 Peachtree Rd NE Unit 1009 Atlanta, GA | 3.0 | 2.0 | 1395 | $3,399 | $2.44 | 15d | 1 | 0.66mi |
| 2467 Peachtree Rd Unit 1 Atlanta, GA | 2.0 | 2.0 | 1050 | $1,950 | $1.86 | 25d | 1 | 0.69mi |
| 2467 Peachtree Rd NE Atlanta, GA | 2.0 | 2.0 | 1050 | $2,375 | $2.26 | 25d | 1 | 0.69mi |
| 147 26th St NW Atlanta, GA | 2.0 | 1.0–2.0 | 956 | $1,949 | $2.04 | 2d | 24 | 0.75mi |
| 267 Goodson Way NW Atlanta, GA | 2.0 | 2.5 | 1350 | $2,750 | $2.04 | 5d | 1 | 0.82mi |
| 130 26th St NW #706 Atlanta, GA | 2.0 | 1.0 | 1150 | $2,800 | $2.43 | 25d | 1 | 0.86mi |
| 311 Peachtree Hills Ave NE Atlanta, GA | 2.0 | 1.0 | 1060 | $2,600 | $2.45 | 25d | 1 | 0.88mi |
| 225 26th St NW Atlanta, GA | 3.0 | 1.0–2.0 | 1197 | $2,295 | $1.92 | 2d | 13 | 0.90mi |
| 2575 Peachtree Rd NE Unit 7G Atlanta, GA | 2.0 | 2.0 | 1600 | $9,000 | $5.62 | 2d | 1 | 0.92mi |
| The Peach Atlanta, GA | 1.0–3.0 | 1.0–3.5 | 1175 | $2,510 | $2.14 | 4d | 38 | 0.97mi |
| — Atlanta, GA | 2.0 | 2.0 | 1732 | $5,800 | $3.35 | 13d | 1 | 0.97mi |
| 245 Lindbergh Dr NE Atlanta, GA | 3.0 | 2.0 | 1292 | $4,095 | $3.17 | 25d | 1 | 0.99mi |
| 1660 Peachtree St NW Atlanta, GA | 1.0–2.0 | 1.0–2.0 | 1022 | $2,095 | $2.05 | 4d | 18 | 1.02mi |
| 1925 Monroe Dr NE Atlanta, GA | 1.0–3.0 | 1.0–2.0 | 1101 | $2,418 | $2.20 | 2d | 47 | 1.05mi |
| 370 Peachtree Hills Ave NE Atlanta, GA | 2.0 | 1.0 | 950 | $1,322 | $1.39 | 4d | 4 | 1.07mi |
| 350 Peachtree Hills Ave NE Atlanta, GA | 1.0–2.0 | 1.0–2.0 | 950 | $1,940 | $2.04 | 2d | 28 | 1.08mi |
| 81 E Wesley Rd NE Unit 02 Atlanta, GA | 2.0 | 1.0 | 900 | $1,399 | $1.55 | 8d | 1 | 1.14mi |
| 1760 Northside Dr NW Atlanta, GA | 1.0–2.0 | 1.0–2.0 | 701 | $1,749 | $2.49 | 3d | 7 | 1.17mi |
| 300 Deering Rd NW Atlanta, GA | 1.0–2.0 | 1.0–2.0 | 775 | $1,327 | $1.71 | 3d | 8 | 1.22mi |
| 500 Northside Cir NW Atlanta, GA | 1.0–2.0 | 1.0–2.0 | 962 | $1,850 | $1.92 | 2d | 21 | 1.25mi |
| 2000 Monroe Pl NE Atlanta, GA | 1.0–2.0 | 1.0–2.0 | 995 | $2,289 | $2.30 | 5d | 10 | 1.27mi |
| 2000 Monroe Pl NE Atlanta, GA | 2.0 | 2.0 | 1110 | $1,729 | $1.56 | 22d | 1 | 1.27mi |
Listing history 50 events
-
2026-06-18days on market $229,000 Active 42 DOM
-
2026-06-17days on market $229,000 Active 41 DOM
-
2026-06-16days on market $229,000 Active 40 DOM
-
2026-06-15days on market $229,000 Active 39 DOM
-
2026-06-13days on market $229,000 Active 37 DOM
-
2026-06-13days on market $229,000 Active 36 DOM
-
2026-06-09days on market $229,000 Active 33 DOM
-
2026-06-08days on market $229,000 Active 32 DOM
-
2026-06-07days on market $229,000 Active 31 DOM
-
2026-06-04days on market $229,000 Active 28 DOM
-
2026-06-03days on market $229,000 Active 27 DOM
-
2026-06-02days on market $229,000 Active 26 DOM
-
2026-06-01days on market $229,000 Active 25 DOM
-
2026-05-31days on market $229,000 Active 24 DOM
-
2026-05-07$229,000 New 1614-char remark
-
2026-05-06historical $229,000 1614-char remark
-
2026-02-13historical $1,125
-
2026-01-31price $1,125
-
2026-01-26historical $1,150
-
2026-01-24price $1,150
-
2026-01-21$1,175
-
2026-01-17price $1,175
-
2026-01-10price $1,200
-
2026-01-09price $1,275
-
2025-12-22historical $1,300
-
2025-12-06$1,300
-
2025-12-06historical $2,400
-
2025-10-30price $2,400
-
2025-10-14$2,500
-
2025-02-24historical $1,200
-
2025-02-19price $1,200
-
2025-02-13price $1,250
-
2025-02-06$1,275
-
2025-01-31historical $1,300
-
2025-01-30price $1,300
-
2025-01-29historical $1,250
-
2025-01-28$1,250
-
2025-01-26$2,500
-
2025-01-26historical $1,200
-
2025-01-23price $1,200
-
2024-12-27price $2,500
-
2024-12-25price $2,600
-
2024-12-05$2,800
-
2024-11-22$241,255
-
2024-10-02historical $2,300
-
2024-09-12$2,300
-
2024-09-05historical $2,300
-
2024-08-24price $2,300
-
2024-08-01$2,450
-
2024-07-11$1,230
ⓘ Source: listings_history table (triggers on properties + properties_extension) + one-shot
backfill from property_details.listing_events for pre-trigger history.
Climate risk First Street
- Flood 1/10 Low FEMA zone X (unshaded) · 0% chance over 30 yrs
- Wildfire 1/10 Low
- Heat 6/10 Major 7 d/yr ≥104°F today · 19 d/yr by 30 yrs out
- Wind 4/10 Moderate 21% chance of damaging wind over 30 yrs
- Air quality 4/10 Moderate 5 unhealthy d/yr today · 7 by 30 yrs out
Nearby sold comps map
Loading sold comps map…
Walkable amenities ~0.75 mi
Loading nearby amenities…
Taxation est. · year 1
- Rental income
- $30,232
- − Mortgage interest
- −$12,828
- − Property taxes
- −$3,435
- − Insurance
- −$1,145
- − Repairs & maintenance
- −$2,419
- − Management
- −$2,419
- − Depreciation
- −$6,662
- Taxable income
- $1,325
- Est. tax owed @ 24.0%
- −$318
- After-tax cash flow
- $4,574/yr
For passive investors: Depreciation is non-cash, so a rental often shows a tax loss while cash-flowing — sheltering income. Rental losses are passive: they offset passive income freely, and up to $25,000/yr can offset ordinary (W-2) income if you actively participate and your MAGI is under $100k (phasing out to $0 by $150k); unused losses carry forward. On sale, claimed depreciation is recaptured at up to 25%, and gains may owe capital-gains tax (a 1031 exchange can defer both). Figures are a year-1 estimate at your 24.0% rate — not tax advice; consult a CPA.
Schools (NCES district)
- District
- Atlanta Public Schools
- NCES district ID
- 1300120
- Math proficiency
- 28% ▼ -6.00%
- Reading proficiency
- 35% ▼ -2.00%
- Median HH income
- $48,306
- Composite
- 27.27/100
- National rank
- #7006
- State rank
- #80 of 174 in GA
Livability — Atlanta
- Score
- 83/100
- State rank
- #6
- US rank
- #919
Category grades
Schools grade is shown separately in the Schools card above.
Census & demographics
- Census place
- Atlanta, GA
- County
- Fulton County · 1,094,430 people
- City population
- 629,525
- Metro
- Atlanta-Sandy Springs-Alpharetta, GA
- Population (ZIP)
- 32,479
- Household income
- $114,072
- Rent vs Own
- Severe rent burden
- 2135.0
Population outlook (Fulton County) Hauer SSP2
- Today (2025)
- 1,203,707 people
- By 2030
- 1,299,706 · +8.0%
- By 2040
- 1,488,256 · +23.6%
- By 2050
- 1,664,580 · +38.3%
- By 2075
- 2,036,072 · +69.2%
- By 2100
- 2,222,402 · +84.6%
Race, ethnicity, and origin ACS 2023
- Neighborhood character
- Diverse neighborhood (Simpson 0.57)
- Race & ethnicity
- White 62% Black 14% Asian 9% Hispanic / Latino 8% Two or more races 8%
- Hispanic origin (detail)
- Mexican 2% Puerto Rican 2%
- Common ancestry
- Slovak 3% Romanian 2% Lithuanian 2%
- Foreign-born
- 15% · Canada, China, South Korea
- Languages at home
- 83% English-only · Spanish 5% Other Indo-European 4% Chinese 3%
Political lean MEDSL · Fulton
- 2024 margin
- Solid D (+44.9) · D 71.9% · R 27.0% · Other 1.1%
- 2008→2024 swing
- +9.8pp toward D · 2008: 35.0pp · 2024: 44.9pp
- All cycles
- 2024: D+44.9 2020: D+46.4 2016: D+42.1 2012: D+29.6 2008: D+35.0
Not yet ingested
- Civics
- —
Market trends
- HPI YoY
- ▼ -561.75%
- Current HPI
- 156.3796
- Rent YoY
- ▲ 3.09%
- Metro
- Atlanta-Sandy Springs-Alpharetta, GA
- State GDP YoY
- ▲ 2.66%
- F500 in state
- 28
Industry mix (Fortune 500 HQ in GA)
| Industry | F500 HQs | Revenue |
|---|---|---|
| Paper / Packaging | 2 | $29B |
|
||
| Retail | 1 | $160B |
|
||
| Transportation / Logistics | 1 | $91B |
|
||
| Airlines | 1 | $62B |
|
||
| Consumer Goods | 1 | $47B |
|
||
| Utilities | 1 | $25B |
|
||
Price history
+9441.7% since first listed44 events — show timeline
- 2026-05-07 Listed $229,000 GAMLS
- 2026-05-06 Coming Soon $229,000 GAMLS
- 2026-02-13 Rental Removed $1,125 ZUMPER1
- 2026-01-31 Price Changed $1,125 ZUMPER1
- 2026-01-26 Rental Removed $1,150 RENTALBEAST
- 2026-01-24 Price Changed $1,150 ZUMPER1
- 2026-01-21 Listed for Rent $1,175 RENTALBEAST
- 2026-01-17 Price Changed $1,175 ZUMPER1
- 2026-01-10 Price Changed $1,200 ZUMPER1
- 2026-01-09 Price Changed $1,275 ZUMPER1
- 2025-12-22 Rental Removed $1,300 RENTALBEAST
- 2025-12-06 Listed for Rent $1,300 ZUMPER1
- 2025-12-06 Rental Removed $2,400 APPFOLIO
- 2025-10-30 Price Changed $2,400 RENTALBEAST
- 2025-10-14 Listed for Rent $2,500 RENTALBEAST
- 2025-02-24 Rental Removed $1,200 ZUMPER1
- 2025-02-19 Price Changed $1,200 ZUMPER1
- 2025-02-13 Price Changed $1,250 ZUMPER1
- 2025-02-06 Listed for Rent $1,275 ZUMPER1
- 2025-01-31 Rental Removed $1,300 ZUMPER1
- 2025-01-30 Price Changed $1,300 ZUMPER1
- 2025-01-29 Rental Removed $1,250 RENTALBEAST
- 2025-01-28 Listed for Rent $1,250 ZUMPER1
- 2025-01-26 Listed for Rent $2,500 RENTALBEAST
- 2025-01-26 Rental Removed $1,200 TURBOTENANT
- 2025-01-23 Price Changed $1,200 APPFOLIO
- 2024-12-27 Price Changed $2,500 TURBOTENANT
- 2024-12-25 Price Changed $2,600 TURBOTENANT
- 2024-12-05 Listed for Rent $2,800 TURBOTENANT
- 2024-11-22 Listed $241,255 EABOR
- 2024-10-02 Rental Removed $2,300 GAMLS
- 2024-09-12 Listed for Rent $2,300 APPFOLIO
- 2024-09-05 Rental Removed $2,300 APPFOLIO
- 2024-08-24 Price Changed $2,300 GAMLS
- 2024-08-01 Listed for Rent $2,450 GAMLS
- 2024-07-11 Listed for Rent $1,230 APPFOLIO
- 2024-06-28 Rental Removed $1,230 APPFOLIO
- 2024-06-27 Listed for Rent $1,230 APPFOLIO
- 2024-02-09 Rental Removed $2,400 RENTALBEAST
- 2023-12-24 Listed for Rent $2,400 RENTALBEAST
- 2023-06-07 Sold (MLS) $281,000 GAMLS
- 2023-05-24 Pending — GAMLS
- 2023-04-13 Listed $284,000 GAMLS
- 2022-06-16 Price Changed $2,400 RENT.
Cash-flow waterfall
monthlySold comps — $/sqft
last 12 mo · ≤1 miLoading sold comps…