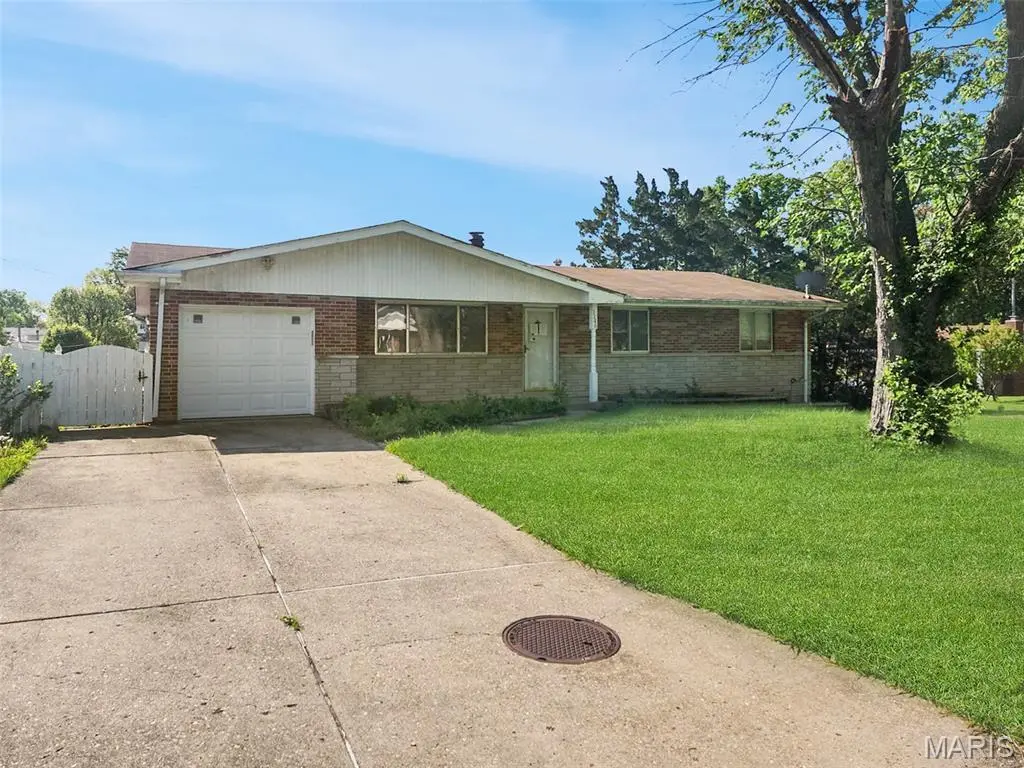
1146 Hawkstone Ln · Mehlville, MO
Flood risk 1/10 · Minimal
- FEMA flood zone
- X (unshaded)
- Chance of flooding over 30 yrs
- 0.0%
- Est. flood insurance / yr
- $473 – $860
Fire risk 1/10 · Minimal
- Est. fire insurance / yr
- $1,054 – $1,958
Heat risk 5/10 · Moderate
- Hot days now (above 107°F)
- 7 days/yr
- Hot days in 30 yrs
- 21 days/yr
Wind risk 2/10 · Minimal
- Chance of severe wind over 30 yrs
- 1.0%
Air-quality risk 3/10 · Minor
- Unhealthy air days now
- 2 days/yr
- Unhealthy air days in 30 yrs
- 3 days/yr
Risk factors via First Street. Map © Google.
Why this score? — see what drove the C grade
The composite is a weighted blend of 9 inputs, each scored 0–100. Each bar is that input's sub-score; the figure is the points it added to the 100-point composite (weight × sub-score).
- Cash flow +19.2/30.0
- ARV discount +14.5/15.0
- DSCR +6.1/10.0
- 1% rule +4.7/10.0
- Schools +3.5/10.0
- Livability +3.3/5.0
- Rent growth +2.5/5.0
- Condition / age +2.5/5.0
- Appreciation +0.0/10.0
$225,000
🖨 Deal sheet 📄 Offer letter ✓ Due diligence
Listing remarks
This charming Saint Louis ranch at 1146 Hawkstone Ln offers approximately 1,488 square feet of functional living space featuring four spacious bedrooms and two full bathrooms. The interior flows seamlessly into a full basement providing ample storage or potential for customization, complemented by the convenience of an attached one-car garage. Situated in the 63125 area, this well-maintained home combines classic comfort with practical amenities, making it a perfect opportunity for anyone seeking a move-in-ready residence.
Key facts
- 7,701 sq ft lot
- Garage
- Built 1965
Property features AI
Exterior
- Parking: Attached garage (1-car)
- Utilities: Public water; Public sewer; Electric service by Ameren
- Home design: Single family residence; One level
- Construction: Built with other construction materials
- Exterior features: Front yard; Back yard
Interior
- Bedrooms: Four bedrooms, all on the main level
- Bathrooms: Two full bathrooms (both on the main level)
- Heating & cooling: Forced air heating; Central air conditioning
- Interior features: Full basement
Neighborhood map
What this means for you Summary
Snapshot
- This is a 4-bed/2.0-bath single-family listed at $225k.
Deal economics
- At list price, monthly cash flow is $242 ($3k/yr) — positive.
- The deal already cash-flows at list — no discount required.
- To meet the 1% rule (rent ≥ 1% of price), the offer needs to be $218k (3.0% below list).
- Recommended offer: $218k (3.0% below list) — sets the bar for 1% rule.
- Cap rate 7.6% vs local median 4.4% in Mehlville — top-decile yield for the area; either an underpriced asset or a hidden risk that comps aren't pricing in. Stress-test before assuming the spread holds.
Location & tenants
- Location reads 66/100 on livability (#232 in MO) — a middle-class / working-renter tenant base. Strengths: cost of living A+, housing A+; Watch: schools C-, crime D+, amenities F.
- Mehlville R-IX (suburban): math 31% / reading 48% proficiency, ranked #126 of 324 in MO (top 39%) — families likely to look elsewhere, expect single-tenant / working-renter base with shorter leases.
- Market conditions: 146 active listings in the ZIP; 5 comparable units currently listed for rent nearby; rentals at typical pace (median 15d on market — plan ~3-4 weeks tenant-placement turnaround); 920 units permitted in St. Louis County in 2024 (250 in 5+ unit buildings).
- This rent runs 43% of the median local income ($62k/yr) — at the standard rent-burdened threshold; future hikes will face affordability resistance.
Forward outlook
- Local home prices are declining (-3.0%/yr); year-one equity from $2k of loan paydown is wiped out by about $7k of value loss. Plan a longer hold.
Negotiation context
- It's been on market 17 days — a 2% lower offer ($222k) is reasonable based on typical stale-listing flexibility.
Risks & watch-outs
- Climate carrying-cost: extreme-heat days projected 7→21/yr by 2055 (HVAC capex compounding) — expect insurance premiums to compound above CPI over the hold.
Questions for the listing agent
- Built in 1965 — when were the roof, HVAC, electrical panel, plumbing, and water heater last replaced?
- Is there a deadline driving the sale (1031 exchange, divorce, estate, relocation)? That informs how much negotiation room exists.
- Crime grade is D in this area — have there been break-ins, vandalism, or insurance claims at this property in the last 3 years? What carrier currently insures it and at what premium?
- What's the average days-on-market for RENTAL listings here right now (not sales)? A rising rental-DOM trend means longer vacancies and softer asking-rent achievability than the comps imply.
- What's the recent tenant-quality profile in this submarket — average credit score on applications, eviction rate, late-payment / NSF rate, and stable-employment percentage? A property-management company in the area should have these aggregated.
- How much new for-sale + rental construction is in the pipeline within 1–3 miles? Heavy new supply typically softens prices + rents 12–24 months out; constrained supply supports both.
Investment metrics
- 1% rule
- 0.97% ✗
- Cap rate
- 7.58%
- Cash-on-cash
- 4.61%
- DSCR
- 1.21
- GRM
- 8.6
CMA / ARV
- ARV (median comp)
- $266,567
- List price
- $225,000
- Delta
- -15.59%
- Verdict
- UNDERPRICED
- Comps
- 20 within 1.0 mi
Show comp detail 12 sales within ~0.75 mi
| Address | Dist | Beds/Ba | Sqft | Sold | Price | $/sf | Match |
|---|---|---|---|---|---|---|---|
| 1125 Hawkstone Ln | 0.05mi | 3/1.5 (-1) | 1,444 (-3%) | 2mo | $225,000 | $156 | 84 |
| 3608 Cordes Dr | 0.53mi | 3/2.0 (-1) | 1,534 (+3%) | 2mo | $324,900 | $212 | 64 |
| 767 Paschal Dr | 0.39mi | 3/1.5 (-1) | 1,392 (-6%) | 4mo | $329,900 | $237 | 61 |
| 3762 Calef Dr | 0.58mi | 3/2.0 (-1) | 1,551 (+4%) | 2mo | $275,000 | $177 | 59 |
| 1030 Camelot Gardens Dr Dr | 0.50mi | 3/2.0 (-1) | 1,587 (+7%) | 3mo | $299,900 | $189 | 58 |
| 710 Peace Haven Dr | 0.74mi | 3/2.0 (-1) | 1,537 (+3%) | 0mo | $249,900 | $163 | 55 |
| 686 Damascus Dr | 0.74mi | 3/2.0 (-1) | 1,446 (-3%) | 2mo | $315,000 | $218 | 54 |
| 114 Buckley Meadows Dr | 0.71mi | 3/1.0 (-1) | 1,436 (-4%) | 2mo | $225,000 | $157 | 51 |
| 2818 Redstone Dr | 0.50mi | 3/1.5 (-1) | 1,669 (+12%) | 3mo | $239,900 | $144 | 47 |
| 560 Blossomheath Dr | 0.59mi | 3/2.5 (-1) | 1,660 (+12%) | 1mo | $249,900 | $151 | 45 |
| 2957 Caspian Ln | 0.64mi | 4/2.0 | 1,700 (+14%) | 2mo | $211,000 | $124 | 44 |
| 36 Buckley Meadows Dr | 0.59mi | 3/2.0 (-1) | 1,686 (+13%) | 4mo | $280,000 | $166 | 42 |
Match score weights: distance 35% · size 25% · config 20% · recency 20%. Top-matched comps best support the ARV.
Projected returns pro-forma
-3.0% appreciation · 3.0% rent growth · sell at horizon
- IRR
- -9.1%
- Equity multiple
- 0.67×
- Total profit
- $-21,053
- Equity at exit
- $33,548
- IRR
- 0.3%
- Equity multiple
- 1.02×
- Total profit
- $1,475
- Equity at exit
- $19,454
Cash invested: $63,000 (down + closing). Projections, not guarantees.
Landlord ↔ Tenant lean methodology
- Overall (STATE)
- 81 Strongly Landlord-Friendly
- State Missouri
- 81 Strongly Landlord-Friendly · R+10
- County
- — inherits STATE
- City
- — inherits STATE
ZIP-level market 63125
- Active inventory
- 146
- Price-to-rent
- 8.6×
Monthly cashflow live
- Estimated rent
- $2,183 high interval (Pro) →
- Mortgage (P&I)
- −$1,180
- Tax from tax record
- −$209 /mo · $2,508/yr
- Insurance
- −$94
- HOA
- −$0
- Vacancy / Maint / Mgmt
- −$458
- Net cashflow
- $242
Break-even live
UW: 25.0% down · 7.5% · 30yr · 1.5% tax · 5.0% vac · 8.0% maint · 8.0% mgmt
Financing live
Cash to close
- Down payment
- $56,250
- Closing costs
- $6,750
- Reserves months
- —
- Total cash needed
- —
Loan-product check · same deal, 3 products live
Conventional
25% down · 7.5% · 30yr
- Down + closing
- —
- Monthly P&I
- —
- Monthly cashflow
- —
- DSCR
- —
- Eligible?
- —
Personal DTI + credit; lowest rate.
DSCR
20% down · 8.5% · 30yr
- Down + closing
- —
- Monthly P&I
- —
- Monthly cashflow
- —
- DSCR
- —
- Eligible?
- —
No personal income docs; deal must DSCR.
Hard money
10% down · 12.0% · 12mo
- Down + closing
- —
- Monthly P&I
- —
- Monthly cashflow
- —
- DSCR
- —
- Eligible?
- —
Short-term bridge; refi at stabilization.
Rent comps 5 comps
| Address | Beds | Baths | Sqft | Rent | $/sqft | DOM | Units | Dist |
|---|---|---|---|---|---|---|---|---|
| 3633 Shores Dr Saint Louis, MO | 3.0 | 2.0 | 884 | $1,920 | $2.17 | 14d | 1 | 0.56mi |
| 3912 Manorwood Dr Saint Louis, MO | 4.0 | 2.0 | 1800 | $2,350 | $1.31 | 44d | 1 | 0.58mi |
| 4001 Mitchford Dr Saint Louis, MO | 3.0 | 2.0 | 1288 | $2,400 | $1.86 | 1d | 1 | 0.66mi |
| 2628 Wessex Dr Saint Louis, MO | 3.0 | 2.0 | 1560 | $1,975 | $1.27 | 19d | 1 | 0.93mi |
| 2231 Rosegarden Dr Saint Louis, MO | 3.0 | 3.0 | 1649 | $2,100 | $1.27 | 1d | 1 | 1.25mi |
Listing history 4 events
-
2026-06-01days on market $225,000 Active 17 DOM
-
2026-05-31days on market $225,000 Active 16 DOM
-
2026-05-15$225,000 Active 528-char remark
-
1983-05-01soldstatus
ⓘ Source: listings_history table (triggers on properties + properties_extension) + one-shot
backfill from property_details.listing_events for pre-trigger history.
Tax reassessment forecast MO · Resets to sale price
- Current annual tax
- $2,508 · $209/mo
- Projected year-2 tax
- $2,508 · $209/mo
- Expected delta
- $0/yr ($0/mo · 0.0%)
ⓘ Screening estimate from a state-policy table — verify with the county assessor before closing.
Climate risk First Street
- Flood 1/10 Low FEMA zone X (unshaded) · 0% chance over 30 yrs
- Wildfire 1/10 Low
- Heat 5/10 Major 7 d/yr ≥107°F today · 21 d/yr by 30 yrs out
- Wind 2/10 Low 100% chance of damaging wind over 30 yrs
- Air quality 3/10 Moderate 2 unhealthy d/yr today · 3 by 30 yrs out
Nearby sold comps map
Loading sold comps map…
Walkable amenities ~0.75 mi
Loading nearby amenities…
Taxation est. · year 1
- Rental income
- $26,199
- − Mortgage interest
- −$12,603
- − Property taxes
- −$2,508
- − Insurance
- −$1,125
- − Repairs & maintenance
- −$2,096
- − Management
- −$2,096
- − Depreciation
- −$6,545
- Taxable loss
- −$775
- Est. tax savings @ 24.0%
- +$186
- After-tax cash flow
- $3,091/yr
For passive investors: Depreciation is non-cash, so a rental often shows a tax loss while cash-flowing — sheltering income. Rental losses are passive: they offset passive income freely, and up to $25,000/yr can offset ordinary (W-2) income if you actively participate and your MAGI is under $100k (phasing out to $0 by $150k); unused losses carry forward. On sale, claimed depreciation is recaptured at up to 25%, and gains may owe capital-gains tax (a 1031 exchange can defer both). Figures are a year-1 estimate at your 24.0% rate — not tax advice; consult a CPA.
Schools (NCES district)
- District
- Mehlville R-IX
- NCES district ID
- 2920670
- Math proficiency
- 31% ▼ -14.00%
- Reading proficiency
- 48% ▼ -5.00%
- Median HH income
- $62,254
- Composite
- 35.19/100
- National rank
- #4995
- State rank
- #126 of 324 in MO
Livability — Mehlville
- Score
- 66/100
- State rank
- #232
- US rank
- #11310
Category grades
Schools grade is shown separately in the Schools card above.
Census & demographics
- Census place
- Mehlville, MO
- County
- Saint Louis County · 888,823 people
- Metro
- St. Louis, MO-IL
- Population (ZIP)
- 33,294
- Household income
- $61,624
- Rent vs Own
- Severe rent burden
- 631.0
Population outlook (St. Louis County) Hauer SSP2
- Today (2025)
- 1,025,227 people
- By 2030
- 1,028,023 · +0.3%
- By 2040
- 1,020,940 · -0.4%
- By 2050
- 1,007,280 · -1.8%
- By 2075
- 987,277 · -3.7%
- By 2100
- 921,984 · -10.1%
Race, ethnicity, and origin ACS 2023
- Neighborhood character
- Predominantly White (86%)
- Race & ethnicity
- White 86% Two or more races 5% Black 4% Hispanic / Latino 4% Asian 2%
- Common ancestry
- American 9% Romanian 3% Lithuanian 3%
- Foreign-born
- 14% · Canada, Vietnam
- Languages at home
- 83% English-only · Russian/Polish/Slavic 11% Spanish 3% Vietnamese 1%
Political lean MEDSL · St. Louis
- 2024 margin
- Strong D (+23.4) · D 60.8% · R 37.4% · Other 1.7%
- 2008→2024 swing
- +3.5pp toward D · 2008: 19.9pp · 2024: 23.4pp
- All cycles
- 2024: D+23.4 2020: D+24.0 2016: D+16.2 2012: D+13.7 2008: D+19.9
Not yet ingested
- Civics
- —
Market trends
- HPI YoY
- ▼ -173.27%
- Current HPI
- 234.3792
- Rent YoY
- —
- Metro
- St. Louis, MO-IL
- State GDP YoY
- ▲ 1.84%
- F500 in state
- 20
Industry mix (Fortune 500 HQ in MO)
| Industry | F500 HQs | Revenue |
|---|---|---|
| Healthcare | 1 | $163B |
|
||
| Insurance | 1 | $21B |
|
||
| Industrial Technology | 1 | $17B |
|
||
| Retail | 1 | $16B |
|
||
| Industrial Distribution | 1 | $10B |
|
||
| Utilities | 1 | $9B |
|
||
Price history
2 events — show timeline
- 2026-05-15 Listed $225,000 MARIS as Distributed by MLS Grid
- 1983-05-01 Sold (Public Records) — Public Records
Property tax history
+2.8%/yrLatest (2022): $2,508 · +12.7% YoY. Source: county tax records.
Cash-flow waterfall
monthlySold comps — $/sqft
last 12 mo · ≤1 miLoading sold comps…