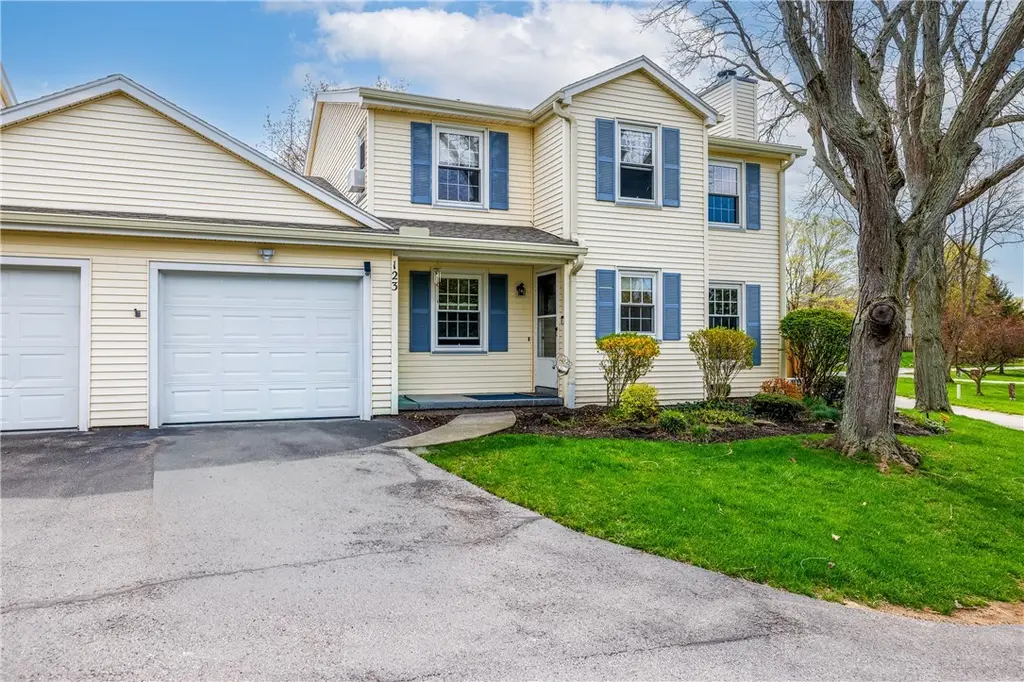
123 Blue Ridge Rd · Irondequoit, NY
Flood risk 1/10 · Minimal
- FEMA flood zone
- X (unshaded)
- Chance of flooding over 30 yrs
- 0.0%
- Est. flood insurance / yr
- $473 – $860
Fire risk 2/10 · Minimal
- Est. fire insurance / yr
- $691 – $1,283
Heat risk 2/10 · Minimal
- Hot days now (above 95°F)
- 7 days/yr
- Hot days in 30 yrs
- 16 days/yr
Wind risk 1/10 · Minimal
- Chance of severe wind over 30 yrs
- —
Air-quality risk 2/10 · Minimal
- Unhealthy air days now
- 1 days/yr
- Unhealthy air days in 30 yrs
- 2 days/yr
Risk factors via First Street. Map © Google.
Why this score? — see what drove the D grade
The composite is a weighted blend of 9 inputs, each scored 0–100. Each bar is that input's sub-score; the figure is the points it added to the 100-point composite (weight × sub-score).
- ARV discount +15.0/15.0
- Cash flow +5.8/30.0
- Schools +5.5/10.0
- 1% rule +4.6/10.0
- Livability +4.0/5.0
- Rent growth +2.5/5.0
- Condition / age +2.5/5.0
- DSCR +0.2/10.0
- Appreciation +0.0/10.0
$180,000
🖨 Deal sheet 📄 Offer letter ✓ Due diligence
Listing remarks
Updated 2-bedroom, 1.5-bath, two-level townhome in desirable Penfield, located within the Webster School District! This move-in ready home offers a welcoming entry foyer with tile flooring and a convenient coat closet. The main level features stylish wide-plank vinyl flooring and a cozy living room with a gas fireplace—perfect for relaxing or entertaining. Sliding glass doors lead to a private deck and yard space. The galley-style kitchen showcases deep blue cabinetry, Corian countertops, and stainless steel appliances, all included, and flows seamlessly into the open dining area. Upstairs, the spacious primary suite includes an additional sitting area and direct access to the full ba
Key facts
- $328 HOA
- Garage
- Built 1976
Property features AI
Finance
- Financial info: Pets allowed: cats and dogs
- HOA & community: Association: Crofton; HOA fee of $328 monthly; HOA covers common area maintenance, common area insurance, insurance, structure maintenance, reserve fund, sewer, snow removal, trash, and water
Exterior
- Parking: Attached garage; 1 garage space; Open parking; Garage door opener
- Security: Owned security system
- Utilities: Public water connected; Sewer connected; Circuit breaker electric; Cable available; High-speed internet available
- Home design: Two-story property; Existing/resale condition
- Construction: Vinyl siding; Copper plumbing; Asphalt roof; Full basement with sump pump
- Exterior features: Deck; Open porch; Porch; Cul-de-sac lot; Irregular lot; Residential lot; City street frontage
Interior
- Kitchen: Dishwasher; Electric oven; Electric range; Microwave; Refrigerator; Disposal
- Flooring: Carpet; Ceramic tile; Luxury vinyl; Tile; Varies
- Bathrooms: 1 full bathroom; 1 half bathroom; One main-level bathroom
- Heating & cooling: Electric heating; Baseboard heating; Wall cooling unit(s)
- Interior features: Ceiling fan(s); Separate/formal dining room; Entrance foyer; Separate/formal living room; Home office; Pantry; Sliding glass door(s); Storage; Solid surface counters; Thermal windows; Sliding doors
- Laundry & utility: Washer; Dryer; Laundry located in basement; Electric water heater
Neighborhood map
What this means for you Summary
Snapshot
- This is a 2-bed/1.5-bath townhouse listed at $180k.
Deal economics
- At list price, monthly cash flow is $-357 ($-4k/yr) — negative.
- To cash-flow at today's rent, offer at most $117k (35.0% below list).
- To meet the 1% rule (rent ≥ 1% of price), the offer needs to be $173k (3.8% below list).
- Recommended offer: $117k (35.0% below list) — sets the bar for cash-flow.
Location & tenants
- Location reads 81/100 on livability (#92 in NY, #1,414 nationally) — a professional / high-income tenant draw. Strengths: housing A+, health & safety A+, crime B+; Watch: amenities F.
- Webster Central School District (suburban): math 62% / reading 63% proficiency, ranked #184 of 590 in NY (top 31%) — acceptable for families but not a draw, mixed tenant base, ~2y average lease; only 12% free/reduced lunch — higher-income household profile.
- Market conditions: 113 active listings in the ZIP; 1 comparable units currently listed for rent nearby; high-income renter base; 1,169 units permitted in Monroe County in 2024 (591 in 5+ unit buildings).
- This rent is only 18% of the median local income ($119k/yr) — well below the 30% rent-burden line; pricing power to push rent on renewal without tenant pushback.
Forward outlook
- Local home prices are declining (-3.0%/yr); year-one equity from $1k of loan paydown is wiped out by about $5k of value loss. Plan a longer hold.
- Monroe County population projected to shrink 6% by 2050 — rents likely to lag national; underwrite the cash flow, not the appreciation.
Negotiation context
- Only 7 days on market — expect competitive offers; lowballing is unlikely to land.
- Current owner paid $97k; list at $180k implies a 86% gain — meaningful room to come down on a strong offer.
Risks & watch-outs
- Watch-outs: property tax is 2.5% of price.
Questions for the listing agent
- What do current leases actually rent for vs. the listed asking? Can we see a recent rent roll and the last 12 months of T-12 income?
- Built in 1976 — when were the roof, HVAC, electrical panel, plumbing, and water heater last replaced?
- Property tax is high relative to price — has the assessment been appealed recently, and will the sale trigger a re-assessment?
- What does the HOA fee cover, when was the last increase, and are there any pending special assessments or reserve-fund shortfalls?
- Is there a deadline driving the sale (1031 exchange, divorce, estate, relocation)? That informs how much negotiation room exists.
- Schools are B-rated — typically a magnet for longer-tenancy family renters. What's the average tenant stay here, and is there a school-zone premium baked into asking?
- The area grade is low — what's the realistic commute time and amenity access for the typical tenant pool here? Any planned neighborhood developments (good or bad) we should know about?
- What's the average days-on-market for RENTAL listings here right now (not sales)? A rising rental-DOM trend means longer vacancies and softer asking-rent achievability than the comps imply.
- What's the recent tenant-quality profile in this submarket — average credit score on applications, eviction rate, late-payment / NSF rate, and stable-employment percentage? A property-management company in the area should have these aggregated.
- How much new for-sale + rental construction is in the pipeline within 1–3 miles? Heavy new supply typically softens prices + rents 12–24 months out; constrained supply supports both.
Investment metrics
- 1% rule
- 0.96% ✗
- Cap rate
- 3.91%
- Cash-on-cash
- -8.50%
- DSCR
- 0.62
- GRM
- 8.7
CMA / ARV
- ARV (median comp)
- $231,211
- List price
- $180,000
- Delta
- -22.15%
- Verdict
- UNDERPRICED
- Comps
- 20 within 1.0 mi
Show comp detail 10 sales within ~0.75 mi
| Address | Dist | Beds/Ba | Sqft | Sold | Price | $/sf | Match |
|---|---|---|---|---|---|---|---|
| 15 Braintree Cres | 0.09mi | 2/1.5 | 1,301 (+5%) | 2mo | $230,000 | $177 | 86 |
| 6 Braintree Cres | 0.04mi | 3/2.0 (+1) | 1,294 (+4%) | 12mo | $295,000 | $228 | 74 |
| 8 Braintree Cres | 0.03mi | 2/2.0 | 1,294 (+4%) | 22mo | $222,001 | $172 | 71 |
| 29 Rockhurst Dr | 0.16mi | 3/1.5 (+1) | 1,320 (+6%) | 10mo | $220,000 | $167 | 68 |
| 14 Braintree Cres | 0.07mi | 3/2.0 (+1) | 1,396 (+13%) | 3mo | $300,000 | $215 | 67 |
| 6 Talbot Dr | 0.11mi | 2/2.5 | 1,424 (+15%) | 1mo | $158,000 | $111 | 65 |
| 12 Rockhurst Dr | 0.19mi | 2/2.0 | 1,119 (-10%) | 10mo | $300,000 | $268 | 65 |
| 80 Blue Ridge Rd | 0.03mi | 2/2.0 | 1,119 (-10%) | 19mo | $265,000 | $237 | 64 |
| 10 Braintree Cres | 0.06mi | 2/1.5 | 1,396 (+13%) | 23mo | $180,100 | $129 | 57 |
| 25 Rockhurst Dr | 0.19mi | 2/2.0 | 1,119 (-10%) | 24mo | $201,000 | $180 | 53 |
Match score weights: distance 35% · size 25% · config 20% · recency 20%. Top-matched comps best support the ARV.
Projected returns pro-forma
-3.0% appreciation · 3.0% rent growth · sell at horizon
- IRR
- -31.0%
- Equity multiple
- -0.02×
- Total profit
- $-51,579
- Equity at exit
- $26,839
- IRR
- -32.7%
- Equity multiple
- -0.45×
- Total profit
- $-72,878
- Equity at exit
- $15,563
Cash invested: $50,400 (down + closing). Projections, not guarantees.
Landlord ↔ Tenant lean methodology
- Overall (STATE)
- 15 Strongly Tenant-Friendly
- State New York
- 15 Strongly Tenant-Friendly · D+10
- County
- — inherits STATE
- City
- — inherits STATE
ZIP-level market 14526
- Active inventory
- 113
- Price-to-rent
- 8.7×
Monthly cashflow live
- Estimated rent
- $1,732 medium interval (Pro) →
- Mortgage (P&I)
- −$944
- Tax from tax record
- −$379 /mo · $4,542/yr
- Insurance
- −$75
- HOA
- −$328
- Vacancy / Maint / Mgmt
- −$364
- Net cashflow
- $-357
Break-even live
UW: 25.0% down · 7.5% · 30yr · 1.5% tax · 5.0% vac · 8.0% maint · 8.0% mgmt
Financing live
Cash to close
- Down payment
- $45,000
- Closing costs
- $5,400
- Reserves months
- —
- Total cash needed
- —
Loan-product check · same deal, 3 products live
Conventional
25% down · 7.5% · 30yr
- Down + closing
- —
- Monthly P&I
- —
- Monthly cashflow
- —
- DSCR
- —
- Eligible?
- —
Personal DTI + credit; lowest rate.
DSCR
20% down · 8.5% · 30yr
- Down + closing
- —
- Monthly P&I
- —
- Monthly cashflow
- —
- DSCR
- —
- Eligible?
- —
No personal income docs; deal must DSCR.
Hard money
10% down · 12.0% · 12mo
- Down + closing
- —
- Monthly P&I
- —
- Monthly cashflow
- —
- DSCR
- —
- Eligible?
- —
Short-term bridge; refi at stabilization.
Rent comps 1 comps
| Address | Beds | Baths | Sqft | Rent | $/sqft | DOM | Units | Dist |
|---|---|---|---|---|---|---|---|---|
| 1700 Empire Blvd Webster, NY | 1.0–2.0 | 1.0 | 792 | $1,620 | $2.04 | 2d | 13 | 1.36mi |
HOA detail
- Monthly dues
- $328 · $3,936/yr
- Likely covers
- gas
Listing history 4 events
-
2026-05-05status Pending 1224-char remark
-
2026-04-28$180,000 Active 1224-char remark
-
2006-04-11soldstatus $96,900
-
2000-04-03soldstatus $65,900
ⓘ Source: listings_history table (triggers on properties + properties_extension) + one-shot
backfill from property_details.listing_events for pre-trigger history.
Tax reassessment forecast NY · Partial reset (capped growth)
- Current annual tax
- $4,542 · $379/mo
- Projected year-2 tax
- $4,542 · $379/mo
- Expected delta
- $0/yr ($0/mo · 0.0%)
ⓘ Screening estimate from a state-policy table — verify with the county assessor before closing.
Climate risk First Street
- Flood 1/10 Low FEMA zone X (unshaded) · 0% chance over 30 yrs
- Wildfire 2/10 Low
- Heat 2/10 Low 7 d/yr ≥95°F today · 16 d/yr by 30 yrs out
- Wind 1/10 Low
- Air quality 2/10 Low 1 unhealthy d/yr today · 2 by 30 yrs out
Nearby sold comps map
Loading sold comps map…
Walkable amenities ~0.75 mi
Loading nearby amenities…
Taxation est. · year 1
- Rental income
- $20,788
- − Mortgage interest
- −$10,083
- − Property taxes
- −$4,542
- − Insurance
- −$900
- − Repairs & maintenance
- −$1,663
- − Management
- −$1,663
- − HOA
- −$3,936
- − Depreciation
- −$5,236
- Taxable loss
- −$7,236
- Est. tax savings @ 24.0%
- +$1,737
- After-tax cash flow
- $-2,547/yr
For passive investors: Depreciation is non-cash, so a rental often shows a tax loss while cash-flowing — sheltering income. Rental losses are passive: they offset passive income freely, and up to $25,000/yr can offset ordinary (W-2) income if you actively participate and your MAGI is under $100k (phasing out to $0 by $150k); unused losses carry forward. On sale, claimed depreciation is recaptured at up to 25%, and gains may owe capital-gains tax (a 1031 exchange can defer both). Figures are a year-1 estimate at your 24.0% rate — not tax advice; consult a CPA.
Schools (NCES district)
- District
- Webster Central School District
- NCES district ID
- 3630360
- Math proficiency
- 62% ▼ -3.00%
- Reading proficiency
- 63% ▲ 6.00%
- Median HH income
- $71,221
- Composite
- 55.18/100
- National rank
- #1273
- State rank
- #184 of 590 in NY
Livability — Irondequoit
- Score
- 81/100
- State rank
- #92
- US rank
- #1414
Category grades
Schools grade is shown separately in the Schools card above.
Census & demographics
- County
- Monroe County · 674,131 people
- City population
- 74,252
- Metro
- Rochester, NY
- Population (ZIP)
- 19,629
- Household income
- $118,777
- Rent vs Own
- Severe rent burden
- 234.0
Population outlook (Monroe County) Hauer SSP2
- Today (2025)
- 759,460 people
- By 2030
- 757,154 · -0.3%
- By 2040
- 740,644 · -2.5%
- By 2050
- 714,443 · -5.9%
- By 2075
- 645,883 · -15.0%
- By 2100
- 547,084 · -28.0%
Race, ethnicity, and origin ACS 2023
- Neighborhood character
- Predominantly White (87%)
- Race & ethnicity
- White 87% Two or more races 7% Hispanic / Latino 5% Asian 2%
- Hispanic origin (detail)
- Puerto Rican 1% Cuban 1%
- Common ancestry
- Romanian 5% Slovak 4% Italian 2%
- Foreign-born
- 8% · Canada, China, Dominican Republic
- Languages at home
- 93% English-only · Other Indo-European 2% Spanish 2% Russian/Polish/Slavic 1%
Political lean MEDSL · Monroe
- 2024 margin
- D (+19.1) · D 59.5% · R 40.5%
- 2008→2024 swing
- +1.4pp toward D · 2008: 17.7pp · 2024: 19.1pp
- All cycles
- 2024: D+19.1 2020: D+21.0 2016: D+14.1 2012: D+17.4 2008: D+17.7
Not yet ingested
- Civics
- —
Market trends
- HPI YoY
- ▼ -149.19%
- Current HPI
- 271.8476
- Rent YoY
- —
- Metro
- Rochester, NY
- State GDP YoY
- ▲ 2.60%
- F500 in state
- 92
Industry mix (Fortune 500 HQ in NY)
| Industry | F500 HQs | Revenue |
|---|---|---|
| Financial Services | 10 | $950B |
|
||
| Consumer Goods | 9 | $162B |
|
||
| Insurance | 4 | $225B |
|
||
| Telecommunications | 2 | $144B |
|
||
| Pharmaceuticals | 2 | $112B |
|
||
| Media / Entertainment | 2 | $69B |
|
||
Price history
+173.1% since first listed4 events — show timeline
- 2026-05-05 Pending — UNYREIS
- 2026-04-28 Listed $180,000 UNYREIS
- 2006-04-11 Sold (Public Records) $96,900 Public Records
- 2000-04-03 Sold (Public Records) $65,900 Public Records
Property tax history
+4.5%/yrLatest (2025): $4,542 · +7.6% YoY. Source: county tax records.
Cash-flow waterfall
monthlySold comps — $/sqft
last 12 mo · ≤1 miLoading sold comps…