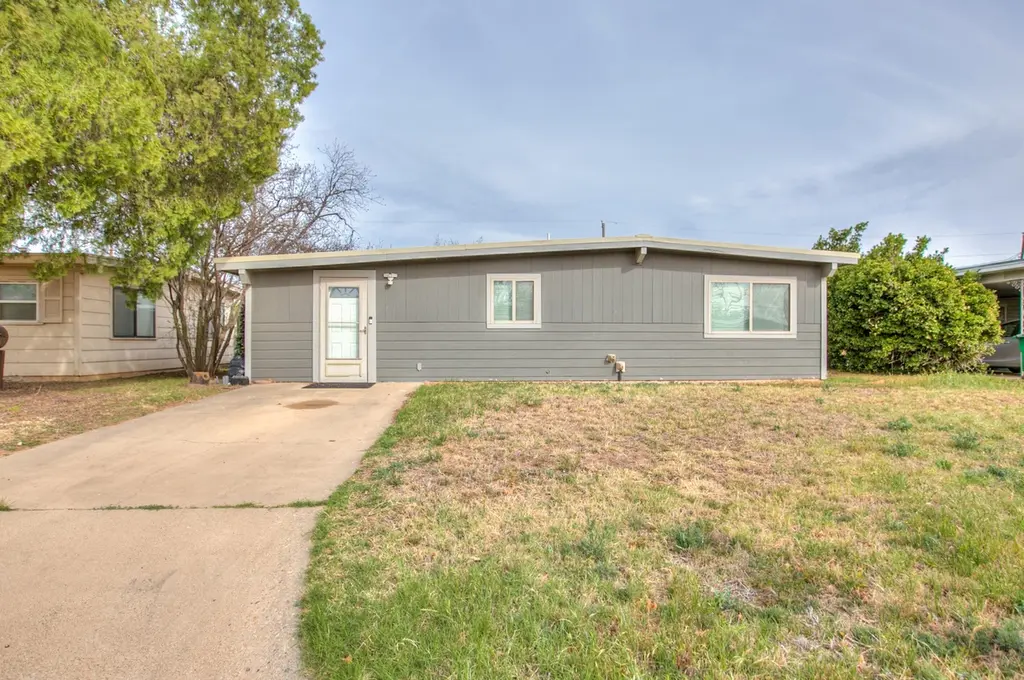
2116 Chapman St · San Angelo, TX
Flood risk 1/10 · Minimal
- FEMA flood zone
- X (unshaded)
- Chance of flooding over 30 yrs
- 0.0%
- Est. flood insurance / yr
- $507 – $1,088
Fire risk 7/10 · Major
- Est. fire insurance / yr
- $1,222 – $2,270
Heat risk 7/10 · Major
- Hot days now (above 104°F)
- 7 days/yr
- Hot days in 30 yrs
- 23 days/yr
Wind risk 4/10 · Minor
- Chance of severe wind over 30 yrs
- 16.0%
Air-quality risk 1/10 · Minimal
- Unhealthy air days now
- 0 days/yr
- Unhealthy air days in 30 yrs
- 0 days/yr
Risk factors via First Street. Map © Google.
Why this score? — see what drove the D+ grade
The composite is a weighted blend of 9 inputs, each scored 0–100. Each bar is that input's sub-score; the figure is the points it added to the 100-point composite (weight × sub-score).
- Cash flow +14.3/30.0
- Appreciation +10.0/10.0
- DSCR +4.4/10.0
- 1% rule +4.3/10.0
- Rent growth +3.9/5.0
- Livability +3.7/5.0
- Schools +2.6/10.0
- Condition / age +2.5/5.0
- ARV discount +1.7/15.0
$189,000
🖨 Deal sheet 📄 Offer letter ✓ Due diligence
Listing remarks
4 Bedroom, 2 Bathroom, 1894 sq. ft. The HVAC system was completely replaced in 2018 The hot water heater was replaced in 2018 The exterior siding was replaced in 2018 All Windows were replaced with double pane windows in 2018 The metal roof was replaced in 2020 The breaker panel was replaced and brought up to code in 2023 Both bathrooms were completely remodeled with new fixtures (including new shower), counters, appliances, and tile floors in 2023 New gas stove and oven/air fryer installed in 2023 New carpet in 2023 Full interior and exterior paint job in 2023
Key facts
- Bathrooms remodeled
- Hvac system replaced
- Double pane windows
Tags
Property features AI
Exterior
- Utilities: Public water; Public sewer
- Home design: Single-family residence; One story; Updated/Remodeled
- Construction: Slab foundation
- Exterior features: Interior lot; Paved city street frontage; Publicly maintained road
Interior
- Bedrooms: 8 total rooms (includes bedrooms and living spaces)
- Flooring: Carpet
- Bathrooms: 2 full bathrooms
- Heating & cooling: Central heating (natural gas); Central electric cooling
- Interior features: Gas water heater; Storage
Neighborhood map
What this means for you Summary
Snapshot
- This is a 4-bed/2.0-bath single-family listed at $189k.
Deal economics
- At list price, monthly cash flow is $35 ($422/yr) — positive.
- The deal already cash-flows at list — no discount required.
- To meet the 1% rule (rent ≥ 1% of price), the offer needs to be $175k (7.3% below list).
- Recommended offer: $175k (7.3% below list) — sets the bar for 1% rule.
- Cap rate 6.5% vs local median 3.8% in San Angelo — top-decile yield for the area; either an underpriced asset or a hidden risk that comps aren't pricing in. Stress-test before assuming the spread holds.
Location & tenants
- Location reads 73/100 on livability (#199 in TX) — a middle-class / working-renter tenant base. Strengths: cost of living A+, housing A+, health & safety A+; Watch: employment C-, amenities F, commute F.
- San Angelo ISD (urban): math 27% / reading 33% proficiency, ranked #627 of 826 in TX (top 76%) — families likely to look elsewhere, expect single-tenant / working-renter base with shorter leases.
- Zoned schools: Fannin El (math 27% / reading 12%, grade F, #3,583 of 4,322 statewide, top 86%, 306 students, 92% FRL); Lincoln Middle (math 19% / reading 23%, grade F, #1,387 of 1,662 statewide, top 85%, 844 students, 78% FRL); Lake View H S (math 6% / reading 22%, grade F, #1,527 of 1,632 statewide, top 94%, 1,085 students, 64% FRL) — zoned schools average 78% FRL vs 53% district-wide (26 pts higher); higher-poverty schools than district average — tighter screening recommended.
- Market conditions: Rents rising fast (+5.8%/yr); 331 active listings in the ZIP; 15 comparable units currently listed for rent nearby; rentals lingering (median 44d on market — plan ~5-8 weeks vacancy on turnover, expect pricing pressure); 73% of comp listings sitting > 30 days — soft ceiling on asking rent; 233 units permitted in Tom Green County in 2024 (0 in 5+ unit buildings).
- This rent runs 30% of the median local income ($69k/yr) — at the standard rent-burdened threshold; future hikes will face affordability resistance.
Forward outlook
- In year one you build about $20k of equity ($1k loan paydown + $19k appreciation (10.0% local appreciation)).
- Tom Green County population projected at +35% by 2050 — long-run rental-demand tailwind backs the buy-and-hold thesis.
- At projected returns (10.0% appreciation + 5.8% rent growth), your $53k cash investment doubles in ~3 years — after that, you're playing with house money.
- By year 2, paydown + projected appreciation supports a ~$32k cash-out refi (75% LTV) — recoverable capital for the next deal without selling this one.
Negotiation context
- It's been on market 16 days — a 2% lower offer ($186k) is reasonable based on typical stale-listing flexibility.
Risks & watch-outs
- Climate carrying-cost: major wildfire risk; extreme-heat days projected 7→23/yr by 2055 (HVAC capex compounding) — expect insurance premiums to compound above CPI over the hold.
Questions for the listing agent
- Built in 1961 — when were the roof, HVAC, electrical panel, plumbing, and water heater last replaced?
- Is there a deadline driving the sale (1031 exchange, divorce, estate, relocation)? That informs how much negotiation room exists.
- Schools are F-rated, which usually means shorter tenancies and higher turnover. Who's the typical renter profile here, and what's been the actual vacancy rate?
- The area grade is low — what's the realistic commute time and amenity access for the typical tenant pool here? Any planned neighborhood developments (good or bad) we should know about?
- What's the average days-on-market for RENTAL listings here right now (not sales)? A rising rental-DOM trend means longer vacancies and softer asking-rent achievability than the comps imply.
- What's the recent tenant-quality profile in this submarket — average credit score on applications, eviction rate, late-payment / NSF rate, and stable-employment percentage? A property-management company in the area should have these aggregated.
- How much new for-sale + rental construction is in the pipeline within 1–3 miles? Heavy new supply typically softens prices + rents 12–24 months out; constrained supply supports both.
Investment metrics
- 1% rule
- 0.93% ✗
- Cap rate
- 6.52%
- Cash-on-cash
- 0.80%
- DSCR
- 1.04
- GRM
- 9.0
CMA / ARV
- ARV (median comp)
- $167,541
- List price
- $189,000
- Delta
- 18.18%
- Verdict
- OVERPRICED
- Comps
- 20 within 1.0 mi
Show comp detail 12 sales within ~0.75 mi
| Address | Dist | Beds/Ba | Sqft | Sold | Price | $/sf | Match |
|---|---|---|---|---|---|---|---|
| 2021 Field Ave | 0.08mi | 4/1.5 | 1,520 (-5%) | 10mo | $169,900 | $112 | 77 |
| 3025 Catalina Dr | 0.50mi | 3/2.0 (-1) | 1,596 (-1%) | 4mo | $185,000 | $116 | 67 |
| 2645 Raney St | 0.61mi | 4/2.0 | 1,604 (-0%) | 9mo | $189,000 | $118 | 64 |
| 2205 Stanton St | 0.21mi | 3/2.0 (-1) | 1,749 (+9%) | 9mo | $104,900 | $60 | 63 |
| 1817 Greenwood St | 0.32mi | 3/2.0 (-1) | 1,430 (-11%) | 3mo | $215,000 | $150 | 60 |
| 1642 Catalina Dr | 0.61mi | 3/2.0 (-1) | 1,597 (-1%) | 9mo | $210,000 | $131 | 58 |
| 2406 Glenwood Dr | 0.34mi | 4/2.0 | 1,391 (-13%) | 6mo | $199,000 | $143 | 56 |
| 1723 Junius St | 0.65mi | 3/2.0 (-1) | 1,553 (-3%) | 10mo | $230,000 | $148 | 51 |
| 1716 Edmund Blvd | 0.44mi | 3/2.0 (-1) | 1,404 (-13%) | 8mo | $245,000 | $175 | 47 |
| 1809 N Harrison St | 0.46mi | 3/2.0 (-1) | 1,386 (-14%) | 9mo | $215,000 | $155 | 43 |
| 1626 Catalina Dr | 0.58mi | 4/2.0 | 1,838 (+14%) | 10mo | $229,900 | $125 | 41 |
| 2259 Woodlawn Dr | 0.73mi | 3/2.0 (-1) | 1,401 (-13%) | 12mo | $236,000 | $168 | 30 |
Match score weights: distance 35% · size 25% · config 20% · recency 20%. Top-matched comps best support the ARV.
Projected returns pro-forma
10.0% appreciation · 5.78% rent growth · sell at horizon
- IRR
- 25.9%
- Equity multiple
- 3.08×
- Total profit
- $110,260
- Equity at exit
- $170,266
- IRR
- 23.5%
- Equity multiple
- 7.32×
- Total profit
- $334,473
- Equity at exit
- $367,185
Cash invested: $52,920 (down + closing). Projections, not guarantees.
Landlord ↔ Tenant lean methodology
- Overall (STATE)
- 87 Strongly Landlord-Friendly
- State Texas
- 87 Strongly Landlord-Friendly · R+5
- County
- — inherits STATE
- City
- — inherits STATE
ZIP-level market 76901
- Home prices YoY
- 6.4%
- Rents YoY
- 5.8%
- Active inventory
- 331
- Price-to-rent
- 9.0×
Monthly cashflow live
- Estimated rent
- $1,751 high interval (Pro) →
- Mortgage (P&I)
- −$991
- Tax from tax record
- −$278 /mo · $3,342/yr
- Insurance
- −$79
- HOA
- −$0
- Vacancy / Maint / Mgmt
- −$368
- Net cashflow
- $35
Break-even live
UW: 25.0% down · 7.5% · 30yr · 1.5% tax · 5.0% vac · 8.0% maint · 8.0% mgmt
Financing live
Cash to close
- Down payment
- $47,250
- Closing costs
- $5,670
- Reserves months
- —
- Total cash needed
- —
Loan-product check · same deal, 3 products live
Conventional
25% down · 7.5% · 30yr
- Down + closing
- —
- Monthly P&I
- —
- Monthly cashflow
- —
- DSCR
- —
- Eligible?
- —
Personal DTI + credit; lowest rate.
DSCR
20% down · 8.5% · 30yr
- Down + closing
- —
- Monthly P&I
- —
- Monthly cashflow
- —
- DSCR
- —
- Eligible?
- —
No personal income docs; deal must DSCR.
Hard money
10% down · 12.0% · 12mo
- Down + closing
- —
- Monthly P&I
- —
- Monthly cashflow
- —
- DSCR
- —
- Eligible?
- —
Short-term bridge; refi at stabilization.
Rent comps 15 comps
| Address | Beds | Baths | Sqft | Rent | $/sqft | DOM | Units | Dist |
|---|---|---|---|---|---|---|---|---|
| 1905 Meadowbrook Dr San Angelo, TX | 3.0 | 2.0 | 1184 | $1,400 | $1.18 | 43d | 1 | 0.37mi |
| 1714 Cordell Dr San Angelo, TX | 3.0 | 2.0 | 1416 | $1,850 | $1.31 | 43d | 1 | 0.42mi |
| 2802 Field St San Angelo, TX | 3.0 | 2.0 | 1384 | $1,600 | $1.16 | 43d | 1 | 0.76mi |
| 2102 Webster St San Angelo, TX | 3.0 | 1.0 | 1233 | $1,750 | $1.42 | 43d | 1 | 0.84mi |
| 2629 Forest Park Ave San Angelo, TX | 3.0 | 2.0 | 1336 | $1,895 | $1.42 | 43d | 1 | 0.94mi |
| 1405 Hassell St San Angelo, TX | 3.0 | 2.0 | 1064 | $1,950 | $1.83 | 43d | 1 | 1.06mi |
| 810 W 19th St San Angelo, TX | 3.0 | 2.0 | 1090 | $1,249 | $1.15 | 21d | 1 | 1.13mi |
| 2425 Waco St San Angelo, TX | 4.0 | 1.0 | 1225 | $1,395 | $1.14 | 43d | 1 | 1.18mi |
| 2804 Abilene St San Angelo, TX | 3.0 | 2.0 | 1304 | $1,550 | $1.19 | 43d | 1 | 1.22mi |
| 711 N Monroe St San Angelo, TX | 3.0 | 1.0 | 1345 | $1,500 | $1.12 | 43d | 1 | 1.24mi |
| 1210 Guthrie St San Angelo, TX | 3.0 | 2.0 | 1157 | $1,400 | $1.21 | 21d | 1 | 1.24mi |
| 1835 Willow St San Angelo, TX | 3.0 | 1.0 | 1267 | $1,750 | $1.38 | 43d | 1 | 1.24mi |
| 706 W 16th St San Angelo, TX | 3.0 | 2.0 | 1298 | $1,590 | $1.22 | 21d | 1 | 1.36mi |
| 417 N Jefferson St San Angelo, TX | 4.0 | 2.0 | 1940 | $2,350 | $1.21 | 21d | 1 | 1.45mi |
| 540 W 16th St San Angelo, TX | 3.0 | 2.0 | 1090 | $1,364 | $1.25 | 43d | 1 | 1.48mi |
Listing history 14 events
-
2026-06-19days on market $189,000 Active 16 DOM
-
2026-06-18days on market $189,000 Active 15 DOM
-
2026-06-17days on market $189,000 Active 14 DOM
-
2026-06-16days on market $189,000 Active 13 DOM
-
2026-06-15days on market $189,000 Active 12 DOM
-
2026-06-14pricedays on market $189,000 Active 10 DOM
-
2026-06-13days on market $198,000 Active 9 DOM
-
2026-06-10days on market $198,000 Active 7 DOM
-
2026-06-09days on market $198,000 Active 6 DOM
-
2026-06-08days on market $198,000 Active 5 DOM
-
2026-06-07remarks 567-char remark
-
2026-06-07days on market $198,000 Active 4 DOM
-
2026-04-18price $198,000 567-char remark
-
2026-03-18$205,000 Active 567-char remark
ⓘ Source: listings_history table (triggers on properties + properties_extension) + one-shot
backfill from property_details.listing_events for pre-trigger history.
Tax reassessment forecast TX · Resets to sale price
- Current annual tax
- $3,342 · $278/mo
- Projected year-2 tax
- $3,459 · $288/mo
- Expected delta
- +$117/yr (+$10/mo · 3.5%)
ⓘ Screening estimate from a state-policy table — verify with the county assessor before closing.
Climate risk First Street
- Flood 1/10 Low FEMA zone X (unshaded) · 0% chance over 30 yrs
- Wildfire 7/10 Severe
- Heat 7/10 Severe 7 d/yr ≥104°F today · 23 d/yr by 30 yrs out
- Wind 4/10 Moderate 16% chance of damaging wind over 30 yrs
- Air quality 1/10 Low 0 unhealthy d/yr today · 0 by 30 yrs out
Nearby sold comps map
Loading sold comps map…
Walkable amenities ~0.75 mi
Loading nearby amenities…
Taxation est. · year 1
- Rental income
- $21,015
- − Mortgage interest
- −$10,587
- − Property taxes
- −$3,342
- − Insurance
- −$945
- − Repairs & maintenance
- −$1,681
- − Management
- −$1,681
- − Depreciation
- −$5,498
- Taxable loss
- −$2,719
- Est. tax savings @ 24.0%
- +$653
- After-tax cash flow
- $1,074/yr
For passive investors: Depreciation is non-cash, so a rental often shows a tax loss while cash-flowing — sheltering income. Rental losses are passive: they offset passive income freely, and up to $25,000/yr can offset ordinary (W-2) income if you actively participate and your MAGI is under $100k (phasing out to $0 by $150k); unused losses carry forward. On sale, claimed depreciation is recaptured at up to 25%, and gains may owe capital-gains tax (a 1031 exchange can defer both). Figures are a year-1 estimate at your 24.0% rate — not tax advice; consult a CPA.
Schools (NCES district)
- District
- San Angelo ISD
- NCES district ID
- 4838700
- Math proficiency
- 27% ▼ -9.00%
- Reading proficiency
- 33% ▼ -3.00%
- Median HH income
- $43,501
- Composite
- 25.56/100
- National rank
- #7427
- State rank
- #627 of 826 in TX
Livability — San Angelo
- Score
- 73/100
- State rank
- #199
- US rank
- #5030
Category grades
Schools grade is shown separately in the Schools card above.
Census & demographics
- Census place
- San Angelo, TX
- County
- Tom Green County · 113,188 people
- City population
- 81,357
- Metro
- San Angelo, TX
- Population (ZIP)
- 31,831
- Household income
- $69,450
- Rent vs Own
- Severe rent burden
- 1034.0
Population outlook (Tom Green County) Hauer SSP2
- Today (2025)
- 135,110 people
- By 2030
- 144,090 · +6.6%
- By 2040
- 162,561 · +20.3%
- By 2050
- 182,158 · +34.8%
- By 2075
- 232,274 · +71.9%
- By 2100
- 268,218 · +98.5%
Race, ethnicity, and origin ACS 2023
- Neighborhood character
- Majority White (55%)
- Race & ethnicity
- White 55% Hispanic / Latino 41% Two or more races 17% Black 2%
- Hispanic origin (detail)
- Mexican 38%
- Common ancestry
- Lithuanian 3% Slovak 3% Iranian 1%
- Foreign-born
- 5% · Canada
- Languages at home
- 77% English-only · Spanish 21% German/W. Germanic 1%
Political lean MEDSL · Tom Green
- 2024 margin
- Solid R (+48.0) · D 25.5% · R 73.5% · Other 1.0%
- 2008→2024 swing
- -6.3pp toward R · 2008: -41.7pp · 2024: -48.0pp
- All cycles
- 2024: R+48.0 2020: R+44.4 2016: R+47.9 2012: R+47.9 2008: R+41.7
Not yet ingested
- Civics
- —
Market trends
- HPI YoY
- ▲ 47.96%
- Current HPI
- 798.58
- Rent YoY
- ▲ 5.78%
- Metro
- San Angelo, TX
- State GDP YoY
- ▲ 3.95%
- F500 in state
- 110
Industry mix (Fortune 500 HQ in TX)
| Industry | F500 HQs | Revenue |
|---|---|---|
| Energy | 16 | $1,198B |
|
||
| Technology | 5 | $198B |
|
||
| Engineering / Construction | 4 | $72B |
|
||
| Energy Services | 3 | $60B |
|
||
| Utilities | 3 | $41B |
|
||
| Healthcare | 2 | $330B |
|
||
Price history
-4.5% since first listed3 events — show timeline
- 2026-06-13 Price Changed $189,000 SAAR TX
- 2026-06-03 Listed $198,000 SAAR TX
- 2026-04-18 Price Changed $198,000 SAAR TX
Property tax history
+6.0%/yrLatest (2025): $3,342 · +23.6% YoY. Source: county tax records.
Cash-flow waterfall
monthlySold comps — $/sqft
last 12 mo · ≤1 miLoading sold comps…