227 Halsey St · Dallas, TX
Flood risk 1/10 · Minimal
- FEMA flood zone
- X (unshaded)
- Chance of flooding over 30 yrs
- 0.0%
- Est. flood insurance / yr
- $507 – $1,088
Fire risk 1/10 · Minimal
- Est. fire insurance / yr
- $1,222 – $2,270
Heat risk 7/10 · Major
- Hot days now (above 110°F)
- 7 days/yr
- Hot days in 30 yrs
- 23 days/yr
Wind risk 6/10 · Moderate
- Chance of severe wind over 30 yrs
- 27.0%
Air-quality risk 2/10 · Minimal
- Unhealthy air days now
- 1 days/yr
- Unhealthy air days in 30 yrs
- 2 days/yr
Risk factors via First Street. Map © Google.
Why this score? — see what drove the C grade
The composite is a weighted blend of 9 inputs, each scored 0–100. Each bar is that input's sub-score; the figure is the points it added to the 100-point composite (weight × sub-score).
- Cash flow +18.5/30.0
- ARV discount +15.0/15.0
- 1% rule +6.4/10.0
- DSCR +5.8/10.0
- Livability +4.0/5.0
- Rent growth +3.4/5.0
- Schools +2.8/10.0
- Condition / age +2.5/5.0
- Appreciation +0.0/10.0
$199,500
🖨 Deal sheet 📄 Offer letter ✓ Due diligence
Listing remarks MLS
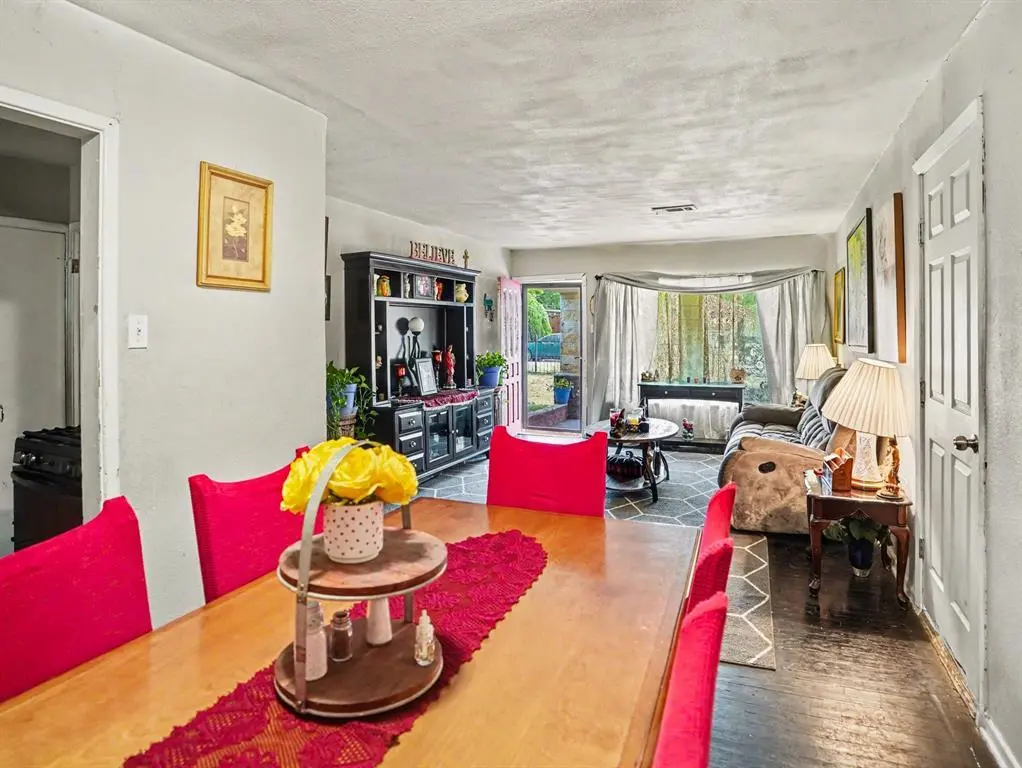
Attention investors, DIYers, and house-hackers: this 4-bedroom, 2-bathroom home in the Wynnewood neighborhood is an incredible opportunity to build immediate sweat equity. The heavy lifting on the big-ticket items is already done—the home features a newer AC Unit (2024) and a newer roof (2020). The interior is a blank canvas ready for your cosmetic updates and personal touch. A massive value-add is the attached mother-in-law suite. Whether you're looking to generate rental income to offset your mortgage or need a separate space for multi-generational living, this layout gives you options. The property sits on an oversized lot with a massive front yard and a huge backyard featuring a covered deck. You are perfectly positioned just minutes from the Bishop Arts District, Downtown Dallas, and Kiest Park.
Key facts
- Newer ac unit
- Covered deck
- Massive front yard
Tags
Neighborhood map
What this means for you Summary
Snapshot
- This is a 3-bed/1.0-bath single-family listed at $200k.
Deal economics
- At list price, monthly cash flow is $188 ($2k/yr) — positive.
- The deal already cash-flows at list — no discount required.
- Meets the 1% rule at list price ($2k rent vs $200k).
- Recommended offer: $194k (3.0% below list) — sets the bar for market timing.
- Cap rate 7.4% vs local median 2.3% in Dallas — top-decile yield for the area; either an underpriced asset or a hidden risk that comps aren't pricing in. Stress-test before assuming the spread holds.
Location & tenants
- Location reads 81/100 on livability (#24 in TX, #1,380 nationally) — a professional / high-income tenant draw. Strengths: amenities A+, commute A+, housing A+; Watch: schools C-, crime F.
- Dallas ISD (urban): math 31% / reading 36% proficiency, ranked #559 of 826 in TX (top 68%) — families likely to look elsewhere, expect single-tenant / working-renter base with shorter leases; 83% free/reduced lunch — lower-income household profile, screen leases tightly.
- Market conditions: Rents rising (+3.7%/yr); 58 active listings in the ZIP; 21 comparable units currently listed for rent nearby; rentals at typical pace (median 25d on market — plan ~3-4 weeks tenant-placement turnaround); 12,577 units permitted in Dallas County in 2024 (6,829 in 5+ unit buildings).
- At $2,271/mo this rent would consume 52% of the median local household income ($52k/yr) (locally 1594% of renters already pay >50% of income on rent) — very limited rent-growth headroom before tenants either downsize or default.
Forward outlook
- Local home prices are declining (-3.0%/yr); year-one equity from $1k of loan paydown is wiped out by about $6k of value loss. Plan a longer hold.
- Dallas County population projected at +35% by 2050 — long-run rental-demand tailwind backs the buy-and-hold thesis.
Negotiation context
- It's been on market 54 days — a 3% lower offer ($194k) is reasonable based on typical stale-listing flexibility.
- 3 sale attempts since 5y ago; this cycle's ask has dropped $26k (11%) from the opening price — seller is motivated, your offer sets the floor, not the list.
Risks & watch-outs
- Watch-outs: property tax is 2.9% of price; built in 1948 — expect roof / HVAC / electrical / plumbing capex.
- Climate carrying-cost: major wind risk, 27% chance of damaging wind over 30y; extreme-heat days projected 7→23/yr by 2055 (HVAC capex compounding) — expect insurance premiums to compound above CPI over the hold.
Questions for the listing agent
- It's been on market 54 days. Have you received any prior offers? Is the seller open to a 3% concession, seller financing, or rate buy-down credit?
- Built in 1948 — when were the roof, HVAC, electrical panel, plumbing, and water heater last replaced?
- Property tax is high relative to price — has the assessment been appealed recently, and will the sale trigger a re-assessment?
- Is there a deadline driving the sale (1031 exchange, divorce, estate, relocation)? That informs how much negotiation room exists.
- Crime grade is F in this area — have there been break-ins, vandalism, or insurance claims at this property in the last 3 years? What carrier currently insures it and at what premium?
- What's the average days-on-market for RENTAL listings here right now (not sales)? A rising rental-DOM trend means longer vacancies and softer asking-rent achievability than the comps imply.
- What's the recent tenant-quality profile in this submarket — average credit score on applications, eviction rate, late-payment / NSF rate, and stable-employment percentage? A property-management company in the area should have these aggregated.
- How much new for-sale + rental construction is in the pipeline within 1–3 miles? Heavy new supply typically softens prices + rents 12–24 months out; constrained supply supports both.
Investment metrics
- 1% rule
- 1.14% ✓
- Cap rate
- 7.43%
- Cash-on-cash
- 4.05%
- DSCR
- 1.18
- GRM
- 7.3
CMA / ARV
- ARV (median comp)
- $248,348
- List price
- $199,500
- Delta
- -19.67%
- Verdict
- UNDERPRICED
- Comps
- 20 within 1.0 mi
Show comp detail 12 sales within ~0.75 mi
| Address | Dist | Beds/Ba | Sqft | Sold | Price | $/sf | Match |
|---|---|---|---|---|---|---|---|
| 2943 Alabama Ave | 0.37mi | 4/2.0 (+1) | 1,780 (+2%) | 19mo | $335,000 | $188 | 55 |
| 2912 Grayson Dr | 0.58mi | 3/2.0 | 1,683 (-4%) | 13mo | $359,000 | $213 | 52 |
| 307 W Ohio Ave | 0.67mi | 4/2.0 (+1) | 1,752 (+0%) | 10mo | $300,000 | $171 | 51 |
| 2620 Seevers Ave | 0.49mi | 4/2.0 (+1) | 1,866 (+7%) | 8mo | $369,000 | $198 | 51 |
| 303 W Ohio Ave | 0.67mi | 4/2.0 (+1) | 1,752 (+0%) | 12mo | $327,500 | $187 | 50 |
| 3114 Ramsey Ave | 0.38mi | 4/2.0 (+1) | 1,599 (-9%) | 12mo | $299,000 | $187 | 49 |
| 706 W Saner Ave | 0.54mi | 4/2.0 (+1) | 1,668 (-5%) | 12mo | $279,900 | $168 | 48 |
| 2627 Seevers Ave | 0.46mi | 4/2.0 (+1) | 1,513 (-14%) | 6mo | $270,000 | $178 | 42 |
| 2632 Canberra St | 0.58mi | 4/2.0 (+1) | 1,892 (+8%) | 13mo | $310,000 | $164 | 39 |
| 3027 Arizona Ave | 0.44mi | 4/2.0 (+1) | 1,954 (+12%) | 19mo | $402,900 | $206 | 35 |
| 2609 Arizona Ave | 0.62mi | 4/2.0 (+1) | 1,954 (+12%) | 16mo | $379,500 | $194 | 30 |
| 2607 Alaska Ave | 0.72mi | 4/3.0 (+1) | 1,955 (+12%) | 9mo | $275,000 | $141 | 26 |
Match score weights: distance 35% · size 25% · config 20% · recency 20%. Top-matched comps best support the ARV.
Projected returns pro-forma
-3.0% appreciation · 3.71% rent growth · sell at horizon
- IRR
- -9.0%
- Equity multiple
- 0.67×
- Total profit
- $-18,525
- Equity at exit
- $29,746
- IRR
- 1.7%
- Equity multiple
- 1.12×
- Total profit
- $6,821
- Equity at exit
- $17,249
Cash invested: $55,860 (down + closing). Projections, not guarantees.
Landlord ↔ Tenant lean methodology
- Overall (STATE)
- 87 Strongly Landlord-Friendly
- State Texas
- 87 Strongly Landlord-Friendly · R+5
- County
- — inherits STATE
- City
- — inherits STATE
ZIP-level market 75224
- Rents YoY
- 3.7%
- Active inventory
- 58
- Price-to-rent
- 7.3×
Monthly cashflow live
- Estimated rent
- $2,271 high interval (Pro) →
- Mortgage (P&I)
- −$1,046
- Tax from tax record
- −$476 /mo · $5,716/yr
- Insurance
- −$83
- HOA
- −$0
- Vacancy / Maint / Mgmt
- −$477
- Net cashflow
- $188
Break-even live
UW: 25.0% down · 7.5% · 30yr · 1.5% tax · 5.0% vac · 8.0% maint · 8.0% mgmt
Financing live
Cash to close
- Down payment
- $49,875
- Closing costs
- $5,985
- Reserves months
- —
- Total cash needed
- —
Loan-product check · same deal, 3 products live
Conventional
25% down · 7.5% · 30yr
- Down + closing
- —
- Monthly P&I
- —
- Monthly cashflow
- —
- DSCR
- —
- Eligible?
- —
Personal DTI + credit; lowest rate.
DSCR
20% down · 8.5% · 30yr
- Down + closing
- —
- Monthly P&I
- —
- Monthly cashflow
- —
- DSCR
- —
- Eligible?
- —
No personal income docs; deal must DSCR.
Hard money
10% down · 12.0% · 12mo
- Down + closing
- —
- Monthly P&I
- —
- Monthly cashflow
- —
- DSCR
- —
- Eligible?
- —
Short-term bridge; refi at stabilization.
Rent comps 21 comps
| Address | Beds | Baths | Sqft | Rent | $/sqft | DOM | Units | Dist |
|---|---|---|---|---|---|---|---|---|
| 2842 S Marsalis Ave Dallas, TX | 3.0 | 3.5 | 1788 | $2,300 | $1.29 | 44d | 1 | 0.69mi |
| 2844 S Marsalis Ave Dallas, TX | 3.0 | 3.5 | 1788 | $2,300 | $1.29 | 44d | 1 | 0.69mi |
| 2830 S Marsalis Ave Dallas, TX | 4.0 | 2.0 | 1960 | $3,000 | $1.53 | 44d | 1 | 0.70mi |
| 2123 Ramsey Ave Dallas, TX | 4.0 | 2.0 | 1727 | $2,999 | $1.74 | 24d | 1 | 0.87mi |
| 2126 Ramsey Ave Dallas, TX | 4.0 | 1.5 | 1416 | $2,300 | $1.62 | 44d | 1 | 0.88mi |
| 3806 Morning Springs Trl Dallas, TX | 3.0 | 2.0 | 1512 | $2,300 | $1.52 | 19d | 1 | 0.90mi |
| 3828 Morning Springs Trl Dallas, TX | 3.0 | 2.0 | 1399 | $2,200 | $1.57 | 22d | 1 | 0.94mi |
| 2611 Fernwood Ave Dallas, TX | 3.0 | 2.0 | 1528 | $2,000 | $1.31 | 24d | 1 | 1.09mi |
| 625 W Pentagon Parkway Cir Dallas, TX | 3.0 | 2.0 | 1371 | $2,150 | $1.57 | 7d | 1 | 1.13mi |
| 3423 E Perryton Dr Dallas, TX | 2.0 | 2.0 | 1277 | $1,650 | $1.29 | 44d | 1 | 1.14mi |
| 1810 Ramsey Ave Dallas, TX | 3.0 | 2.0 | 1546 | $2,350 | $1.52 | 44d | 1 | 1.15mi |
| 1731 Seevers Ave Dallas, TX | 3.0 | 2.0 | 1980 | $2,480 | $1.25 | 44d | 1 | 1.17mi |
| 3525 Cripple Creek Dr Dallas, TX | 3.0 | 2.0 | 2056 | $2,400 | $1.17 | 4d | 1 | 1.19mi |
| 3702 Legendary Ln Dallas, TX | 1.0–3.0 | 1.0–2.0 | 990 | $1,099 | $1.11 | 3d | 6 | 1.22mi |
| 519 Heyser Dr Dallas, TX | 2.0 | 2.0 | 1300 | $2,300 | $1.77 | 24d | 1 | 1.22mi |
| 4117 S Marsalis Ave Dallas, TX | 3.0 | 2.0 | 1296 | $2,200 | $1.70 | 7d | 1 | 1.26mi |
| 621 Tarryall Dr Dallas, TX | 4.0 | 2.0 | 1756 | $2,200 | $1.25 | 7d | 1 | 1.27mi |
| 532 W Five Mile Pkwy Dallas, TX | 3.0 | 2.5 | 2115 | $3,500 | $1.65 | 7d | 1 | 1.29mi |
| 1917 S Vernon Ave Dallas, TX | 4.0 | 2.0 | 2340 | $3,199 | $1.37 | 5d | 1 | 1.31mi |
| 1510 Maywood Ave Dallas, TX | 4.0 | 2.5 | 1869 | $2,220 | $1.19 | 44d | 1 | 1.35mi |
| 1209 Grinnell St Dallas, TX | 4.0 | 2.0 | 1892 | $2,150 | $1.14 | 2d | 1 | 1.38mi |
Listing history 21 events
-
2026-06-07days on market $199,500 Active 54 DOM
-
2026-06-04days on market $199,500 Active 51 DOM
-
2026-06-03days on market $199,500 Active 50 DOM
-
2026-06-02statusdays on market $199,500 Active 49 DOM
-
2026-06-01days on market $199,500 Active Option Contract 48 DOM
-
2026-05-31days on market $199,500 Active Option Contract 47 DOM
-
2026-05-12price $199,500 826-char remark
Show marketing remark (826 chars)
Attention investors, DIYers, and house-hackers: this 4-bedroom, 2-bathroom home in the Wynnewood neighborhood is an incredible opportunity to build immediate sweat equity. The heavy lifting on the big-ticket items is already done—the home features a newer AC Unit (2024) and a newer roof (2020). The interior is a blank canvas ready for your cosmetic updates and personal touch. A massive value-add is the attached mother-in-law suite. Whether you're looking to generate rental income to offset your mortgage or need a separate space for multi-generational living, this layout gives you options. The property sits on an oversized lot with a massive front yard and a huge backyard featuring a covered deck. You are perfectly positioned just minutes from the Bishop Arts District, Downtown Dallas, and Kiest Park.
-
2026-04-28price $218,500 826-char remark
Show marketing remark (826 chars)
Attention investors, DIYers, and house-hackers: this 4-bedroom, 2-bathroom home in the Wynnewood neighborhood is an incredible opportunity to build immediate sweat equity. The heavy lifting on the big-ticket items is already done—the home features a newer AC Unit (2024) and a newer roof (2020). The interior is a blank canvas ready for your cosmetic updates and personal touch. A massive value-add is the attached mother-in-law suite. Whether you're looking to generate rental income to offset your mortgage or need a separate space for multi-generational living, this layout gives you options. The property sits on an oversized lot with a massive front yard and a huge backyard featuring a covered deck. You are perfectly positioned just minutes from the Bishop Arts District, Downtown Dallas, and Kiest Park.
-
2026-04-06$225,000 Active 826-char remark
Show marketing remark (826 chars)
Attention investors, DIYers, and house-hackers: this 4-bedroom, 2-bathroom home in the Wynnewood neighborhood is an incredible opportunity to build immediate sweat equity. The heavy lifting on the big-ticket items is already done—the home features a newer AC Unit (2024) and a newer roof (2020). The interior is a blank canvas ready for your cosmetic updates and personal touch. A massive value-add is the attached mother-in-law suite. Whether you're looking to generate rental income to offset your mortgage or need a separate space for multi-generational living, this layout gives you options. The property sits on an oversized lot with a massive front yard and a huge backyard featuring a covered deck. You are perfectly positioned just minutes from the Bishop Arts District, Downtown Dallas, and Kiest Park.
-
2026-04-01historical
-
2025-11-30price $240,000
-
2025-08-10price $260,000
-
2025-08-03price $270,000
-
2025-07-24$280,000 Active
-
2021-05-05soldstatus
-
2021-02-12price $189,000
-
2021-01-27price $199,000
-
2021-01-26$200,000 Active
-
2019-05-17soldstatus
-
1999-05-26soldstatus
-
1999-03-01soldstatus
ⓘ Source: listings_history table (triggers on properties + properties_extension) + one-shot
backfill from property_details.listing_events for pre-trigger history.
Tax reassessment forecast TX · Resets to sale price
- Current annual tax
- $5,716 · $476/mo
- Projected year-2 tax
- $5,716 · $476/mo
- Expected delta
- $0/yr ($0/mo · 0.0%)
ⓘ Screening estimate from a state-policy table — verify with the county assessor before closing.
Climate risk First Street
- Flood 1/10 Low FEMA zone X (unshaded) · 0% chance over 30 yrs
- Wildfire 1/10 Low
- Heat 7/10 Severe 7 d/yr ≥110°F today · 23 d/yr by 30 yrs out
- Wind 6/10 Major 27% chance of damaging wind over 30 yrs
- Air quality 2/10 Low 1 unhealthy d/yr today · 2 by 30 yrs out
Nearby sold comps map
Loading sold comps map…
Walkable amenities ~0.75 mi
Loading nearby amenities…
Taxation est. · year 1
- Rental income
- $27,250
- − Mortgage interest
- −$11,175
- − Property taxes
- −$5,716
- − Insurance
- −$998
- − Repairs & maintenance
- −$2,180
- − Management
- −$2,180
- − Depreciation
- −$5,804
- Taxable loss
- −$802
- Est. tax savings @ 24.0%
- +$192
- After-tax cash flow
- $2,452/yr
For passive investors: Depreciation is non-cash, so a rental often shows a tax loss while cash-flowing — sheltering income. Rental losses are passive: they offset passive income freely, and up to $25,000/yr can offset ordinary (W-2) income if you actively participate and your MAGI is under $100k (phasing out to $0 by $150k); unused losses carry forward. On sale, claimed depreciation is recaptured at up to 25%, and gains may owe capital-gains tax (a 1031 exchange can defer both). Figures are a year-1 estimate at your 24.0% rate — not tax advice; consult a CPA.
Schools (NCES district)
- District
- Dallas ISD
- NCES district ID
- 4816230
- Math proficiency
- 31% ▼ -16.00%
- Reading proficiency
- 36% ▼ -4.00%
- Median HH income
- $42,881
- Composite
- 28.41/100
- National rank
- #6763
- State rank
- #559 of 826 in TX
Livability — Dallas
- Score
- 81/100
- State rank
- #24
- US rank
- #1380
Category grades
Schools grade is shown separately in the Schools card above.
Census & demographics
- Census place
- Dallas, TX
- County
- Dallas County · 2,612,404 people
- City population
- 1,168,437
- Metro
- Dallas-Fort Worth-Arlington, TX
- Population (ZIP)
- 35,105
- Household income
- $51,919
- Rent vs Own
- Severe rent burden
- 1594.0
Population outlook (Dallas County) Hauer SSP2
- Today (2025)
- 2,979,839 people
- By 2030
- 3,191,823 · +7.1%
- By 2040
- 3,619,611 · +21.5%
- By 2050
- 4,026,915 · +35.1%
- By 2075
- 4,957,073 · +66.4%
- By 2100
- 5,508,725 · +84.9%
Race, ethnicity, and origin ACS 2023
- Neighborhood character
- Diverse neighborhood (Simpson 0.56)
- Race & ethnicity
- Hispanic / Latino 59% Black 29% Two or more races 19% White 9% Native American 1%
- Hispanic origin (detail)
- Mexican 53%
- Common ancestry
- Serbian 1% Slovak 1% Italian 1%
- Foreign-born
- 25% · Canada
- Languages at home
- 47% English-only · Spanish 51% Other Indo-European 1%
Political lean MEDSL · Dallas
- 2024 margin
- Strong D (+22.2) · D 60.2% · R 38.0% · Other 1.8%
- 2008→2024 swing
- +6.9pp toward D · 2008: 15.3pp · 2024: 22.2pp
- All cycles
- 2024: D+22.2 2020: D+31.6 2016: D+26.2 2012: D+15.4 2008: D+15.3
Not yet ingested
- Civics
- —
Market trends
- HPI YoY
- ▼ -285.86%
- Current HPI
- 328.3162
- Rent YoY
- ▲ 3.71%
- Metro
- Dallas-Fort Worth-Arlington, TX
- State GDP YoY
- ▲ 3.95%
- F500 in state
- 110
Industry mix (Fortune 500 HQ in TX)
| Industry | F500 HQs | Revenue |
|---|---|---|
| Energy | 16 | $1,198B |
|
||
| Technology | 5 | $198B |
|
||
| Engineering / Construction | 4 | $72B |
|
||
| Energy Services | 3 | $60B |
|
||
| Utilities | 3 | $41B |
|
||
| Healthcare | 2 | $330B |
|
||
Price history
-0.2% since first listed15 events — show timeline
- 2026-05-12 Price Changed $199,500 NTREIS
- 2026-04-28 Price Changed $218,500 NTREIS
- 2026-04-06 Listed $225,000 NTREIS
- 2026-04-01 Listing Removed — NTREIS
- 2025-11-30 Price Changed $240,000 NTREIS
- 2025-08-10 Price Changed $260,000 NTREIS
- 2025-08-03 Price Changed $270,000 NTREIS
- 2025-07-24 Listed $280,000 NTREIS
- 2021-05-05 Sold (Public Records) — Public Records
- 2021-02-12 Price Changed $189,000 NTREIS
- 2021-01-27 Price Changed $199,000 NTREIS
- 2021-01-26 Listed $200,000 NTREIS
- 2019-05-17 Sold (Public Records) — Public Records
- 1999-05-26 Sold (Public Records) — Public Records
- 1999-03-01 Sold (Public Records) — Public Records
Property tax history
+7.4%/yrLatest (2025): $5,716 · -0.4% YoY. Source: county tax records.
Cash-flow waterfall
monthlySold comps — $/sqft
last 12 mo · ≤1 miLoading sold comps…