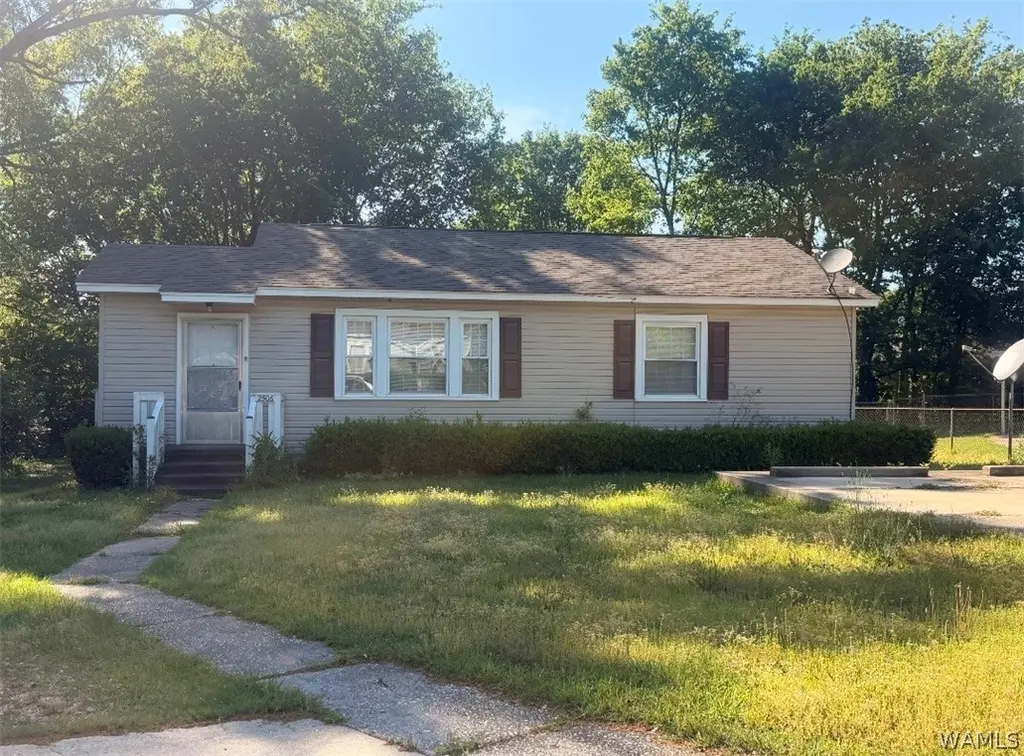
2506 4th Ave E · Tuscaloosa, AL
Flood risk 1/10 · Minimal
- FEMA flood zone
- X (unshaded)
- Chance of flooding over 30 yrs
- 0.0%
- Est. flood insurance / yr
- $507 – $1,088
Fire risk 1/10 · Minimal
- Est. fire insurance / yr
- $916 – $1,700
Heat risk 7/10 · Major
- Hot days now (above 108°F)
- 7 days/yr
- Hot days in 30 yrs
- 20 days/yr
Wind risk 6/10 · Moderate
- Chance of severe wind over 30 yrs
- 59.0%
Air-quality risk 3/10 · Minor
- Unhealthy air days now
- 2 days/yr
- Unhealthy air days in 30 yrs
- 3 days/yr
Risk factors via First Street. Map © Google.
Why this score? — see what drove the C+ grade
The composite is a weighted blend of 9 inputs, each scored 0–100. Each bar is that input's sub-score; the figure is the points it added to the 100-point composite (weight × sub-score).
- Cash flow +22.4/30.0
- ARV discount +13.6/15.0
- DSCR +7.2/10.0
- 1% rule +4.8/10.0
- Rent growth +4.1/5.0
- Livability +3.9/5.0
- Schools +2.5/10.0
- Condition / age +2.5/5.0
- Appreciation +0.0/10.0
$131,500
🖨 Deal sheet 📄 Offer letter ✓ Due diligence
Listing remarks
Sold Before Published
Key facts
- 6,534 sq ft lot
- Built 1947
Neighborhood map
What this means for you Summary
Snapshot
- This is a 2-bed/2.0-bath single-family listed at $132k.
Deal economics
- At list price, monthly cash flow is $219 ($3k/yr) — positive.
- The deal already cash-flows at list — no discount required.
- To meet the 1% rule (rent ≥ 1% of price), the offer needs to be $129k (2.0% below list).
- Recommended offer: $129k (2.0% below list) — sets the bar for 1% rule.
- Cap rate 8.3% vs local median 3.4% in Tuscaloosa — top-decile yield for the area; either an underpriced asset or a hidden risk that comps aren't pricing in. Stress-test before assuming the spread holds.
Location & tenants
- Location reads 77/100 on livability (#9 in AL, #2,909 nationally) — a middle-class / working-renter tenant base. Strengths: amenities A+, health & safety A+, cost of living A; Watch: crime F, employment D-.
- Tuscaloosa City (urban): math 19% / reading 40% proficiency, ranked #74 of 129 in AL (top 57%) — low school quality limits family demand, transient renter base, plan for 1-2y turnover.
- Zoned schools: University Place Elementary School (math 17% / reading 32%, grade F, #424 of 627 statewide, top 68%, 599 students, 64% FRL); Central High School (math 12% / reading 17%, grade F, #220 of 305 statewide, top 77%, 783 students, 84% FRL) — zoned schools average 74% FRL vs 59% district-wide (15 pts higher); higher-poverty schools than district average — tighter screening recommended.
- Market conditions: Rents rising fast (+6.3%/yr); 306 active listings in the ZIP; 19 comparable units currently listed for rent nearby; rentals lingering (median 44d on market — plan ~5-8 weeks vacancy on turnover, expect pricing pressure); 68% of comp listings sitting > 30 days — soft ceiling on asking rent; lower-income renter base — watch delinquency; 622 units permitted in Tuscaloosa County in 2024 (69 in 5+ unit buildings).
- At $1,288/mo this rent would consume 53% of the median local household income ($29k/yr) (locally 3997% of renters already pay >50% of income on rent) — very limited rent-growth headroom before tenants either downsize or default.
Forward outlook
- Local home prices are declining (-3.0%/yr); year-one equity from $909 of loan paydown is wiped out by about $4k of value loss. Plan a longer hold.
- Tuscaloosa County population projected at +26% by 2050 — long-run rental-demand tailwind backs the buy-and-hold thesis.
- At projected returns (-3.0% appreciation + 6.3% rent growth), your $37k cash investment doubles in ~10 years — after that, you're playing with house money.
Negotiation context
- Only 0 days on market — expect competitive offers; lowballing is unlikely to land.
Risks & watch-outs
- Watch-outs: built in 1947 — expect roof / HVAC / electrical / plumbing capex.
- Climate carrying-cost: major wind risk, 59% chance of damaging wind over 30y; extreme-heat days projected 7→20/yr by 2055 (HVAC capex compounding) — expect insurance premiums to compound above CPI over the hold.
Questions for the listing agent
- Built in 1947 — when were the roof, HVAC, electrical panel, plumbing, and water heater last replaced?
- Is there a deadline driving the sale (1031 exchange, divorce, estate, relocation)? That informs how much negotiation room exists.
- Crime grade is F in this area — have there been break-ins, vandalism, or insurance claims at this property in the last 3 years? What carrier currently insures it and at what premium?
- What's the average days-on-market for RENTAL listings here right now (not sales)? A rising rental-DOM trend means longer vacancies and softer asking-rent achievability than the comps imply.
- What's the recent tenant-quality profile in this submarket — average credit score on applications, eviction rate, late-payment / NSF rate, and stable-employment percentage? A property-management company in the area should have these aggregated.
- How much new for-sale + rental construction is in the pipeline within 1–3 miles? Heavy new supply typically softens prices + rents 12–24 months out; constrained supply supports both.
Investment metrics
- 1% rule
- 0.98% ✗
- Cap rate
- 8.29%
- Cash-on-cash
- 7.14%
- DSCR
- 1.32
- GRM
- 8.5
CMA / ARV
- ARV (on-the-fly)
- $152,304
- Comps found
- 10
Show comp detail 10 sales within ~0.75 mi
| Address | Dist | Beds/Ba | Sqft | Sold | Price | $/sf | Match |
|---|---|---|---|---|---|---|---|
| 2506 4th Ave E | 0.00mi | 2/2.0 | 912 (0%) | 1mo | $131,500 | $144 | 99 |
| 405 26th St St E | 0.04mi | 2/1.0 | 912 (0%) | 9mo | $115,000 | $126 | 87 |
| 10 Arlington Dr | 0.07mi | 2/1.0 | 916 (+0%) | 9mo | $155,000 | $169 | 84 |
| 304 Orange St | 0.17mi | 2/1.0 | 928 (+2%) | 4mo | $75,000 | $81 | 81 |
| 2917 Narrow Lane Rd | 0.21mi | 2/1.0 | 888 (-3%) | 10mo | $160,000 | $180 | 73 |
| 301 Orange St | 0.15mi | 2/1.0 | 960 (+5%) | 13mo | $160,000 | $167 | 70 |
| 107 Orange St | 0.23mi | 2/1.0 | 850 (-7%) | 12mo | $149,900 | $176 | 64 |
| 402 26th St St E | 0.03mi | 2/1.0 | 816 (-10%) | 22mo | $135,000 | $165 | 59 |
| 6 Arlington Dr | 0.04mi | 3/1.0 (+1) | 1,036 (+14%) | 18mo | $135,000 | $130 | 51 |
| 307 19th St E | 0.52mi | 3/2.0 (+1) | 1,028 (+13%) | 22mo | $225,000 | $219 | 31 |
Match score weights: distance 35% · size 25% · config 20% · recency 20%. Top-matched comps best support the ARV.
Projected returns pro-forma
-3.0% appreciation · 6.29% rent growth · sell at horizon
- IRR
- -2.1%
- Equity multiple
- 0.92×
- Total profit
- $-2,994
- Equity at exit
- $19,607
- IRR
- 10.6%
- Equity multiple
- 1.94×
- Total profit
- $34,513
- Equity at exit
- $11,370
Cash invested: $36,820 (down + closing). Projections, not guarantees.
Landlord ↔ Tenant lean methodology
- Overall (STATE)
- 90 Strongly Landlord-Friendly
- State Alabama
- 90 Strongly Landlord-Friendly · R+15
- County
- — inherits STATE
- City
- — inherits STATE
ZIP-level market 35401
- Rents YoY
- 6.3%
- Active inventory
- 306
- Price-to-rent
- 8.5×
Monthly cashflow live
- Estimated rent
- $1,288 high interval (Pro) →
- Mortgage (P&I)
- −$690
- Tax from tax record
- −$54 /mo · $651/yr
- Insurance
- −$55
- HOA
- −$0
- Vacancy / Maint / Mgmt
- −$271
- Net cashflow
- $219
Break-even live
UW: 25.0% down · 7.5% · 30yr · 1.5% tax · 5.0% vac · 8.0% maint · 8.0% mgmt
Financing live
Cash to close
- Down payment
- $32,875
- Closing costs
- $3,945
- Reserves months
- —
- Total cash needed
- —
Loan-product check · same deal, 3 products live
Conventional
25% down · 7.5% · 30yr
- Down + closing
- —
- Monthly P&I
- —
- Monthly cashflow
- —
- DSCR
- —
- Eligible?
- —
Personal DTI + credit; lowest rate.
DSCR
20% down · 8.5% · 30yr
- Down + closing
- —
- Monthly P&I
- —
- Monthly cashflow
- —
- DSCR
- —
- Eligible?
- —
No personal income docs; deal must DSCR.
Hard money
10% down · 12.0% · 12mo
- Down + closing
- —
- Monthly P&I
- —
- Monthly cashflow
- —
- DSCR
- —
- Eligible?
- —
Short-term bridge; refi at stabilization.
Rent comps 19 comps
| Address | Beds | Baths | Sqft | Rent | $/sqft | DOM | Units | Dist |
|---|---|---|---|---|---|---|---|---|
| 2300 5th Ave E Tuscaloosa, AL | 1.0 | 1.0 | 540 | $830 | $1.54 | 44d | 1 | 0.28mi |
| 632 23rd St E Tuscaloosa, AL | 2.0 | 1.5 | 960 | $1,058 | $1.10 | 21d | 2 | 0.36mi |
| 621 E 33rd St Unit D Tuscaloosa, AL | 2.0 | 1.0 | 1000 | $925 | $0.93 | 44d | 1 | 0.57mi |
| 713 33rd St E Tuscaloosa, AL | 2.0 | 2.0 | 1036 | $815 | $0.79 | 44d | 1 | 0.60mi |
| 235 James I Harrison Jr Pkwy E Tuscaloosa, AL | 1.0–3.0 | 1.0–2.0 | 1259 | $984 | $0.78 | 44d | 37 | 0.77mi |
| 20 16th St Tuscaloosa, AL | 1.0–3.0 | 1.0–3.0 | 1320 | $2,400 | $1.82 | 44d | 4 | 0.79mi |
| 80 16th St Unit 1-8 Tuscaloosa, AL | 1.0–3.0 | 1.0–3.0 | 1320 | $2,400 | $1.82 | 44d | 4 | 0.80mi |
| 3504 12th Ave E Tuscaloosa, AL | 2.0 | 1.0–1.5 | 1019 | $1,037 | $1.02 | 44d | 10 | 0.87mi |
| 1813 Hackberry Ln Tuscaloosa, AL | 2.0 | 2.0 | 894 | $1,450 | $1.62 | 44d | 1 | 0.87mi |
| 3820 1st Ave Tuscaloosa, AL | 1.0–3.0 | 1.0–2.0 | 835 | $1,044 | $1.25 | 44d | 11 | 0.89mi |
| 1415 2nd East Ct Tuscaloosa, AL | 2.0 | 1.5 | 1033 | $2,200 | $2.13 | 44d | 1 | 0.92mi |
| 1925 8th Ave Tuscaloosa, AL | 1.0–2.0 | 1.0 | 794 | $1,054 | $1.33 | 13d | 1 | 0.99mi |
| 1800 Hargrove East Rd Tuscaloosa, AL | 2.0 | 1.0 | 950 | $875 | $0.92 | 13d | 1 | 1.05mi |
| 1805 8th Ave Tuscaloosa, AL | 1.0–2.0 | 1.0–2.0 | 1175 | $1,380 | $1.17 | 44d | 1 | 1.07mi |
| 900 Hargrove Rd Tuscaloosa, AL | 1.0–2.0 | 1.0–2.0 | 836 | $1,089 | $1.30 | 44d | 1 | 1.14mi |
| 1515 Kicker Rd Tuscaloosa, AL | 1.0–2.0 | 1.0–2.0 | 1050 | $1,025 | $0.98 | 44d | 1 | 1.36mi |
| 715 Dogwood Ln Tuscaloosa, AL | 2.0 | 1.0 | 1126 | $1,099 | $0.98 | 13d | 3 | 1.40mi |
| 1105 Skyland Blvd E Tuscaloosa, AL | 1.0 | 1.0 | 832 | $879 | $1.06 | 13d | 3 | 1.45mi |
| 30 Beverly Hts Tuscaloosa, AL | 3.0 | 2.0 | 1100 | $2,100 | $1.91 | 13d | 1 | 1.47mi |
Listing history 2 events
-
2026-04-09$131,500
-
2026-04-09historical
ⓘ Source: listings_history table (triggers on properties + properties_extension) + one-shot
backfill from property_details.listing_events for pre-trigger history.
Tax reassessment forecast AL · Resets to sale price
- Current annual tax
- $651 · $54/mo
- Projected year-2 tax
- $651 · $54/mo
- Expected delta
- $0/yr ($0/mo · 0.0%)
ⓘ Screening estimate from a state-policy table — verify with the county assessor before closing.
Climate risk First Street
- Flood 1/10 Low FEMA zone X (unshaded) · 0% chance over 30 yrs
- Wildfire 1/10 Low
- Heat 7/10 Severe 7 d/yr ≥108°F today · 20 d/yr by 30 yrs out
- Wind 6/10 Major 59% chance of damaging wind over 30 yrs
- Air quality 3/10 Moderate 2 unhealthy d/yr today · 3 by 30 yrs out
Nearby sold comps map
Loading sold comps map…
Walkable amenities ~0.75 mi
Loading nearby amenities…
Taxation est. · year 1
- Rental income
- $15,460
- − Mortgage interest
- −$7,366
- − Property taxes
- −$651
- − Insurance
- −$658
- − Repairs & maintenance
- −$1,237
- − Management
- −$1,237
- − Depreciation
- −$3,825
- Taxable income
- $487
- Est. tax owed @ 24.0%
- −$117
- After-tax cash flow
- $2,513/yr
For passive investors: Depreciation is non-cash, so a rental often shows a tax loss while cash-flowing — sheltering income. Rental losses are passive: they offset passive income freely, and up to $25,000/yr can offset ordinary (W-2) income if you actively participate and your MAGI is under $100k (phasing out to $0 by $150k); unused losses carry forward. On sale, claimed depreciation is recaptured at up to 25%, and gains may owe capital-gains tax (a 1031 exchange can defer both). Figures are a year-1 estimate at your 24.0% rate — not tax advice; consult a CPA.
Schools (NCES district)
- District
- Tuscaloosa City
- NCES district ID
- 0103360
- Math proficiency
- 19% ▼ -24.00%
- Reading proficiency
- 40% ▼ -1.00%
- Median HH income
- $37,474
- Composite
- 24.51/100
- National rank
- #7647
- State rank
- #74 of 129 in AL
Livability — Tuscaloosa
- Score
- 77/100
- State rank
- #9
- US rank
- #2909
Category grades
Schools grade is shown separately in the Schools card above.
Census & demographics
- Census place
- Tuscaloosa, AL
- County
- Tuscaloosa County · 206,491 people
- City population
- 134,228
- Metro
- Tuscaloosa, AL
- Population (ZIP)
- 43,459
- Household income
- $29,152
- Rent vs Own
- Severe rent burden
- 3997.0
Population outlook (Tuscaloosa County) Hauer SSP2
- Today (2025)
- 228,293 people
- By 2030
- 240,551 · +5.4%
- By 2040
- 263,856 · +15.6%
- By 2050
- 286,491 · +25.5%
- By 2075
- 335,783 · +47.1%
- By 2100
- 370,520 · +62.3%
Race, ethnicity, and origin ACS 2023
- Neighborhood character
- Diverse neighborhood (Simpson 0.58)
- Race & ethnicity
- Black 47% White 44% Hispanic / Latino 5% Two or more races 4% Asian 2%
- Common ancestry
- Slovak 2% Italian 1% Romanian 1%
- Foreign-born
- 3% · Canada, China
- Languages at home
- 96% English-only · Spanish 2% Other Indo-European 1% Chinese 1%
Political lean MEDSL · Tuscaloosa
- 2024 margin
- Strong R (+20.4) · D 39.4% · R 59.8%
- 2008→2024 swing
- -4.4pp toward R · 2008: -16.0pp · 2024: -20.4pp
- All cycles
- 2024: R+20.4 2020: R+14.8 2016: R+19.5 2012: R+17.4 2008: R+16.0
Not yet ingested
- Civics
- —
Market trends
- HPI YoY
- ▼ -191.40%
- Current HPI
- 179.8335
- Rent YoY
- ▲ 6.29%
- Metro
- Tuscaloosa, AL
- State GDP YoY
- ▲ 2.94%
- F500 in state
- 4
Industry mix (Fortune 500 HQ in AL)
| Industry | F500 HQs | Revenue |
|---|---|---|
| Financial Services | 1 | $8B |
|
||
| Healthcare | 1 | $5B |
|
||
Price history
2 events — show timeline
- 2026-04-09 Delisted — WAMLS
- 2026-04-09 Listed $131,500 WAMLS
Property tax history
+7.9%/yrLatest (2025): $651 · +69.4% YoY. Source: county tax records.
Cash-flow waterfall
monthlySold comps — $/sqft
last 12 mo · ≤1 miLoading sold comps…