5594 Fawn Ridge Dr · Midway, FL
Flood risk 1/10 · Minimal
- FEMA flood zone
- X (unshaded)
- Chance of flooding over 30 yrs
- 0.0%
- Est. flood insurance / yr
- $507 – $1,088
Fire risk 5/10 · Moderate
- Est. fire insurance / yr
- $947 – $1,759
Heat risk 10/10 · Severe
- Hot days now (above 105°F)
- 7 days/yr
- Hot days in 30 yrs
- 23 days/yr
Wind risk 9/10 · Severe
- Chance of severe wind over 30 yrs
- 99.0%
Air-quality risk 2/10 · Minimal
- Unhealthy air days now
- 1 days/yr
- Unhealthy air days in 30 yrs
- 1 days/yr
Risk factors via First Street. Map © Google.
Why this score? — see what drove the D- grade
The composite is a weighted blend of 9 inputs, each scored 0–100. Each bar is that input's sub-score; the figure is the points it added to the 100-point composite (weight × sub-score).
- Cash flow +12.5/30.0
- ARV discount +6.0/15.0
- Schools +5.3/10.0
- DSCR +3.7/10.0
- Rent growth +3.7/5.0
- 1% rule +2.6/10.0
- Livability +2.5/5.0
- Condition / age +2.5/5.0
- Appreciation +0.0/10.0
$310,000
🖨 Deal sheet 📄 Offer letter ✓ Due diligence
Listing remarks
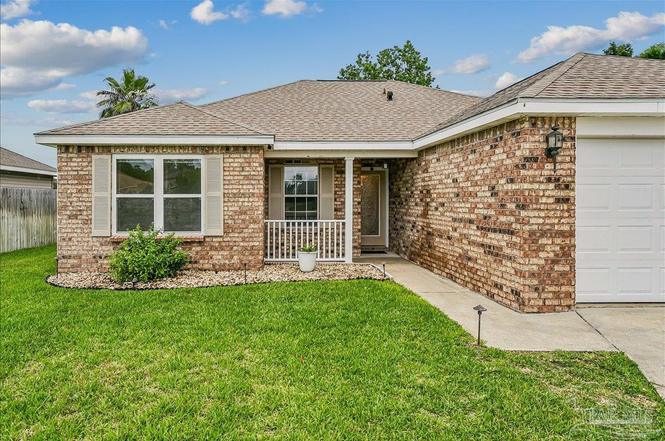
5594 Fawn Ridge Dr is a single-owner home built in 2003 featuring 3 beds, 2 full baths, and approx. 1,400 square feet w a split-bedroom floorplan. The home offers brick & vinyl exterior, covered front porch, attached garage, and a privacy-fenced backyard with an in-ground vinyl-lined swimming pool and open patio/deck area. Inside, the great room features vaulted ceilings, W/ W carpeting with an open layout connecting the kitchen and dining area. The kitchen includes white wood cabinets, laminate counters, white appliances, a pantry, stainless dbl sink, and a window overlooking the backyard and pool. The dining area is positioned between the kitchen & great room and includes a wi
Key facts
- Covered front porch
- White wood cabinets
- Open patio area
Tags
Property features AI
Finance
- HOA & community: HOA with an annual fee (includes association and management)
Exterior
- Parking: Attached 2-car garage with garage door opener; Front entrance parking; Two covered parking spaces (total 2 spaces)
- Security: Smoke detectors
- Utilities: Public water; Public sewer; Electric service with circuit breakers and copper wiring; Cable available; Underground utilities; Paved, county-maintained road access
- Home design: House (resale); One story; Property attached (yes); Shingle gable roof
- Construction: Built with frame construction; Slab foundation
- Exterior features: Sprinkler system; Back yard with privacy fencing; Patio; Front porch; In-ground vinyl pool; Located on a cul-de-sac with central access
Interior
- Kitchen: Laminate counters; Pantry; Built-in microwave; Self-cleaning oven; Gas/standard range (stove); Dishwasher; Disposal; Refrigerator
- Bedrooms: Primary bedroom on the first floor (approximately 12.5' x 14.8'); Second bedroom on the first floor (approximately 9.8' x 11.5'); Third bedroom on the first floor (approximately 9.8' x 10.5')
- Flooring: Vinyl flooring; Carpet
- Bathrooms: Two full bathrooms, all on the first floor
- Heating & cooling: Heat pump; Central heating; Central air conditioning; Ceiling fans
- Interior features: Baseboards; Ceiling fans; High-speed internet available; Plant ledges; Smart thermostat; Blinds
- Laundry & utility: Washer and dryer included; Indoor laundry with washer/dryer hookups; Electric water heater
Neighborhood map
What this means for you Summary
Snapshot
- This is a 3-bed/2.0-bath single-family listed at $310k.
Deal economics
- At list price, monthly cash flow is $-47 ($-570/yr) — negative.
- To cash-flow at today's rent, offer at most $302k (2.7% below list).
- To meet the 1% rule (rent ≥ 1% of price), the offer needs to be $234k (24.5% below list).
- Recommended offer: $234k (24.5% below list) — sets the bar for 1% rule.
- Cap rate 6.1% vs local median 4.1% in Midway — top-decile yield for the area; either an underpriced asset or a hidden risk that comps aren't pricing in. Stress-test before assuming the spread holds.
Location & tenants
- Location reads: area grade D — affects rentability + tenant quality, not the cash-flow math above.
- Santa Rosa (suburban): math 63% / reading 60% proficiency, ranked #8 of 73 in FL (top 11%) — acceptable for families but not a draw, mixed tenant base, ~2y average lease.
- Market conditions: Rents rising fast (+4.6%/yr); 453 active listings in the ZIP; 13 comparable units currently listed for rent nearby; rentals at typical pace (median 21d on market — plan ~3-4 weeks tenant-placement turnaround); solid renter incomes; 1,983 units permitted in Santa Rosa County in 2024 (128 in 5+ unit buildings).
Forward outlook
- Local home prices are declining (-3.0%/yr); year-one equity from $2k of loan paydown is wiped out by about $9k of value loss. Plan a longer hold.
- Santa Rosa County population projected at +31% by 2050 — long-run rental-demand tailwind backs the buy-and-hold thesis.
Negotiation context
- It's been on market 30 days — a 2% lower offer ($305k) is reasonable based on typical stale-listing flexibility.
Risks & watch-outs
- Climate carrying-cost: severe wind risk, 99% chance of damaging wind over 30y; moderate wildfire risk; extreme-heat days projected 7→23/yr by 2055 (HVAC capex compounding) — expect insurance premiums to compound above CPI over the hold.
Questions for the listing agent
- What do current leases actually rent for vs. the listed asking? Can we see a recent rent roll and the last 12 months of T-12 income?
- What does the HOA fee cover, when was the last increase, and are there any pending special assessments or reserve-fund shortfalls?
- Is there a deadline driving the sale (1031 exchange, divorce, estate, relocation)? That informs how much negotiation room exists.
- The area grade is low — what's the realistic commute time and amenity access for the typical tenant pool here? Any planned neighborhood developments (good or bad) we should know about?
- What's the average days-on-market for RENTAL listings here right now (not sales)? A rising rental-DOM trend means longer vacancies and softer asking-rent achievability than the comps imply.
- What's the recent tenant-quality profile in this submarket — average credit score on applications, eviction rate, late-payment / NSF rate, and stable-employment percentage? A property-management company in the area should have these aggregated.
- How much new for-sale + rental construction is in the pipeline within 1–3 miles? Heavy new supply typically softens prices + rents 12–24 months out; constrained supply supports both.
Investment metrics
- 1% rule
- 0.76% ✗
- Cap rate
- 6.11%
- Cash-on-cash
- -0.66%
- DSCR
- 0.97
- GRM
- 11.0
CMA / ARV
- ARV (on-the-fly)
- $299,814
- Comps found
- 12
Show comp detail 12 sales within ~0.75 mi
| Address | Dist | Beds/Ba | Sqft | Sold | Price | $/sf | Match |
|---|---|---|---|---|---|---|---|
| 5594 Fawn Ridge Dr | 0.00mi | 3/2.0 | 1,401 (0%) | 0mo | $300,000 | $214 | 100 |
| 5566 Meadow Creek Pl | 0.12mi | 3/2.0 | 1,257 (-10%) | 1mo | $280,000 | $223 | 77 |
| 5561 Fawn Ridge Dr | 0.07mi | 3/2.0 | 1,566 (+12%) | 1mo | $315,000 | $201 | 76 |
| 5813 Congress Ct | 0.51mi | 3/2.0 | 1,392 (-1%) | 0mo | $336,000 | $241 | 75 |
| 2078 Shadow Lake Dr | 0.41mi | 3/2.0 | 1,345 (-4%) | 1mo | $330,000 | $245 | 74 |
| 1980 Crosscreek Cir | 0.25mi | 3/2.0 | 1,281 (-9%) | 1mo | $300,000 | $234 | 73 |
| 5407 Maverick Ln | 0.53mi | 3/2.0 | 1,450 (+4%) | 1mo | $315,000 | $217 | 69 |
| 2026 Church St | 0.35mi | 3/2.0 | 1,271 (-9%) | 1mo | $255,000 | $201 | 67 |
| 1944 Guseman Rd | 0.30mi | 3/2.0 | 1,539 (+10%) | 6mo | $310,000 | $201 | 64 |
| 1982 Pentagon St | 0.24mi | 3/2.0 | 1,208 (-14%) | 6mo | $252,000 | $209 | 61 |
| 5648 United Ct | 0.40mi | 3/2.0 | 1,220 (-13%) | 2mo | $261,000 | $214 | 58 |
| 5600 Brentwater Pl | 0.38mi | 3/2.0 | 1,200 (-14%) | 1mo | $244,900 | $204 | 57 |
Match score weights: distance 35% · size 25% · config 20% · recency 20%. Top-matched comps best support the ARV.
Projected returns pro-forma
-3.0% appreciation · 4.6% rent growth · sell at horizon
- IRR
- -15.9%
- Equity multiple
- 0.43×
- Total profit
- $-49,544
- Equity at exit
- $46,222
- IRR
- -5.2%
- Equity multiple
- 0.64×
- Total profit
- $-31,272
- Equity at exit
- $26,803
Cash invested: $86,800 (down + closing). Projections, not guarantees.
Landlord ↔ Tenant lean methodology
- Overall (STATE)
- 87 Strongly Landlord-Friendly
- State Florida
- 87 Strongly Landlord-Friendly · R+3
- County
- — inherits STATE
- City
- — inherits STATE
ZIP-level market 32563
- Rents YoY
- 4.6%
- Active inventory
- 453
- Price-to-rent
- 11.0×
Monthly cashflow live
- Estimated rent
- $2,341 high interval (Pro) →
- Mortgage (P&I)
- −$1,626
- Tax from tax record
- −$116 /mo · $1,394/yr
- Insurance
- −$129
- HOA
- −$26
- Vacancy / Maint / Mgmt
- −$492
- Net cashflow
- $-47
Break-even live
UW: 25.0% down · 7.5% · 30yr · 1.5% tax · 5.0% vac · 8.0% maint · 8.0% mgmt
Financing live
Cash to close
- Down payment
- $77,500
- Closing costs
- $9,300
- Reserves months
- —
- Total cash needed
- —
Loan-product check · same deal, 3 products live
Conventional
25% down · 7.5% · 30yr
- Down + closing
- —
- Monthly P&I
- —
- Monthly cashflow
- —
- DSCR
- —
- Eligible?
- —
Personal DTI + credit; lowest rate.
DSCR
20% down · 8.5% · 30yr
- Down + closing
- —
- Monthly P&I
- —
- Monthly cashflow
- —
- DSCR
- —
- Eligible?
- —
No personal income docs; deal must DSCR.
Hard money
10% down · 12.0% · 12mo
- Down + closing
- —
- Monthly P&I
- —
- Monthly cashflow
- —
- DSCR
- —
- Eligible?
- —
Short-term bridge; refi at stabilization.
Rent comps 13 comps
| Address | Beds | Baths | Sqft | Rent | $/sqft | DOM | Units | Dist |
|---|---|---|---|---|---|---|---|---|
| 1889 Natures Way Gulf Breeze, FL | 3.0 | 2.0 | 1699 | $2,850 | $1.68 | 23d | 1 | 0.12mi |
| 1712 Bay Pine Cir Gulf Breeze, FL | 4.0 | 2.0 | 1783 | $2,150 | $1.21 | 23d | 1 | 0.47mi |
| 5723 Sandy Walk St Gulf Breeze, FL | 3.0 | 2.5 | 1537 | $1,890 | $1.23 | 14d | 1 | 0.52mi |
| 5723 Sandy Walk St Gulf Breeze, FL | 3.0 | 2.5 | 1537 | $1,890 | $1.23 | 23d | 1 | 0.52mi |
| 5673 Stellarjay St Gulf Breeze, FL | 3.0 | 2.5 | 1537 | $1,950 | $1.27 | 21d | 1 | 0.56mi |
| 5359 Maverick Ln Gulf Breeze, FL | 3.0 | 2.0 | 1350 | $2,200 | $1.63 | 14d | 1 | 0.57mi |
| 1651 Ponderosa Dr Gulf Breeze, FL | 3.0 | 2.0 | 1605 | $2,450 | $1.53 | 14d | 1 | 0.74mi |
| 1651 Ponderosa Dr Gulf Breeze, FL | 3.0 | 2.0 | 1605 | $2,450 | $1.53 | 21d | 1 | 0.74mi |
| 1861 Teal Cir Gulf Breeze, FL | 3.0 | 2.5 | 1537 | $1,950 | $1.27 | 14d | 5 | 0.89mi |
| 1643 Amarillo Trl Gulf Breeze, FL | 3.0 | 2.0 | 1462 | $1,995 | $1.36 | 23d | 1 | 0.97mi |
| 1786 Kell Rd Gulf Breeze, FL | 3.0 | 2.0 | 1342 | $1,750 | $1.30 | 14d | 1 | 1.15mi |
| 5410 Spruce St Gulf Breeze, FL | 3.0 | 2.0 | 1653 | $2,000 | $1.21 | 23d | 1 | 1.19mi |
| 5410 Spruce St Gulf Breeze, FL | 3.0 | 2.0 | 1653 | $2,000 | $1.21 | 14d | 1 | 1.19mi |
HOA detail
- Monthly dues
- $26 · $312/yr
- Likely covers
- pool
Listing history 14 events
-
2026-06-15statusdays on market $310,000 Pending 30 DOM
-
2026-06-14days on market $310,000 Contingent 29 DOM
-
2026-06-10days on market $310,000 Contingent 26 DOM
-
2026-06-09days on market $310,000 Contingent 25 DOM
-
2026-06-08days on market $310,000 Contingent 24 DOM
-
2026-06-07days on market $310,000 Contingent 23 DOM
-
2026-06-05days on market $310,000 Contingent 20 DOM
-
2026-06-03days on market $310,000 Contingent 19 DOM
-
2026-06-02days on market $310,000 Contingent 18 DOM
-
2026-06-01days on market $310,000 Contingent 17 DOM
-
2026-05-31days on market $310,000 Contingent 16 DOM
-
2026-05-31days on market $310,000 Contingent 15 DOM
-
2026-05-21historical Contingent
-
2026-05-15$310,000 Active
ⓘ Source: listings_history table (triggers on properties + properties_extension) + one-shot
backfill from property_details.listing_events for pre-trigger history.
Tax reassessment forecast FL · Resets to sale price
- Current annual tax
- $1,394 · $116/mo
- Projected year-2 tax
- $2,573 · $214/mo
- Expected delta
- +$1,179/yr (+$98/mo · 84.6%)
ⓘ Screening estimate from a state-policy table — verify with the county assessor before closing.
Climate risk First Street
- Flood 1/10 Low FEMA zone X (unshaded) · 0% chance over 30 yrs
- Wildfire 5/10 Major
- Heat 10/10 Extreme 7 d/yr ≥105°F today · 23 d/yr by 30 yrs out
- Wind 9/10 Extreme 99% chance of damaging wind over 30 yrs
- Air quality 2/10 Low 1 unhealthy d/yr today · 1 by 30 yrs out
Nearby sold comps map
Loading sold comps map…
Walkable amenities ~0.75 mi
Loading nearby amenities…
Taxation est. · year 1
- Rental income
- $28,094
- − Mortgage interest
- −$17,365
- − Property taxes
- −$1,394
- − Insurance
- −$1,550
- − Repairs & maintenance
- −$2,248
- − Management
- −$2,248
- − HOA
- −$312
- − Depreciation
- −$9,018
- Taxable loss
- −$6,040
- Est. tax savings @ 24.0%
- +$1,450
- After-tax cash flow
- $880/yr
For passive investors: Depreciation is non-cash, so a rental often shows a tax loss while cash-flowing — sheltering income. Rental losses are passive: they offset passive income freely, and up to $25,000/yr can offset ordinary (W-2) income if you actively participate and your MAGI is under $100k (phasing out to $0 by $150k); unused losses carry forward. On sale, claimed depreciation is recaptured at up to 25%, and gains may owe capital-gains tax (a 1031 exchange can defer both). Figures are a year-1 estimate at your 24.0% rate — not tax advice; consult a CPA.
Schools (NCES district)
- District
- Santa Rosa
- NCES district ID
- 1201650
- Math proficiency
- 63% ▼ -6.00%
- Reading proficiency
- 60% ▼ -5.00%
- Median HH income
- $58,161
- Composite
- 53.12/100
- National rank
- #1511
- State rank
- #8 of 73 in FL
Livability — Midway
No livability data for this city. (Only ~50 U.S. cities are tracked.)
Census & demographics
- Census place
- Midway, FL
- County
- Santa Rosa County · 194,764 people
- Metro
- Pensacola-Ferry Pass-Brent, FL
- Population (ZIP)
- 30,364
- Household income
- $100,396
- Rent vs Own
- Severe rent burden
- 397.0
Population outlook (Santa Rosa County) Hauer SSP2
- Today (2025)
- 195,978 people
- By 2030
- 209,782 · +7.0%
- By 2040
- 235,293 · +20.1%
- By 2050
- 256,408 · +30.8%
- By 2075
- 298,074 · +52.1%
- By 2100
- 303,216 · +54.7%
Race, ethnicity, and origin ACS 2023
- Neighborhood character
- Predominantly White (87%)
- Race & ethnicity
- White 87% Two or more races 6% Hispanic / Latino 6% Black 2% Asian 1%
- Hispanic origin (detail)
- Mexican 2%
- Common ancestry
- Italian 5% Slovak 3% Romanian 3%
- Foreign-born
- 4% · Canada
- Languages at home
- 94% English-only · Spanish 3% German/W. Germanic 1% Chinese 1%
Political lean MEDSL · Santa Rosa
- 2024 margin
- Solid R (+51.0) · D 24.1% · R 75.0%
- 2008→2024 swing
- -3.0pp toward R · 2008: -47.9pp · 2024: -51.0pp
- All cycles
- 2024: R+51.0 2020: R+46.5 2016: R+53.5 2012: R+52.6 2008: R+47.9
Not yet ingested
- Civics
- —
Market trends
- HPI YoY
- ▼ -229.78%
- Current HPI
- 278.9852
- Rent YoY
- ▲ 4.60%
- Metro
- Pensacola-Ferry Pass-Brent, FL
- State GDP YoY
- ▲ 3.28%
- F500 in state
- 36
Industry mix (Fortune 500 HQ in FL)
| Industry | F500 HQs | Revenue |
|---|---|---|
| Industrial Technology | 2 | $29B |
|
||
| Insurance | 2 | $17B |
|
||
| Retail | 1 | $60B |
|
||
| Technology Distribution | 1 | $58B |
|
||
| Homebuilding | 1 | $35B |
|
||
| Technology Manufacturing | 1 | $35B |
|
||
Price history
2 events — show timeline
- 2026-05-21 Contingent — PARMLS
- 2026-05-15 Listed $310,000 PARMLS
Property tax history
+2.7%/yrLatest (2025): $1,394 · +2.9% YoY. Source: county tax records.
Cash-flow waterfall
monthlySold comps — $/sqft
last 12 mo · ≤1 miLoading sold comps…