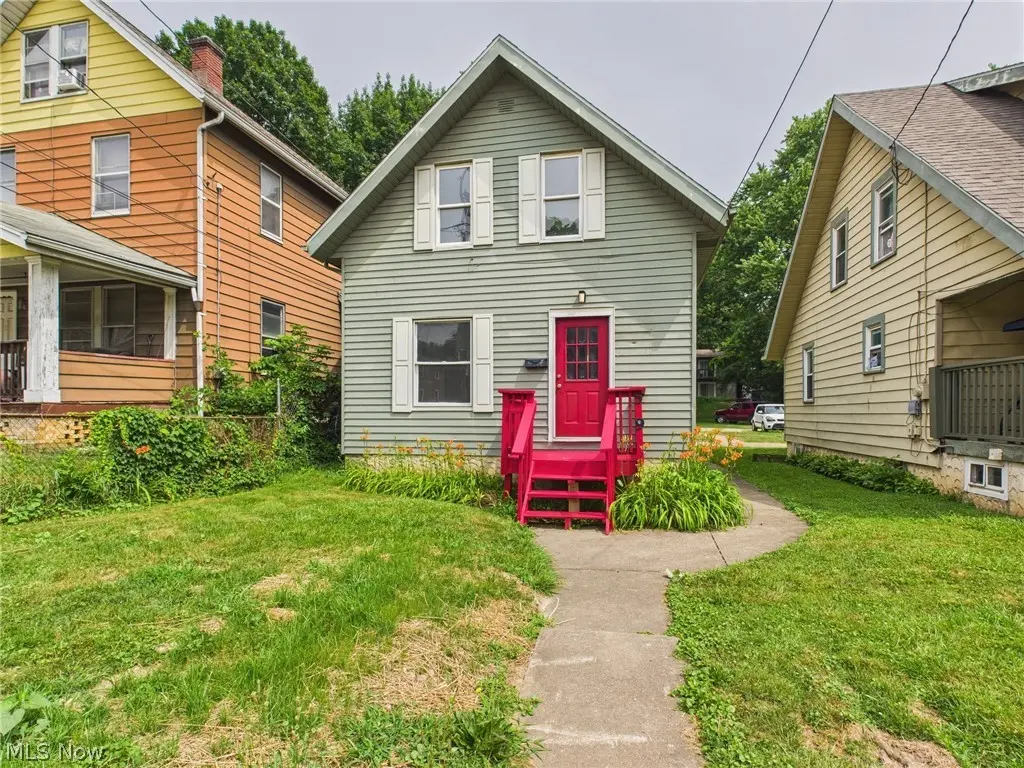
529 Gage St · Akron, OH
Flood risk 7/10 · Major
- FEMA flood zone
- X (unshaded)
- Chance of flooding over 30 yrs
- 0.77%
- Est. flood insurance / yr
- $473 – $860
Fire risk 1/10 · Minimal
- Est. fire insurance / yr
- $713 – $1,323
Heat risk 3/10 · Minor
- Hot days now (above 97°F)
- 7 days/yr
- Hot days in 30 yrs
- 17 days/yr
Wind risk 1/10 · Minimal
- Chance of severe wind over 30 yrs
- —
Air-quality risk 3/10 · Minor
- Unhealthy air days now
- 2 days/yr
- Unhealthy air days in 30 yrs
- 4 days/yr
Risk factors via First Street. Map © Google.
Why this score? — see what drove the D+ grade
The composite is a weighted blend of 9 inputs, each scored 0–100. Each bar is that input's sub-score; the figure is the points it added to the 100-point composite (weight × sub-score).
- Cash flow +23.3/30.0
- DSCR +7.5/10.0
- 1% rule +6.2/10.0
- Livability +4.0/5.0
- Rent growth +2.5/5.0
- Condition / age +2.5/5.0
- Schools +2.1/10.0
- ARV discount +0.0/15.0
- Appreciation +0.0/10.0
$99,000
🖨 Deal sheet (PDF) 📄 Offer letter ✓ Due diligence
Listing remarks MLS
Must be sold with 529, 531, 533, 535, 539, 543 Gage- package deal due to overlapping driveways and parking
Key facts
- 4,948 sq ft lot
- Built 1922
- Listed 22 days
Property features AI
Exterior
- Parking: Common parking lot
- Utilities: Public water supply; Public sewer service
- Home design: Two-story home; Wood siding construction; Asphalt/fiberglass roof
- Construction: Built according to public records; Above-grade finished area approximately 780
- Exterior features: Public water; Public sewer
Interior
- Bedrooms: 1 main-level bedroom
- Bathrooms: 1 full bathroom
- Heating & cooling: Forced air heating
- Interior features: Has a full basement; 6 total rooms
Neighborhood map
What this means for you Summary
Snapshot
- This is a 3-bed/1.0-bath single-family listed at $99k.
Deal economics
- At list price, monthly cash flow is $125 ($2k/yr) — positive.
- The deal already cash-flows at list — no discount required.
- Meets the 1% rule at list price ($1k rent vs $99k).
- Recommended offer: $98k (1.5% below list) — sets the bar for market timing.
- Cap rate 8.5% vs local median 6.6% in Akron — meaningfully above typical; check what's discounted (condition, days-on-market, listing class) to confirm the premium yield is real.
Location & tenants
- Location reads 81/100 on livability (#104 in OH, #1,591 nationally) — a professional / high-income tenant draw. Strengths: amenities A+, commute A+, cost of living A+; Watch: crime F, employment F.
- Akron City (urban): math 22% / reading 30% proficiency, ranked #602 of 656 in OH (top 92%) — low school quality limits family demand, transient renter base, plan for 1-2y turnover; 66% free/reduced lunch — lower-income household profile, screen leases tightly.
- Zoned schools: Leggett Community Learning Center (math 17% / reading 22%, grade F, #1,293 of 1,584 statewide, top 83%, 371 students, 0% FRL); Jennings Community Learning Center (math 12% / reading 18%, grade F, #627 of 654 statewide, top 96%, 757 students, 0% FRL); North High School (math 2% / reading 15%, grade F, #755 of 781 statewide, top 97%, 916 students, 0% FRL) — zoned schools average 0% FRL vs 66% district-wide (66 pts lower); this property's tenant base skews higher-income than the district average.
- Market conditions: 54 active listings in the ZIP; 40 comparable units currently listed for rent nearby; rentals at typical pace (median 25d on market — plan ~3-4 weeks tenant-placement turnaround); 42% of comp listings sitting > 30 days — soft ceiling on asking rent; lower-income renter base — watch delinquency; 1,114 units permitted in Summit County in 2024 (397 in 5+ unit buildings).
- At $1,109/mo this rent would consume 55% of the median local household income ($24k/yr) (locally 659% of renters already pay >50% of income on rent) — very limited rent-growth headroom before tenants either downsize or default.
Forward outlook
- Local home prices are declining (-3.0%/yr); year-one equity from $684 of loan paydown is wiped out by about $3k of value loss. Plan a longer hold.
- Summit County population projected to shrink 6% by 2050 — rents likely to lag national; underwrite the cash flow, not the appreciation.
Negotiation context
- It's been on market 22 days — a 2% lower offer ($98k) is reasonable based on typical stale-listing flexibility.
- 5 sale attempts since 5y ago with the ask held roughly flat each time — persistent listings suggest the price (not the market) is what's stuck; bring a comps-based counter.
- Current owner paid $60k; list at $99k implies a 65% gain — meaningful room to come down on a strong offer.
Risks & watch-outs
- Watch-outs: flood insurance adds $56/mo; built in 1922 — expect roof / HVAC / electrical / plumbing capex.
- Climate carrying-cost: major flood risk — expect insurance premiums to compound above CPI over the hold.
Questions for the listing agent
- Built in 1922 — when were the roof, HVAC, electrical panel, plumbing, and water heater last replaced?
- What's the actual annual flood-insurance premium (NFIP or private), and is the property in a SFHA with mandatory coverage?
- Is there a deadline driving the sale (1031 exchange, divorce, estate, relocation)? That informs how much negotiation room exists.
- Crime grade is F in this area — have there been break-ins, vandalism, or insurance claims at this property in the last 3 years? What carrier currently insures it and at what premium?
- The area grade is low — what's the realistic commute time and amenity access for the typical tenant pool here? Any planned neighborhood developments (good or bad) we should know about?
- What's the average days-on-market for RENTAL listings here right now (not sales)? A rising rental-DOM trend means longer vacancies and softer asking-rent achievability than the comps imply.
- What's the recent tenant-quality profile in this submarket — average credit score on applications, eviction rate, late-payment / NSF rate, and stable-employment percentage? A property-management company in the area should have these aggregated.
- How much new for-sale + rental construction is in the pipeline within 1–3 miles? Heavy new supply typically softens prices + rents 12–24 months out; constrained supply supports both.
Investment metrics
- 1% rule
- 1.12% ✓
- Cap rate
- 8.48%
- Cash-on-cash
- 7.83%
- DSCR
- 1.35
- GRM
- 7.4
CMA / ARV
- ARV (median comp)
- $68,048
- List price
- $99,000
- Delta
- 45.48%
- Verdict
- OVERPRICED
- Comps
- 20 within 1.0 mi
Show comp detail 10 sales within ~0.75 mi
| Address | Dist | Beds/Ba | Sqft | Sold | Price | $/sf | Match |
|---|---|---|---|---|---|---|---|
| 689 Kling St | 0.49mi | 3/1.0 | 780 (0%) | 5mo | $68,000 | $87 | 73 |
| 484 Hammel St | 0.34mi | 3/1.0 | 792 (+2%) | 12mo | $67,000 | $85 | 71 |
| 427 Black St | 0.51mi | 3/1.0 | 822 (+5%) | 5mo | $80,000 | $97 | 63 |
| 438 Black St | 0.51mi | 3/1.0 | 824 (+6%) | 6mo | $45,000 | $55 | 62 |
| 440 Tyner St | 0.30mi | 3/1.0 | 880 (+13%) | 9mo | $72,100 | $82 | 57 |
| 750 Corley St | 0.43mi | 2/1.0 (-1) | 784 (+0%) | 24mo | $56,000 | $71 | 54 |
| 374 E Voris St | 0.55mi | 3/1.0 | 876 (+12%) | 5mo | $102,000 | $116 | 50 |
| 396 E Voris St | 0.52mi | 2/1.0 (-1) | 858 (+10%) | 9mo | $79,900 | $93 | 46 |
| 1036 Ackley St | 0.70mi | 2/1.0 (-1) | 864 (+11%) | 14mo | $37,000 | $43 | 33 |
| 631 La Follette St | 0.70mi | 2/1.0 (-1) | 864 (+11%) | 22mo | $70,000 | $81 | 26 |
Match score weights: distance 35% · size 25% · config 20% · recency 20%. Top-matched comps best support the ARV.
Projected returns pro-forma
-3.0% appreciation · 3.0% rent growth · sell at horizon
- IRR
- -7.8%
- Equity multiple
- 0.71×
- Total profit
- $-8,005
- Equity at exit
- $14,761
- IRR
- 1.8%
- Equity multiple
- 1.13×
- Total profit
- $3,538
- Equity at exit
- $8,560
Cash invested: $27,720 (down + closing). Projections, not guarantees.
Landlord ↔ Tenant lean methodology
- Overall (STATE)
- 73 Landlord-Friendly
- State Ohio
- 73 Landlord-Friendly · R+6
- County
- — inherits STATE
- City
- — inherits STATE
ZIP-level market 44311
- Home prices YoY
- -28.4%
- Active inventory
- 54
- Price-to-rent
- 7.4×
Monthly cashflow live
- Estimated rent
- $1,109 high interval (Pro) →
- Mortgage (P&I)
- −$519
- Tax from tax record
- −$135 /mo · $1,617/yr
- Insurance
- −$41
- Flood insurance flood zone
- −$56 /mo · $666/yr
- HOA
- −$0
- Vacancy / Maint / Mgmt
- −$233
- Net cashflow
- $125
Break-even live
Sensitivity live
| Price | -10% $181 | -5% $153 | +0% $125 | +5% $97 | +10% $69 |
|---|---|---|---|---|---|
| Rent | -10% $38 | -5% $81 | +0% $125 | +5% $169 | +10% $213 |
| Rate | -1.0pp $175 | -0.5pp $150 | base $125 | +0.5pp $100 | +1.0pp $74 |
UW: 25.0% down · 7.5% · 30yr · 1.5% tax · 5.0% vac · 8.0% maint · 8.0% mgmt
Financing live
Cash to close
- Down payment
- $24,750
- Closing costs
- $2,970
- Reserves months
- —
- Total cash needed
- —
Loan-product check · same deal, 3 products live
Conventional
25% down · 7.5% · 30yr
- Down + closing
- —
- Monthly P&I
- —
- Monthly cashflow
- —
- DSCR
- —
- Eligible?
- —
Personal DTI + credit; lowest rate.
DSCR
20% down · 8.5% · 30yr
- Down + closing
- —
- Monthly P&I
- —
- Monthly cashflow
- —
- DSCR
- —
- Eligible?
- —
No personal income docs; deal must DSCR.
Hard money
10% down · 12.0% · 12mo
- Down + closing
- —
- Monthly P&I
- —
- Monthly cashflow
- —
- DSCR
- —
- Eligible?
- —
Short-term bridge; refi at stabilization.
Rent comps 40 comps
| Address | Beds | Baths | Sqft | Rent | $/sqft | DOM | Units | Dist |
|---|---|---|---|---|---|---|---|---|
| 467 Spicer St Akron, OH | 2.0 | 1.0 | 800 | $915 | $1.14 | 25d | 1 | 0.08mi |
| 461 Spicer St Akron, OH | 3.0 | 2.0 | 1000 | $995 | $0.99 | 45d | 1 | 0.08mi |
| 420 Power St Akron, OH | 3.0 | 1.0 | 900 | $800 | $0.89 | 25d | 1 | 0.16mi |
| 418 Power St Akron, OH | 3.0 | 1.0 | 1000 | $999 | $1.00 | 25d | 1 | 0.16mi |
| 344 Lease St Akron, OH | 3.0 | 1.0 | 1000 | $1,199 | $1.20 | 45d | 1 | 0.25mi |
| 393 Cross St Unit 393 Akron, OH | 2.0 | 1.0 | 864 | $775 | $0.90 | 45d | 1 | 0.32mi |
| 484 Hammel St Akron, OH | 2.0 | 1.0 | 792 | $1,100 | $1.39 | 45d | 1 | 0.34mi |
| 287 Wheeler St Akron, OH | 3.0 | 1.0 | 1100 | $1,350 | $1.23 | 25d | 1 | 0.35mi |
| 421 Allyn St Unit 2 Akron, OH | 3.0 | 1.0 | 743 | $850 | $1.14 | 45d | 1 | 0.40mi |
| 437 Sumner St Apt T Akron, OH | 3.0 | 1.5 | 600 | $960 | $1.60 | 25d | 1 | 0.45mi |
| 437 Sumner St Apt A Akron, OH | 3.0 | 1.5 | 750 | $1,200 | $1.60 | 25d | 1 | 0.45mi |
| 437 Sumner St Apt P Akron, OH | 3.0 | 1.5 | 600 | $750 | $1.25 | 25d | 1 | 0.45mi |
| 437 Sumner St Apt R Akron, OH | 2.0 | 1.5 | 600 | $500 | $0.83 | 25d | 1 | 0.46mi |
| 437 Sumner St Apt D Akron, OH | 2.0 | 1.5 | 750 | $900 | $1.20 | 25d | 1 | 0.46mi |
| 878 Clark St Akron, OH | 3.0 | 2.0 | 1029 | $1,440 | $1.40 | 45d | 1 | 0.46mi |
| 689 Kling St Akron, OH | 3.0 | 1.0 | 780 | $1,075 | $1.38 | 23d | 1 | 0.47mi |
| 470 Sumner St Unit 2 Akron, OH | 2.0 | 1.0 | 560 | $900 | $1.61 | 25d | 1 | 0.49mi |
| 505 Rentschler St Unit Down Akron, OH | 2.0 | 1.0 | 825 | $850 | $1.03 | 16d | 1 | 0.50mi |
| 406 Sumner St Akron, OH | 2.0–4.0 | 1.0–2.0 | 836 | $1,085 | $1.30 | 16d | 3 | 0.50mi |
| 195 Wheeler St Apt 301 Akron, OH | 2.0 | 1.0 | 600 | $750 | $1.25 | 45d | 1 | 0.52mi |
| 374 E Voris St Akron, OH | 3.0 | 1.0 | 876 | $1,150 | $1.31 | 25d | 1 | 0.52mi |
| 658 Sumner St Akron, OH | 2.0 | 1.0 | 915 | $999 | $1.09 | 45d | 1 | 0.54mi |
| 662 Sumner St Akron, OH | 2.0 | 1.0 | 915 | $999 | $1.09 | 45d | 1 | 0.54mi |
| 783 E Exchange St Unit 2nd Akron, OH | 2.0 | 1.0 | 951 | $875 | $0.92 | 25d | 1 | 0.58mi |
| 545 E Buchtel Ave Unit 1 Akron, OH | 2.0 | 1.0 | 900 | $1,300 | $1.44 | 45d | 1 | 0.58mi |
| 600 Sherman St Akron, OH | 4.0 | 1.0–2.0 | 824 | $1,400 | $1.70 | 16d | 14 | 0.58mi |
| 801 E Exchange St Akron, OH | 2.0 | 1.0 | 850 | $925 | $1.09 | 25d | 1 | 0.61mi |
| 605 E Buchtel Ave Unit 1 Akron, OH | 2.0 | 1.0 | 1000 | $695 | $0.69 | 16d | 1 | 0.63mi |
| 797 E Market St Apt 220 Akron, OH | 2.0 | 1.5 | 1100 | $1,500 | $1.36 | 25d | 1 | 0.79mi |
| 621 Hudson Ave Akron, OH | 3.0 | 1.0 | 780 | $1,100 | $1.41 | 16d | 1 | 0.87mi |
| 377 Talbot Ave Akron, OH | 2.0 | 1.0 | 1070 | $1,050 | $0.98 | 45d | 1 | 0.88mi |
| 166 Chittenden St Akron, OH | 3.0 | 1.0 | 1020 | $985 | $0.97 | 45d | 1 | 0.92mi |
| 134 N Arlington St Akron, OH | 2.0 | 1.0 | 964 | $900 | $0.93 | 25d | 1 | 0.93mi |
| 22 E Exchange St Apt 335 Akron, OH | 2.0 | 2.0 | 963 | $1,466 | $1.52 | 45d | 1 | 0.93mi |
| 22 E Exchange St Unit 115 Akron, OH | 2.0 | 2.0 | 1039 | $1,585 | $1.53 | 45d | 1 | 0.93mi |
| 22 E Exchange St Unit 256 Akron, OH | 2.0 | 2.0 | 920 | $1,544 | $1.68 | 45d | 1 | 0.93mi |
| 22 E Exchange St Unit 421 Akron, OH | 2.0 | 2.0 | 985 | $1,514 | $1.54 | 45d | 1 | 0.93mi |
| 22 E Exchange St Unit 349 Akron, OH | 2.0 | 2.0 | 858 | $1,468 | $1.71 | 23d | 1 | 0.93mi |
| 22 E Exchange St Unit 253 Akron, OH | 2.0 | 2.0 | 958 | $1,565 | $1.63 | 16d | 1 | 0.93mi |
| 22 E Exchange St Unit 233 Akron, OH | 2.0 | 2.0 | 1052 | $1,599 | $1.52 | 45d | 1 | 0.93mi |
Listing history 16 events
-
2026-05-13status Pending 539-char remark
-
2026-04-20$99,000 Active 539-char remark
-
2025-08-01historical $925
-
2025-07-20price $925
-
2025-07-11$995
-
2024-05-09historical $900
-
2024-05-03price $900
-
2024-04-23price $950
-
2024-04-16price $975
-
2024-04-06$995
-
2021-10-28soldstatus $60,000 Closed 106-char remark
Show marketing remark (106 chars)
Must be sold with 529, 531, 533, 535, 539, 543 Gage- package deal due to overlapping driveways and parking
-
2021-08-17status Pending 106-char remark
Show marketing remark (106 chars)
Must be sold with 529, 531, 533, 535, 539, 543 Gage- package deal due to overlapping driveways and parking
-
2021-08-11status Active 106-char remark
Show marketing remark (106 chars)
Must be sold with 529, 531, 533, 535, 539, 543 Gage- package deal due to overlapping driveways and parking
-
2021-03-30status Pending 106-char remark
Show marketing remark (106 chars)
Must be sold with 529, 531, 533, 535, 539, 543 Gage- package deal due to overlapping driveways and parking
-
2021-03-23$85,000 Active 106-char remark
Show marketing remark (106 chars)
Must be sold with 529, 531, 533, 535, 539, 543 Gage- package deal due to overlapping driveways and parking
-
1994-02-24soldstatus $41,575
ⓘ Source: listings_history table (triggers on properties + properties_extension) + one-shot
backfill from property_details.listing_events for pre-trigger history.
Tax reassessment forecast OH · Partial reset (capped growth)
- Current annual tax
- $1,617 · $135/mo
- Projected year-2 tax
- $1,617 · $135/mo
- Expected delta
- $0/yr ($0/mo · 0.0%)
ⓘ Screening estimate from a state-policy table — verify with the county assessor before closing.
Climate risk First Street
- Flood 7/10 Severe FEMA zone X (unshaded) · 77% chance over 30 yrs
- Wildfire 1/10 Low
- Heat 3/10 Moderate 7 d/yr ≥97°F today · 17 d/yr by 30 yrs out
- Wind 1/10 Low
- Air quality 3/10 Moderate 2 unhealthy d/yr today · 4 by 30 yrs out
Nearby sold comps map
Loading sold comps map…
Walkable amenities ~0.75 mi
Loading nearby amenities…
Taxation est. · year 1
- Rental income
- $13,306
- − Mortgage interest
- −$5,546
- − Property taxes
- −$1,617
- − Insurance
- −$1,162
- − Repairs & maintenance
- −$1,065
- − Management
- −$1,065
- − Depreciation
- −$2,880
- Taxable loss
- −$27
- Est. tax savings @ 24.0%
- +$6
- After-tax cash flow
- $1,510/yr
For passive investors: Depreciation is non-cash, so a rental often shows a tax loss while cash-flowing — sheltering income. Rental losses are passive: they offset passive income freely, and up to $25,000/yr can offset ordinary (W-2) income if you actively participate and your MAGI is under $100k (phasing out to $0 by $150k); unused losses carry forward. On sale, claimed depreciation is recaptured at up to 25%, and gains may owe capital-gains tax (a 1031 exchange can defer both). Figures are a year-1 estimate at your 24.0% rate — not tax advice; consult a CPA.
Schools (NCES district)
- District
- Akron City
- NCES district ID
- 3904348
- Math proficiency
- 22% ▼ -17.00%
- Reading proficiency
- 30% ▼ -12.00%
- Median HH income
- $33,811
- Composite
- 21.31/100
- National rank
- #8383
- State rank
- #602 of 656 in OH
Livability — Akron
- Score
- 81/100
- State rank
- #104
- US rank
- #1591
Category grades
Schools grade is shown separately in the Schools card above.
Census & demographics
- Census place
- Akron, OH
- County
- Summit County · 440,783 people
- City population
- 174,375
- Metro
- Akron, OH
- Population (ZIP)
- 7,547
- Household income
- $24,369
- Rent vs Own
- Severe rent burden
- 659.0
Population outlook (Summit County) Hauer SSP2
- Today (2025)
- 546,583 people
- By 2030
- 544,028 · -0.5%
- By 2040
- 531,363 · -2.8%
- By 2050
- 514,923 · -5.8%
- By 2075
- 481,765 · -11.9%
- By 2100
- 432,265 · -20.9%
Race, ethnicity, and origin ACS 2023
- Neighborhood character
- Diverse neighborhood (Simpson 0.60)
- Race & ethnicity
- White 53% Black 35% Two or more races 6% Hispanic / Latino 4% Asian 3%
- Common ancestry
- Lithuanian 2% Romanian 2% Slovak 2%
- Foreign-born
- 3% · Canada, Vietnam, Philippines
- Languages at home
- 95% English-only · Spanish 2% Other Asian/Pacific 1% Other Indo-European 1%
Political lean MEDSL · Summit
- 2024 margin
- Lean D (+7.0) · D 53.0% · R 46.0%
- 2008→2024 swing
- -9.6pp toward R · 2008: 16.6pp · 2024: 7.0pp
- All cycles
- 2024: D+7.0 2020: D+9.6 2016: D+8.2 2012: D+14.8 2008: D+16.6
Not yet ingested
- Civics
- —
Market trends
- HPI YoY
- ▼ -39.01%
- Current HPI
- 98.3809
- Rent YoY
- —
- Metro
- Akron, OH
- State GDP YoY
- ▲ 1.98%
- F500 in state
- 48
Industry mix (Fortune 500 HQ in OH)
| Industry | F500 HQs | Revenue |
|---|---|---|
| Insurance | 3 | $145B |
|
||
| Industrial Machinery | 3 | $49B |
|
||
| Financial Services | 3 | $24B |
|
||
| Consumer Goods | 2 | $93B |
|
||
| Aerospace / Defense | 2 | $47B |
|
||
| Utilities | 2 | $33B |
|
||
Price history
+138.1% since first listed16 events — show timeline
- 2026-05-13 Pending — MLSNOW
- 2026-04-20 Listed $99,000 MLSNOW
- 2025-08-01 Rental Removed $925 TENANTTURNER2
- 2025-07-20 Price Changed $925 TENANTTURNER2
- 2025-07-11 Listed for Rent $995 TENANTTURNER2
- 2024-05-09 Rental Removed $900 RENTEC
- 2024-05-03 Price Changed $900 RENTEC
- 2024-04-23 Price Changed $950 RENTEC
- 2024-04-16 Price Changed $975 RENTEC
- 2024-04-06 Listed for Rent $995 RENTEC
- 2021-10-28 Sold (MLS) $60,000 MLSNOW
- 2021-08-17 Pending — MLSNOW
- 2021-08-11 Relisted — MLSNOW
- 2021-03-30 Pending — MLSNOW
- 2021-03-23 Listed $85,000 MLSNOW
- 1994-02-24 Sold (Public Records) $41,575 Public Records
Property tax history
+3.6%/yrLatest (2025): $1,617 · -2.5% YoY. Source: county tax records.
Cash-flow waterfall
monthlySold comps — $/sqft
last 12 mo · ≤1 miLoading sold comps…