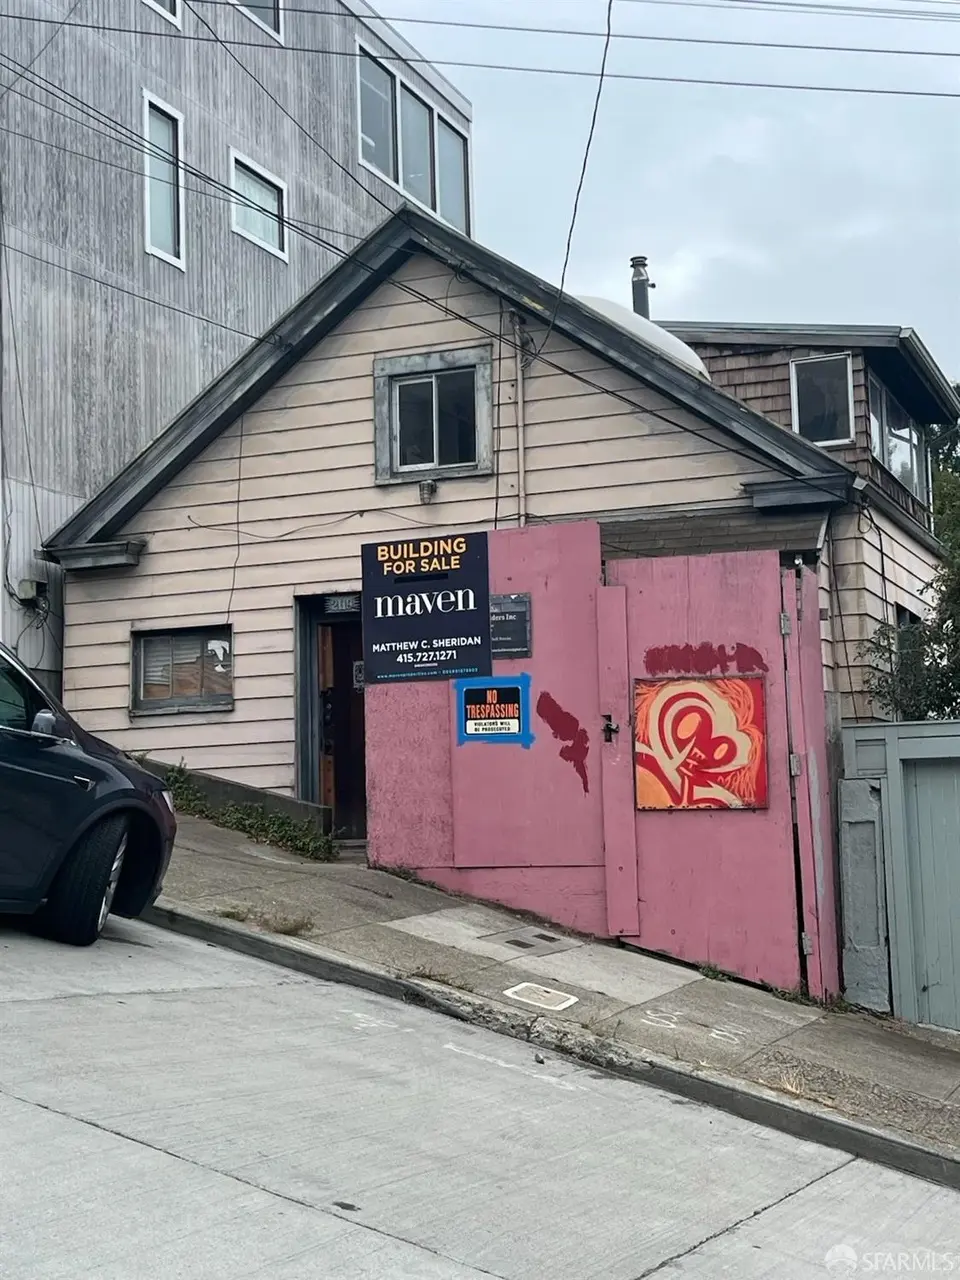
2119 22nd St · San Francisco, CA
Flood risk 1/10 · Minimal
- FEMA flood zone
- X (unshaded)
- Chance of flooding over 30 yrs
- 0.0%
- Est. flood insurance / yr
- $507 – $1,088
Fire risk 1/10 · Minimal
- Est. fire insurance / yr
- $659 – $1,223
Heat risk 2/10 · Minimal
- Hot days now (above 78°F)
- 7 days/yr
- Hot days in 30 yrs
- 15 days/yr
Wind risk 1/10 · Minimal
- Chance of severe wind over 30 yrs
- —
Air-quality risk 8/10 · Major
- Unhealthy air days now
- 15 days/yr
- Unhealthy air days in 30 yrs
- 15 days/yr
Risk factors via First Street. Map © Google.
Why this score? — see what drove the D grade
The composite is a weighted blend of 9 inputs, each scored 0–100. Each bar is that input's sub-score; the figure is the points it added to the 100-point composite (weight × sub-score).
- ARV discount +14.2/15.0
- Appreciation +7.4/10.0
- Cash flow +5.5/30.0
- Rent growth +5.0/5.0
- Schools +5.0/10.0
- Livability +3.8/5.0
- Condition / age +2.5/5.0
- 1% rule +0.2/10.0
- DSCR +0.0/10.0
$1,350,000
🖨 Deal sheet (PDF) 📄 Offer letter ✓ Due diligence
Listing remarks MLS
Zoned RH-3, the site presents an opportunity to re-image the current home. Currently, a 1,700-sq. -ft. -family house on three floors occupies the parcel. Please consult with an architect or land-use attorney for precise development opportunity. Parcel: 75' x 25'. Height limit: 40-X. Historic Resource: B-Unknown. Actual square footage may be higher than reported by tax records. Sold As-Is, Where-is. Bring your contractor.
Key facts
- Zoned rh-3
- Height limit: 40-x
- 1,873 sq ft lot
Tags
Neighborhood map
What this means for you Summary
Snapshot
- This is a 3-bed/2.0-bath single-family listed at $1.35M.
Deal economics
- At list price, monthly cash flow is $-3k ($-34k/yr) — negative.
- To cash-flow at today's rent, offer at most $844k (37.5% below list).
- To meet the 1% rule (rent ≥ 1% of price), the offer needs to be $701k (48.1% below list).
- Recommended offer: $701k (48.1% below list) — sets the bar for 1% rule.
- Cap rate 3.7% vs local median 2.1% in San Francisco — top-decile yield for the area; either an underpriced asset or a hidden risk that comps aren't pricing in. Stress-test before assuming the spread holds.
Location & tenants
- Location reads 76/100 on livability (#90 in CA, #3,143 nationally) — a middle-class / working-renter tenant base. Strengths: amenities A+, commute A+, employment A+; Watch: crime F, cost of living F.
- San Francisco Unified (urban): math 50% / reading 56% proficiency, ranked #322 of 1,400 in CA (top 23%) — acceptable for families but not a draw, mixed tenant base, ~2y average lease.
- Zoned schools: Lilienthal (Claire) Elementary (669 students, 19% FRL); Giannini (A.P.) Middle (1,192 students, 34% FRL); Lowell High (2,632 students, 37% FRL) — zoned schools average 30% FRL vs 49% district-wide (19 pts lower); this property's tenant base skews higher-income than the district average.
- Market conditions: Rents rising fast (+18.9%/yr); 140 active listings in the ZIP; 40 comparable units currently listed for rent nearby; rentals at typical pace (median 20d on market — plan ~3-4 weeks tenant-placement turnaround); high-income renter base; 750 units permitted in San Francisco County in 2024 (688 in 5+ unit buildings).
- At $7,008/mo this rent would consume 46% of the median local household income ($183k/yr) (locally 1851% of renters already pay >50% of income on rent) — very limited rent-growth headroom before tenants either downsize or default.
Forward outlook
- In year one you build about $74k of equity ($9k loan paydown + $65k appreciation (4.8% local appreciation)).
- San Francisco County population projected at +39% by 2050 — long-run rental-demand tailwind backs the buy-and-hold thesis.
- By year 2, paydown + projected appreciation supports a ~$119k cash-out refi (75% LTV) — recoverable capital for the next deal without selling this one.
Negotiation context
- It's been on market 614 days — a 12% lower offer ($1.19M) is reasonable based on typical stale-listing flexibility.
- 4 sale attempts since 10y ago with the ask held roughly flat each time — persistent listings suggest the price (not the market) is what's stuck; bring a comps-based counter.
- Current owner paid $650k; list at $1.35M implies a 108% gain — meaningful room to come down on a strong offer.
Risks & watch-outs
- Watch-outs: built in 1900 — expect roof / HVAC / electrical / plumbing capex.
Questions for the listing agent
- What do current leases actually rent for vs. the listed asking? Can we see a recent rent roll and the last 12 months of T-12 income?
- It's been on market 614 days. Have you received any prior offers? Is the seller open to a 48% concession, seller financing, or rate buy-down credit?
- Built in 1900 — when were the roof, HVAC, electrical panel, plumbing, and water heater last replaced?
- Why hasn't it sold? Are there any deal-killer items the seller is aware of (foundation, flood, title, zoning, code violations)?
- Is there a deadline driving the sale (1031 exchange, divorce, estate, relocation)? That informs how much negotiation room exists.
- Schools are B-rated — typically a magnet for longer-tenancy family renters. What's the average tenant stay here, and is there a school-zone premium baked into asking?
- Crime grade is F in this area — have there been break-ins, vandalism, or insurance claims at this property in the last 3 years? What carrier currently insures it and at what premium?
- The area grade is low — what's the realistic commute time and amenity access for the typical tenant pool here? Any planned neighborhood developments (good or bad) we should know about?
- What's the average days-on-market for RENTAL listings here right now (not sales)? A rising rental-DOM trend means longer vacancies and softer asking-rent achievability than the comps imply.
- What's the recent tenant-quality profile in this submarket — average credit score on applications, eviction rate, late-payment / NSF rate, and stable-employment percentage? A property-management company in the area should have these aggregated.
- How much new for-sale + rental construction is in the pipeline within 1–3 miles? Heavy new supply typically softens prices + rents 12–24 months out; constrained supply supports both.
Investment metrics
- 1% rule
- 0.52% ✗
- Cap rate
- 3.75%
- Cash-on-cash
- -9.09%
- DSCR
- 0.60
- GRM
- 16.1
CMA / ARV
- ARV (median comp)
- $1,584,136
- List price
- $1,350,000
- Delta
- -14.78%
- Verdict
- UNDERPRICED
- Comps
- 20 within 1.0 mi
Show comp detail 12 sales within ~0.75 mi
| Address | Dist | Beds/Ba | Sqft | Sold | Price | $/sf | Match |
|---|---|---|---|---|---|---|---|
| 567 Kansas St | 0.39mi | 3/2.0 | 1,715 (+1%) | 3mo | $3,010,000 | $1,755 | 78 |
| 1392 Rhode Island St | 0.34mi | 3/2.5 | 1,641 (-4%) | 2mo | $1,750,000 | $1,066 | 75 |
| 619 Connecticut St | 0.31mi | 3/2.0 | 1,846 (+9%) | 1mo | $2,553,525 | $1,383 | 70 |
| 507 Potrero Ave | 0.48mi | 3/2.0 | 1,730 (+2%) | 6mo | $1,705,000 | $986 | 69 |
| 512 Mississippi St | 0.47mi | 4/2.0 (+1) | 1,765 (+4%) | 1mo | $2,400,000 | $1,360 | 66 |
| 549 Kansas St | 0.40mi | 3/2.0 | 1,514 (-11%) | 1mo | $2,760,000 | $1,823 | 62 |
| 2926-2930 25th St #2926 | 0.51mi | 3/2.0 | 1,557 (-8%) | 5mo | $999,000 | $642 | 58 |
| 913 Florida St | 0.44mi | 2/1.0 (-1) | 1,553 (-9%) | 2mo | $1,767,000 | $1,138 | 55 |
| 461 Vermont St | 0.49mi | 3/2.0 | 1,517 (-11%) | 6mo | $1,560,000 | $1,028 | 55 |
| 1145 Wisconsin St | 0.35mi | 4/4.0 (+1) | 1,875 (+10%) | 7mo | $2,390,000 | $1,275 | 48 |
| 611 Pennsylvania Ave | 0.53mi | 3/2.0 | 1,447 (-15%) | 4mo | $1,450,000 | $1,002 | 48 |
| 2325 Mariposa St | 0.49mi | 3/1.0 | 1,935 (+14%) | 6mo | $1,580,000 | $817 | 45 |
Match score weights: distance 35% · size 25% · config 20% · recency 20%. Top-matched comps best support the ARV.
Projected returns pro-forma
4.81% appreciation · 8.0% rent growth · sell at horizon
- IRR
- 6.1%
- Equity multiple
- 1.40×
- Total profit
- $150,629
- Equity at exit
- $749,438
- IRR
- 9.8%
- Equity multiple
- 2.87×
- Total profit
- $708,392
- Equity at exit
- $1,280,719
Cash invested: $378,000 (down + closing). Projections, not guarantees.
Landlord ↔ Tenant lean methodology
- Overall (CITY)
- 0 Strongly Tenant-Friendly
- State California
- 18 Strongly Tenant-Friendly · D+13
- County
- — inherits STATE
- City San Francisco
- 0 Strongly Tenant-Friendly · D+57
ZIP-level market 94107
- Home prices YoY
- 2.6%
- Rents YoY
- 18.9%
- Active inventory
- 140
- Price-to-rent
- 16.1×
Monthly cashflow live
- Estimated rent
- $7,008 high interval (Pro) →
- Mortgage (P&I)
- −$7,080
- Tax from tax record
- −$759 /mo · $9,106/yr
- Insurance
- −$562
- HOA
- −$0
- Vacancy / Maint / Mgmt
- −$1,472
- Net cashflow
- $-2,865
Break-even live
Sensitivity live
| Price | -10% $-2,100 | -5% $-2,482 | +0% $-2,865 | +5% $-3,247 | +10% $-3,629 |
|---|---|---|---|---|---|
| Rent | -10% $-3,418 | -5% $-3,141 | +0% $-2,865 | +5% $-2,588 | +10% $-2,311 |
| Rate | -1.0pp $-2,185 | -0.5pp $-2,521 | base $-2,865 | +0.5pp $-3,214 | +1.0pp $-3,570 |
UW: 25.0% down · 7.5% · 30yr · 1.5% tax · 5.0% vac · 8.0% maint · 8.0% mgmt
Financing live
Cash to close
- Down payment
- $337,500
- Closing costs
- $40,500
- Reserves months
- —
- Total cash needed
- —
Loan-product check · same deal, 3 products live
Conventional
25% down · 7.5% · 30yr
- Down + closing
- —
- Monthly P&I
- —
- Monthly cashflow
- —
- DSCR
- —
- Eligible?
- —
Personal DTI + credit; lowest rate.
DSCR
20% down · 8.5% · 30yr
- Down + closing
- —
- Monthly P&I
- —
- Monthly cashflow
- —
- DSCR
- —
- Eligible?
- —
No personal income docs; deal must DSCR.
Hard money
10% down · 12.0% · 12mo
- Down + closing
- —
- Monthly P&I
- —
- Monthly cashflow
- —
- DSCR
- —
- Eligible?
- —
Short-term bridge; refi at stabilization.
Rent comps 40 comps
| Address | Beds | Baths | Sqft | Rent | $/sqft | DOM | Units | Dist |
|---|---|---|---|---|---|---|---|---|
| 696 De Haro St #1611 San Francisco, CA | 3.0 | 2.0 | 1515 | $6,580 | $4.34 | 9d | 1 | 0.29mi |
| 2830 22nd St Unit 2830 San Francisco, CA | 2.0 | 2.0 | 1090 | $5,200 | $4.77 | 18d | 1 | 0.50mi |
| 454 Pennsylvania Ave San Francisco, CA | 3.0 | 2.5 | 1388 | $8,950 | $6.45 | 26d | 1 | 0.52mi |
| 830 Alabama St San Francisco, CA | 3.0 | 2.0 | 1465 | $9,500 | $6.48 | 45d | 1 | 0.54mi |
| 800 Indiana St San Francisco, CA | 3.0 | 1.0–2.5 | 952 | $7,241 | $7.61 | 0d | 1 | 0.59mi |
| 1010 16th St San Francisco, CA | 2.0 | 1.0–2.0 | 956 | $4,767 | $4.98 | 0d | 8 | 0.69mi |
| 1121 Tennessee St #5 San Francisco, CA | 2.0 | 2.0 | 1284 | $6,500 | $5.06 | 45d | 1 | 0.72mi |
| 603 Tennessee St Unit 305 San Francisco, CA | 3.0 | 3.5 | 1230 | $8,000 | $6.50 | 26d | 1 | 0.84mi |
| 725 Capp St San Francisco, CA | 4.0 | 2.0 | 1350 | $5,490 | $4.07 | 45d | 1 | 0.85mi |
| 569-571 Capp St San Francisco, CA | 3.0 | 1.0 | 1600 | $6,995 | $4.37 | 4d | 1 | 0.86mi |
| 550 18th St San Francisco, CA | 2.0 | 2.0 | 1280 | $6,595 | $5.15 | 20d | 1 | 0.86mi |
| 1 Henry Adams St San Francisco, CA | 3.0 | 2.0 | 873 | $6,415 | $7.34 | 0d | 3 | 0.87mi |
| 858 Capp St Unit 1794 San Francisco, CA | 2.0 | 2.5 | 1818 | $17,050 | $9.38 | 25d | 1 | 0.90mi |
| 600 S Van Ness Ave San Francisco, CA | 2.0 | 2.0 | 1200 | $6,500 | $5.42 | 4d | 1 | 0.96mi |
| 3436 19th St Unit A San Francisco, CA | 3.0 | 2.0 | 1250 | $7,225 | $5.78 | 21d | 1 | 1.02mi |
| 471 S Van Ness Ave San Francisco, CA | 4.0 | 3.0 | 2140 | $11,000 | $5.14 | 16d | 1 | 1.03mi |
| 855 Brannan St San Francisco, CA | 3.0 | 1.0–2.0 | 958 | $6,420 | $6.70 | 0d | 5 | 1.04mi |
| 454 Holladay Ave San Francisco, CA | 4.0 | 2.0 | 1500 | $8,500 | $5.67 | 20d | 1 | 1.05mi |
| 922 Valencia St Apt C San Francisco, CA | 3.0 | 2.5 | 1300 | $7,950 | $6.12 | 45d | 1 | 1.07mi |
| 922 Valencia St Unit A San Francisco, CA | 3.0 | 2.5 | 1250 | $8,450 | $6.76 | 45d | 1 | 1.07mi |
| 922 Valencia St San Francisco, CA | 3.0 | 3.0 | 1100 | $8,450 | $7.68 | 45d | 1 | 1.07mi |
| 718 Long Bridge St San Francisco, CA | 2.0 | 2.0 | 1400 | $8,000 | $5.71 | 9d | 1 | 1.11mi |
| 380 10th St San Francisco, CA | 2.0 | 2.0 | 1122 | $5,495 | $4.90 | 46d | 1 | 1.15mi |
| 3645 25th St San Francisco, CA | 3.0 | 2.0 | 1100 | $7,000 | $6.36 | 45d | 1 | 1.20mi |
| 1222 Harrison St San Francisco, CA | 2.0 | 1.0–2.5 | 853 | $6,346 | $7.44 | 0d | 33 | 1.21mi |
| 542 Valencia St Unit A San Francisco, CA | 2.0 | 1.0 | 1600 | $5,000 | $3.12 | 26d | 1 | 1.21mi |
| 1600 15th St San Francisco, CA | 1.0–2.0 | 1.0–2.0 | 931 | $6,066 | $6.52 | 0d | 6 | 1.21mi |
| 2018 Oakdale Ave San Francisco, CA | 3.0 | 2.0 | 1300 | $4,995 | $3.84 | 45d | 1 | 1.23mi |
| 23 Boardman Pl Unit LTBP23F San Francisco, CA | 3.0 | 1.0 | 1050 | $4,700 | $4.48 | 45d | 1 | 1.24mi |
| 2 Fair Oaks St #4 San Francisco, CA | 3.0 | 1.0 | 1513 | $9,900 | $6.54 | 20d | 1 | 1.24mi |
| 79 Coleridge St San Francisco, CA | 3.0 | 2.0 | 1850 | $9,750 | $5.27 | 26d | 1 | 1.27mi |
| 235 Berry St #316 San Francisco, CA | 2.0 | 2.5 | 1610 | $7,595 | $4.72 | 45d | 1 | 1.30mi |
| 185 Channel St San Francisco, CA | 2.0 | 1.0–2.0 | 914 | $7,855 | $8.59 | 0d | 36 | 1.33mi |
| 140 S Van Ness Ave #1679 San Francisco, CA | 2.0 | 2.0 | 1250 | $5,760 | $4.61 | 0d | 1 | 1.35mi |
| 73 Sumner St San Francisco, CA | 2.0 | 2.0 | 1100 | $4,750 | $4.32 | 45d | 1 | 1.39mi |
| 72 Langton St San Francisco, CA | 2.0 | 2.0 | 1470 | $5,950 | $4.05 | 6d | 1 | 1.41mi |
| 1288 Howard St #1908 San Francisco, CA | 1.0–2.0 | 1.0–2.0 | 782 | $6,710 | $8.58 | 3d | 2 | 1.42mi |
| 255 King St San Francisco, CA | 3.0 | 1.0–2.5 | 1228 | $8,195 | $6.67 | 0d | 1 | 1.42mi |
| 30 Washburn St Unit 3 San Francisco, CA | 2.0 | 2.0 | 1576 | $5,995 | $3.80 | 9d | 1 | 1.44mi |
| 30 Washburn St San Francisco, CA | 2.0 | 2.0 | 1576 | $5,995 | $3.80 | 26d | 1 | 1.44mi |
Listing history 27 events
-
2026-06-21days on market $1,350,000 Active 614 DOM
-
2026-06-18days on market $1,350,000 Active 611 DOM
-
2026-06-17days on market $1,350,000 Active 610 DOM
-
2026-06-16days on market $1,350,000 Active 609 DOM
-
2026-06-15days on market $1,350,000 Active 608 DOM
-
2026-06-13days on market $1,350,000 Active 606 DOM
-
2026-06-13days on market $1,350,000 Active 605 DOM
-
2026-06-09days on market $1,350,000 Active 602 DOM
-
2026-06-08days on market $1,350,000 Active 601 DOM
-
2026-06-07days on market $1,350,000 Active 600 DOM
-
2026-06-04days on market $1,350,000 Active 597 DOM
-
2026-06-03days on market $1,350,000 Active 596 DOM
-
2026-06-02days on market $1,350,000 Active 595 DOM
-
2026-06-01days on market $1,350,000 Active 594 DOM
-
2026-05-31days on market $1,350,000 Active 593 DOM
-
2024-10-15$1,350,000 Active 424-char remark
Show marketing remark (424 chars)
Zoned RH-3, the site presents an opportunity to re-image the current home. Currently, a 1,700-sq. -ft. -family house on three floors occupies the parcel. Please consult with an architect or land-use attorney for precise development opportunity. Parcel: 75' x 25'. Height limit: 40-X. Historic Resource: B-Unknown. Actual square footage may be higher than reported by tax records. Sold As-Is, Where-is. Bring your contractor.
-
2021-12-22soldstatus $650,000
-
2021-12-21soldstatus $650,000 Closed 730-char remark
Show marketing remark (730 chars)
Zoned RH-3, the site presents an opportunity to re-image the current home or to construct up to three units. Currently, a 1,700-sq. -ft. -family house on three floors occupies the parcel. Several NOVs remain outstanding on the property relating to construction of the foundation. The lower-level floor has been partially removed for construction access. Please consult with an architect or land-use attorney for precise development opportunity. Parcel: 75' x 25'. Height limit: 40-X. Historic Resource: B- Unknown. See Property Statement under Documents in right-hand corner. Actual square footage may be higher than reported by tax records. Complete blueprints and full due diligence available upon request. Sold As-Is, Where-is.
-
2021-12-21soldstatus $650,000 Closed
Show marketing remark (730 chars)
Zoned RH-3, the site presents an opportunity to re-image the current home or to construct up to three units. Currently, a 1,700-sq. -ft. -family house on three floors occupies the parcel. Several NOVs remain outstanding on the property relating to construction of the foundation. The lower-level floor has been partially removed for construction access. Please consult with an architect or land-use attorney for precise development opportunity. Parcel: 75' x 25'. Height limit: 40-X. Historic Resource: B- Unknown. See Property Statement under Documents in right-hand corner. Actual square footage may be higher than reported by tax records. Complete blueprints and full due diligence available upon request. Sold As-Is, Where-is.
-
2021-10-28price $850,000
Show marketing remark (730 chars)
Zoned RH-3, the site presents an opportunity to re-image the current home or to construct up to three units. Currently, a 1,700-sq. -ft. -family house on three floors occupies the parcel. Several NOVs remain outstanding on the property relating to construction of the foundation. The lower-level floor has been partially removed for construction access. Please consult with an architect or land-use attorney for precise development opportunity. Parcel: 75' x 25'. Height limit: 40-X. Historic Resource: B- Unknown. See Property Statement under Documents in right-hand corner. Actual square footage may be higher than reported by tax records. Complete blueprints and full due diligence available upon request. Sold As-Is, Where-is.
-
2021-10-28$850,000 Active 730-char remark
Show marketing remark (730 chars)
Zoned RH-3, the site presents an opportunity to re-image the current home or to construct up to three units. Currently, a 1,700-sq. -ft. -family house on three floors occupies the parcel. Several NOVs remain outstanding on the property relating to construction of the foundation. The lower-level floor has been partially removed for construction access. Please consult with an architect or land-use attorney for precise development opportunity. Parcel: 75' x 25'. Height limit: 40-X. Historic Resource: B- Unknown. See Property Statement under Documents in right-hand corner. Actual square footage may be higher than reported by tax records. Complete blueprints and full due diligence available upon request. Sold As-Is, Where-is.
-
2021-08-04$950,000 Active
-
2016-08-16soldstatus $725,000 Closed
-
2016-08-16soldstatus $725,000
-
2016-06-23status Pending
-
2016-05-09price $850,000
-
2016-03-04$950,000 Active
ⓘ Source: listings_history table (triggers on properties + properties_extension) + one-shot
backfill from property_details.listing_events for pre-trigger history.
Tax reassessment forecast CA · Resets to sale price
- Current annual tax
- $9,106 · $759/mo
- Projected year-2 tax
- $10,260 · $855/mo
- Expected delta
- +$1,154/yr (+$96/mo · 12.7%)
ⓘ Screening estimate from a state-policy table — verify with the county assessor before closing.
Climate risk First Street
- Flood 1/10 Low FEMA zone X (unshaded) · 0% chance over 30 yrs
- Wildfire 1/10 Low
- Heat 2/10 Low 7 d/yr ≥78°F today · 15 d/yr by 30 yrs out
- Wind 1/10 Low
- Air quality 8/10 Severe 15 unhealthy d/yr today · 15 by 30 yrs out
Nearby sold comps map
Loading sold comps map…
Walkable amenities ~0.75 mi
Loading nearby amenities…
Taxation est. · year 1
- Rental income
- $84,096
- − Mortgage interest
- −$75,621
- − Property taxes
- −$9,106
- − Insurance
- −$6,750
- − Repairs & maintenance
- −$6,728
- − Management
- −$6,728
- − Depreciation
- −$39,273
- Taxable loss
- −$60,109
- Est. tax savings @ 24.0%
- +$14,426
- After-tax cash flow
- $-19,948/yr
For passive investors: Depreciation is non-cash, so a rental often shows a tax loss while cash-flowing — sheltering income. Rental losses are passive: they offset passive income freely, and up to $25,000/yr can offset ordinary (W-2) income if you actively participate and your MAGI is under $100k (phasing out to $0 by $150k); unused losses carry forward. On sale, claimed depreciation is recaptured at up to 25%, and gains may owe capital-gains tax (a 1031 exchange can defer both). Figures are a year-1 estimate at your 24.0% rate — not tax advice; consult a CPA.
Schools (NCES district)
- District
- San Francisco Unified
- NCES district ID
- 0634410
- Math proficiency
- 50% ▬ 0.00%
- Reading proficiency
- 56% ▲ 1.00%
- Median HH income
- $81,249
- Composite
- 50.14/100
- National rank
- #4088
- State rank
- #322 of 1400 in CA
Livability — San Francisco
- Score
- 76/100
- State rank
- #90
- US rank
- #3143
Category grades
Schools grade is shown separately in the Schools card above.
Census & demographics
- Census place
- San Francisco, CA
- County
- San Francisco County · 827,552 people
- City population
- 827,552
- Metro
- San Francisco-Oakland-Berkeley, CA
- Population (ZIP)
- 31,823
- Household income
- $182,897
- Rent vs Own
- Severe rent burden
- 1851.0
Population outlook (San Francisco County) Hauer SSP2
- Today (2025)
- 1,030,936 people
- By 2030
- 1,110,409 · +7.7%
- By 2040
- 1,270,010 · +23.2%
- By 2050
- 1,435,001 · +39.2%
- By 2075
- 1,779,074 · +72.6%
- By 2100
- 1,966,767 · +90.8%
Race, ethnicity, and origin ACS 2023
- Neighborhood character
- Diverse neighborhood (Simpson 0.68)
- Race & ethnicity
- White 45% Asian 32% Hispanic / Latino 13% Two or more races 12% Black 3%
- Hispanic origin (detail)
- Mexican 4%
- Common ancestry
- Lithuanian 3% Romanian 2% Italian 2%
- Foreign-born
- 36% · China, Canada, Vietnam
- Languages at home
- 59% English-only · Chinese 12% Spanish 9% Other Indo-European 5%
Political lean MEDSL · San Francisco
- 2024 margin
- Solid D (+64.8) · D 80.3% · R 15.5% · Other 4.1%
- 2008→2024 swing
- -5.7pp toward R · 2008: 70.5pp · 2024: 64.8pp
- All cycles
- 2024: D+64.8 2020: D+72.5 2016: D+76.1 2012: D+70.2 2008: D+70.5
Not yet ingested
- Civics
- —
Market trends
- HPI YoY
- ▲ 4.81%
- Current HPI
- 192.3569
- Rent YoY
- ▲ 18.89%
- Metro
- San Francisco-Oakland-Berkeley, CA
- State GDP YoY
- ▲ 3.21%
- F500 in state
- 116
Industry mix (Fortune 500 HQ in CA)
| Industry | F500 HQs | Revenue |
|---|---|---|
| Technology | 27 | $1,492B |
|
||
| Financial Services | 3 | $174B |
|
||
| Retail | 3 | $44B |
|
||
| Insurance | 3 | $26B |
|
||
| Media / Entertainment | 2 | $115B |
|
||
| Pharmaceuticals / Biotech | 2 | $62B |
|
||
Price history
+42.1% since first listed12 events — show timeline
- 2024-10-15 Listed $1,350,000 San Francisco MLS
- 2021-12-22 Sold (Public Records) $650,000 Public Records
- 2021-12-21 Sold (MLS) $650,000 San Francisco MLS
- 2021-12-21 Sold (MLS) $650,000 San Francisco MLS
- 2021-10-28 Price Changed $850,000 San Francisco MLS
- 2021-10-28 Listed $850,000 San Francisco MLS
- 2021-08-04 Listed $950,000 San Francisco MLS
- 2016-08-16 Sold (Public Records) $725,000 Public Records
- 2016-08-16 Sold (MLS) $725,000 San Francisco MLS
- 2016-06-23 Pending — San Francisco MLS
- 2016-05-09 Price Changed $850,000 San Francisco MLS
- 2016-03-04 Listed $950,000 San Francisco MLS
Property tax history
+10.7%/yrLatest (2025): $9,106 · +3.3% YoY. Source: county tax records.
Cash-flow waterfall
monthlySold comps — $/sqft
last 12 mo · ≤1 miLoading sold comps…