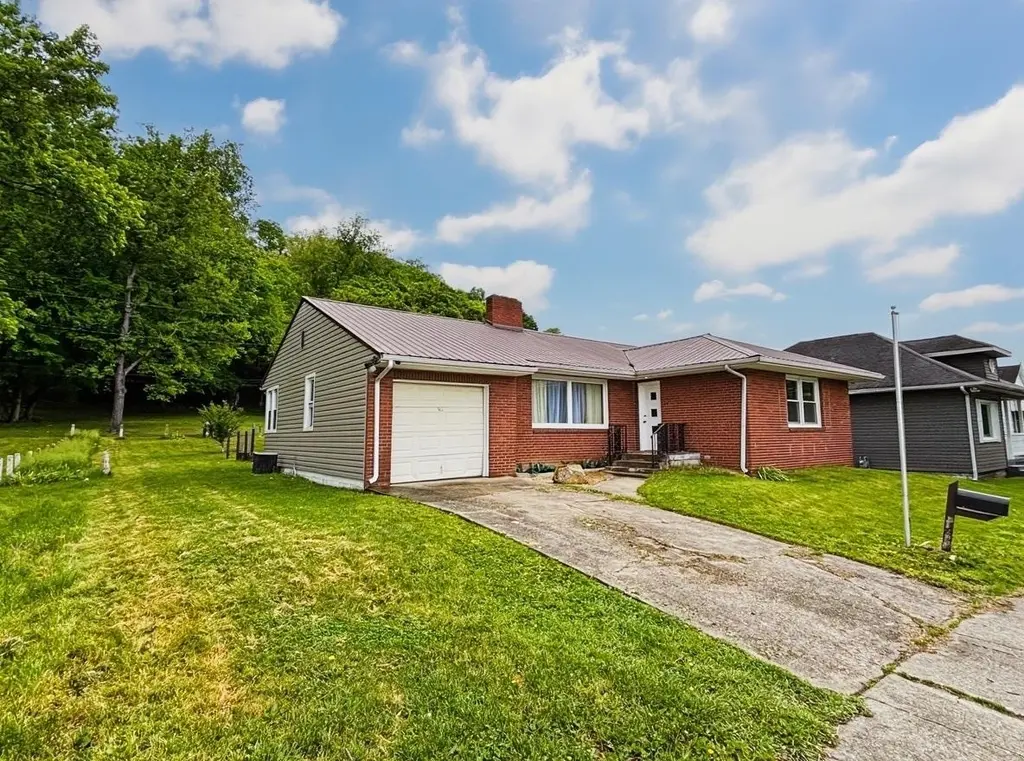
1209 S 10th St · Ironton, OH
Flood risk 4/10 · Minor
- FEMA flood zone
- X (unshaded)
- Chance of flooding over 30 yrs
- 0.24%
- Est. flood insurance / yr
- $473 – $860
Fire risk 5/10 · Moderate
- Est. fire insurance / yr
- $713 – $1,323
Heat risk 5/10 · Moderate
- Hot days now (above 102°F)
- 7 days/yr
- Hot days in 30 yrs
- 19 days/yr
Wind risk 2/10 · Minimal
- Chance of severe wind over 30 yrs
- 2.0%
Air-quality risk 2/10 · Minimal
- Unhealthy air days now
- 0 days/yr
- Unhealthy air days in 30 yrs
- 2 days/yr
Risk factors via First Street. Map © Google.
Why this score? — see what drove the D- grade
The composite is a weighted blend of 9 inputs, each scored 0–100. Each bar is that input's sub-score; the figure is the points it added to the 100-point composite (weight × sub-score).
- Cash flow +15.0/30.0
- DSCR +4.6/10.0
- Schools +4.6/10.0
- 1% rule +3.7/10.0
- Livability +3.6/5.0
- ARV discount +3.1/15.0
- Rent growth +2.5/5.0
- Condition / age +2.5/5.0
- Appreciation +0.0/10.0
$130,000
🖨 Deal sheet 📄 Offer letter ✓ Due diligence
Listing remarks MLS
This brick ranch with 1,300+ sq ft located in close proximity to nice amenities is available to purchase. This 3 bedroom & 1 bath home with full basement & 1 car attached garage has hardwood floors, spacious sized rooms, wood burning fireplace, breakfast nook & a large back yard.
Key facts
- Hardwood floors
- Updated bathroom
- 7,841 sq ft lot
Tags
Property features AI
Finance
- Other: Property type: Residential
- Financial info: No financial details provided
- HOA & community: No HOA information specified
Exterior
- Parking: Attached garage (1 car); Off-street parking
- Security: No security features specified
- Utilities: Public water; Public sewer
- Home design: Single-family residence; Single story
- Construction: Brick and vinyl siding exterior; Metal roof
- Exterior features: Deck; Porch; Level lot
Interior
- Kitchen: Dishwasher; Refrigerator
- Bedrooms: Bedrooms not specified
- Flooring: Vinyl flooring; Wood flooring
- Bathrooms: 1 full bathroom
- Heating & cooling: Central heating (natural gas); Central air conditioning; Has basement (full, unfinished)
- Interior features: Living room fireplace
- Laundry & utility: Washer/dryer not specified
Neighborhood map
What this means for you Summary
Snapshot
- This is a 3-bed/1.5-bath single-family listed at $130k.
Deal economics
- At list price, monthly cash flow is $41 ($490/yr) — positive.
- The deal already cash-flows at list — no discount required.
- To meet the 1% rule (rent ≥ 1% of price), the offer needs to be $113k (13.0% below list).
- Recommended offer: $113k (13.0% below list) — sets the bar for 1% rule.
- Cap rate 6.7% vs local median 5.1% in Ironton — top-decile yield for the area; either an underpriced asset or a hidden risk that comps aren't pricing in. Stress-test before assuming the spread holds.
Location & tenants
- Location reads 72/100 on livability (#354 in OH) — a middle-class / working-renter tenant base. Strengths: cost of living A+, health & safety A+, housing A-; Watch: amenities F, commute F, employment D-.
- Ironton City School District (suburban): math 54% / reading 58% proficiency, ranked #382 of 656 in OH (top 58%) — acceptable for families but not a draw, mixed tenant base, ~2y average lease.
- Market conditions: 84 active listings in the ZIP; 18 units permitted in Lawrence County in 2024 (0 in 5+ unit buildings).
Forward outlook
- Local home prices are declining (-3.0%/yr); year-one equity from $899 of loan paydown is wiped out by about $4k of value loss. Plan a longer hold.
- Lawrence County population projected at -22% by 2050 — secular population decline; favor cash flow + early exit over multi-decade hold.
Negotiation context
- Only 4 days on market — expect competitive offers; lowballing is unlikely to land.
- 4 sale attempts since 4y ago with the ask held roughly flat each time — persistent listings suggest the price (not the market) is what's stuck; bring a comps-based counter.
- Current owner paid $100k; 30% above their basis — modest negotiation headroom, anchor on the comps not their cost.
Risks & watch-outs
- Watch-outs: built in 1952 — expect roof / HVAC / electrical / plumbing capex.
- Climate carrying-cost: moderate wildfire risk; extreme-heat days projected 7→19/yr by 2055 (HVAC capex compounding) — expect insurance premiums to compound above CPI over the hold.
Questions for the listing agent
- Built in 1952 — when were the roof, HVAC, electrical panel, plumbing, and water heater last replaced?
- Is there a deadline driving the sale (1031 exchange, divorce, estate, relocation)? That informs how much negotiation room exists.
- Schools are B-rated — typically a magnet for longer-tenancy family renters. What's the average tenant stay here, and is there a school-zone premium baked into asking?
- The area grade is low — what's the realistic commute time and amenity access for the typical tenant pool here? Any planned neighborhood developments (good or bad) we should know about?
- What's the average days-on-market for RENTAL listings here right now (not sales)? A rising rental-DOM trend means longer vacancies and softer asking-rent achievability than the comps imply.
- What's the recent tenant-quality profile in this submarket — average credit score on applications, eviction rate, late-payment / NSF rate, and stable-employment percentage? A property-management company in the area should have these aggregated.
- How much new for-sale + rental construction is in the pipeline within 1–3 miles? Heavy new supply typically softens prices + rents 12–24 months out; constrained supply supports both.
Investment metrics
- 1% rule
- 0.87% ✗
- Cap rate
- 6.67%
- Cash-on-cash
- 1.35%
- DSCR
- 1.06
- GRM
- 9.6
CMA / ARV
- ARV (median comp)
- $118,384
- List price
- $130,000
- Delta
- 9.81%
- Verdict
- FAIR
- Comps
- 20 within 1.0 mi
Show comp detail 12 sales within ~0.75 mi
| Address | Dist | Beds/Ba | Sqft | Sold | Price | $/sf | Match |
|---|---|---|---|---|---|---|---|
| 914 S 8th Street St | 0.26mi | 3/1.0 | 1,315 (+1%) | 2mo | $62,500 | $48 | 83 |
| 913 South 8th St | 0.24mi | 3/2.5 | 1,296 (-1%) | 1mo | $207,000 | $160 | 83 |
| 1116 South 8th St | 0.17mi | 3/2.0 | 1,358 (+4%) | 3mo | $170,000 | $125 | 80 |
| 1222 Osage Ct | 0.19mi | 3/2.0 | 1,374 (+5%) | 8mo | $180,000 | $131 | 74 |
| 609 Spruce St | 0.25mi | 3/2.0 | 1,200 (-8%) | 1mo | $128,500 | $107 | 72 |
| 1703 S 5th St | 0.48mi | 3/1.5 | 1,296 (-1%) | 8mo | $185,000 | $143 | 70 |
| 1619 S 6th St | 0.41mi | 3/1.0 | 1,352 (+4%) | 4mo | $146,000 | $108 | 69 |
| 721 Chestnut St | 0.24mi | 3/1.0 | 1,410 (+8%) | 7mo | $1 | — | 67 |
| 914 Pine St St | 0.12mi | 3/1.0 | 1,113 (-15%) | 8mo | $75,000 | $67 | 61 |
| 323 Neal Ave | 0.63mi | 2/1.0 (-1) | 1,273 (-2%) | 2mo | $101,000 | $79 | 58 |
| 1412 S 4th St | 0.44mi | 3/1.0 | 1,136 (-13%) | 1mo | $128,600 | $113 | 55 |
| 707 Mastin Ave | 0.56mi | 3/2.0 | 1,200 (-8%) | 7mo | $165,000 | $138 | 52 |
Match score weights: distance 35% · size 25% · config 20% · recency 20%. Top-matched comps best support the ARV.
Projected returns pro-forma
-3.0% appreciation · 3.0% rent growth · sell at horizon
- IRR
- -14.2%
- Equity multiple
- 0.49×
- Total profit
- $-18,474
- Equity at exit
- $19,383
- IRR
- -5.4%
- Equity multiple
- 0.65×
- Total profit
- $-12,780
- Equity at exit
- $11,240
Cash invested: $36,400 (down + closing). Projections, not guarantees.
Landlord ↔ Tenant lean methodology
- Overall (STATE)
- 73 Landlord-Friendly
- State Ohio
- 73 Landlord-Friendly · R+6
- County
- — inherits STATE
- City
- — inherits STATE
ZIP-level market 45638
- Home prices YoY
- -19.6%
- Active inventory
- 84
- Price-to-rent
- 9.6×
Monthly cashflow live
- Estimated rent
- $1,131 medium interval (Pro) →
- Mortgage (P&I)
- −$682
- Tax from tax record
- −$117 /mo · $1,401/yr
- Insurance
- −$54
- HOA
- −$0
- Vacancy / Maint / Mgmt
- −$238
- Net cashflow
- $41
Break-even live
UW: 25.0% down · 7.5% · 30yr · 1.5% tax · 5.0% vac · 8.0% maint · 8.0% mgmt
Financing live
Cash to close
- Down payment
- $32,500
- Closing costs
- $3,900
- Reserves months
- —
- Total cash needed
- —
Loan-product check · same deal, 3 products live
Conventional
25% down · 7.5% · 30yr
- Down + closing
- —
- Monthly P&I
- —
- Monthly cashflow
- —
- DSCR
- —
- Eligible?
- —
Personal DTI + credit; lowest rate.
DSCR
20% down · 8.5% · 30yr
- Down + closing
- —
- Monthly P&I
- —
- Monthly cashflow
- —
- DSCR
- —
- Eligible?
- —
No personal income docs; deal must DSCR.
Hard money
10% down · 12.0% · 12mo
- Down + closing
- —
- Monthly P&I
- —
- Monthly cashflow
- —
- DSCR
- —
- Eligible?
- —
Short-term bridge; refi at stabilization.
Listing history 10 events
-
2026-05-02status Pending 804-char remark
-
2026-04-28$130,000 Active 804-char remark
-
2023-03-08soldstatus $100,000
-
2023-03-01soldstatus $100,000 Closed 298-char remark
Show marketing remark (298 chars)
This brick ranch with 1,300+ sq ft located in close proximity to nice amenities is available to purchase. This 3 bedroom & 1 bath home with full basement & 1 car attached garage has hardwood floors, spacious sized rooms, wood burning fireplace, breakfast nook & a large back yard.
-
2023-03-01soldstatus $100,000
Show marketing remark (298 chars)
This brick ranch with 1,300+ sq ft located in close proximity to nice amenities is available to purchase. This 3 bedroom & 1 bath home with full basement & 1 car attached garage has hardwood floors, spacious sized rooms, wood burning fireplace, breakfast nook & a large back yard.
-
2023-01-26historical Active Under Contract 298-char remark
Show marketing remark (298 chars)
This brick ranch with 1,300+ sq ft located in close proximity to nice amenities is available to purchase. This 3 bedroom & 1 bath home with full basement & 1 car attached garage has hardwood floors, spacious sized rooms, wood burning fireplace, breakfast nook & a large back yard.
-
2022-12-25status Active 298-char remark
Show marketing remark (298 chars)
This brick ranch with 1,300+ sq ft located in close proximity to nice amenities is available to purchase. This 3 bedroom & 1 bath home with full basement & 1 car attached garage has hardwood floors, spacious sized rooms, wood burning fireplace, breakfast nook & a large back yard.
-
2022-12-19historical Active Under Contract 298-char remark
Show marketing remark (298 chars)
This brick ranch with 1,300+ sq ft located in close proximity to nice amenities is available to purchase. This 3 bedroom & 1 bath home with full basement & 1 car attached garage has hardwood floors, spacious sized rooms, wood burning fireplace, breakfast nook & a large back yard.
-
2022-12-13$99,000 Active 298-char remark
Show marketing remark (298 chars)
This brick ranch with 1,300+ sq ft located in close proximity to nice amenities is available to purchase. This 3 bedroom & 1 bath home with full basement & 1 car attached garage has hardwood floors, spacious sized rooms, wood burning fireplace, breakfast nook & a large back yard.
-
2022-12-13$99,000
Show marketing remark (298 chars)
This brick ranch with 1,300+ sq ft located in close proximity to nice amenities is available to purchase. This 3 bedroom & 1 bath home with full basement & 1 car attached garage has hardwood floors, spacious sized rooms, wood burning fireplace, breakfast nook & a large back yard.
ⓘ Source: listings_history table (triggers on properties + properties_extension) + one-shot
backfill from property_details.listing_events for pre-trigger history.
Tax reassessment forecast OH · Partial reset (capped growth)
- Current annual tax
- $1,401 · $117/mo
- Projected year-2 tax
- $1,715 · $143/mo
- Expected delta
- +$313/yr (+$26/mo · 22.4%)
ⓘ Screening estimate from a state-policy table — verify with the county assessor before closing.
Climate risk First Street
- Flood 4/10 Moderate FEMA zone X (unshaded) · 24% chance over 30 yrs
- Wildfire 5/10 Major
- Heat 5/10 Major 7 d/yr ≥102°F today · 19 d/yr by 30 yrs out
- Wind 2/10 Low 2% chance of damaging wind over 30 yrs
- Air quality 2/10 Low 0 unhealthy d/yr today · 2 by 30 yrs out
Nearby sold comps map
Loading sold comps map…
Walkable amenities ~0.75 mi
Loading nearby amenities…
Taxation est. · year 1
- Rental income
- $13,573
- − Mortgage interest
- −$7,282
- − Property taxes
- −$1,401
- − Insurance
- −$650
- − Repairs & maintenance
- −$1,086
- − Management
- −$1,086
- − Depreciation
- −$3,782
- Taxable loss
- −$1,714
- Est. tax savings @ 24.0%
- +$411
- After-tax cash flow
- $902/yr
For passive investors: Depreciation is non-cash, so a rental often shows a tax loss while cash-flowing — sheltering income. Rental losses are passive: they offset passive income freely, and up to $25,000/yr can offset ordinary (W-2) income if you actively participate and your MAGI is under $100k (phasing out to $0 by $150k); unused losses carry forward. On sale, claimed depreciation is recaptured at up to 25%, and gains may owe capital-gains tax (a 1031 exchange can defer both). Figures are a year-1 estimate at your 24.0% rate — not tax advice; consult a CPA.
Schools (NCES district)
- District
- Ironton City School District
- NCES district ID
- 3904414
- Math proficiency
- 54% ▼ -10.00%
- Reading proficiency
- 58% ▼ -7.00%
- Median HH income
- $32,999
- Composite
- 46.13/100
- National rank
- #2505
- State rank
- #382 of 656 in OH
Livability — Ironton
- Score
- 72/100
- State rank
- #354
- US rank
- #5718
Category grades
Schools grade is shown separately in the Schools card above.
Census & demographics
- Census place
- Ironton, OH
- County
- Lawrence · 57,020 people
- Metro
- Huntington-Ashland, WV-KY-OH
- Population (ZIP)
- 19,921
- Household income
- $49,544
- Rent vs Own
- Severe rent burden
- 10.7
Population outlook (Lawrence County) Hauer SSP2
- Today (2025)
- 57,915 people
- By 2030
- 55,650 · -3.9%
- By 2040
- 50,523 · -12.8%
- By 2050
- 45,103 · -22.1%
- By 2075
- 32,441 · -44.0%
- By 2100
- 21,754 · -62.4%
Race, ethnicity, and origin ACS 2023
- Neighborhood character
- Predominantly White (95%)
- Race & ethnicity
- White 95% Two or more races 3% Black 1%
- Common ancestry
- Slovak 2% Iranian 2% Lithuanian 1%
- Foreign-born
- 0%
Political lean MEDSL · Lawrence
- 2024 margin
- Solid R (+50.5) · D 24.4% · R 74.9%
- 2008→2024 swing
- -35.2pp toward R · 2008: -15.3pp · 2024: -50.5pp
- All cycles
- 2024: R+50.5 2020: R+45.6 2016: R+43.9 2012: R+15.5 2008: R+15.3
Not yet ingested
- Civics
- —
Market trends
- HPI YoY
- ▼ -48.00%
- Current HPI
- 196.7459
- Rent YoY
- —
- Metro
- —
- State GDP YoY
- ▲ 1.98%
- F500 in state
- 48
Industry mix (Fortune 500 HQ in OH)
| Industry | F500 HQs | Revenue |
|---|---|---|
| Insurance | 3 | $145B |
|
||
| Industrial Machinery | 3 | $49B |
|
||
| Financial Services | 3 | $24B |
|
||
| Consumer Goods | 2 | $93B |
|
||
| Aerospace / Defense | 2 | $47B |
|
||
| Utilities | 2 | $33B |
|
||
Price history
+31.3% since first listed10 events — show timeline
- 2026-05-02 Pending — HBRMLS
- 2026-04-28 Listed $130,000 HBRMLS
- 2023-03-08 Sold (Public Records) $100,000 Public Records
- 2023-03-01 Sold (MLS) $100,000 HBRMLS
- 2023-03-01 Sold (MLS) $100,000 AABOR
- 2023-01-26 Contingent — AABOR
- 2022-12-25 Relisted — AABOR
- 2022-12-19 Contingent — AABOR
- 2022-12-13 Listed $99,000 HBRMLS
- 2022-12-13 Listed $99,000 AABOR
Property tax history
+7.0%/yrLatest (2025): $1,401 · +14.6% YoY. Source: county tax records.
Cash-flow waterfall
monthlySold comps — $/sqft
last 12 mo · ≤1 miLoading sold comps…