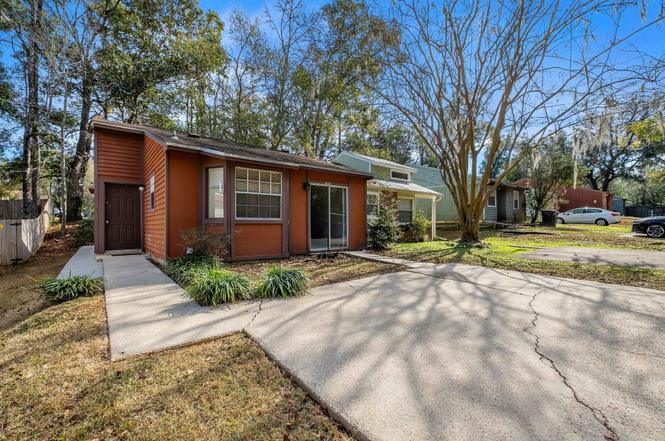
1047 Sutor Rd · Tallahassee, FL
Flood risk 1/10 · Minimal
- FEMA flood zone
- X (unshaded)
- Chance of flooding over 30 yrs
- 0.0%
- Est. flood insurance / yr
- $507 – $1,088
Fire risk 3/10 · Minor
- Est. fire insurance / yr
- $947 – $1,759
Heat risk 8/10 · Major
- Hot days now (above 108°F)
- 7 days/yr
- Hot days in 30 yrs
- 20 days/yr
Wind risk 9/10 · Severe
- Chance of severe wind over 30 yrs
- 99.0%
Air-quality risk 4/10 · Minor
- Unhealthy air days now
- 6 days/yr
- Unhealthy air days in 30 yrs
- 7 days/yr
Risk factors via First Street. Map © Google.
Why this score? — see what drove the B+ grade
The composite is a weighted blend of 9 inputs, each scored 0–100. Each bar is that input's sub-score; the figure is the points it added to the 100-point composite (weight × sub-score).
- Cash flow +30.0/30.0
- ARV discount +15.0/15.0
- DSCR +10.0/10.0
- 1% rule +9.7/10.0
- Schools +4.3/10.0
- Livability +4.3/5.0
- Rent growth +3.9/5.0
- Condition / age +2.5/5.0
- Appreciation +0.0/10.0
$125,000
🖨 Deal sheet 📄 Offer letter ✓ Due diligence
Listing remarks
Some photos have been virtually enhanced. Great opportunity for a first-time home buyer, investor, or anyone looking for an affordable one-story home. With very few single-story properties available at this price point, this one is worth a look. If you've seen it before, come back and check out the recent refresh, including wallpaper removal, freshly painted kitchen and bathroom cabinets, new bathroom flooring, and a bright, updated feel throughout. Major systems are in working order, making this a solid option for someone looking to move in now and add value over time. Roof replaced in 2009 and HVAC in 2014. This 2 bed/1 bath home includes a bonus room that can function as a third bedroom,
Key facts
- Open floor plan
- Hvac
- Bonus room
Tags
Property features AI
Finance
- Financial info: Offered for sale
Exterior
- Parking: Driveway
- Utilities: Public sewer
- Home design: Single-story; Fiber cement and wood siding construction
- Construction: Fiber cement siding; Wood siding
- Exterior features: Covered patio/porch; Patio; Porch; Private maintained road; Paved road
Interior
- Kitchen: Oven; Range; Dishwasher; Refrigerator
- Bedrooms: Bedroom 2 (13 x 10); Bedroom 3 (13 x 9)
- Flooring: Carpet; Vinyl
- Bathrooms: 1 full bathroom
- Heating & cooling: Central heating (electric); Central air; Ceiling fan(s)
- Interior features: End unit; Walk-in closet(s)
- Laundry & utility: Washer; Dryer; Utility room
Neighborhood map
What this means for you Summary
Snapshot
- This is a 3-bed/1.0-bath townhouse listed at $125k.
Deal economics
- At list price, monthly cash flow is $573 ($7k/yr) — positive.
- The deal already cash-flows at list — no discount required.
- Meets the 1% rule at list price ($2k rent vs $125k).
- Cap rate 11.8% vs local median 4.2% in Tallahassee — top-decile yield for the area; either an underpriced asset or a hidden risk that comps aren't pricing in. Stress-test before assuming the spread holds.
Location & tenants
- Location reads 86/100 on livability (#19 in FL, #429 nationally) — a professional / high-income tenant draw. Strengths: amenities A+, commute A+, health & safety A+; Watch: employment D.
- Leon (urban): math 48% / reading 53% proficiency, ranked #33 of 73 in FL (top 45%) — acceptable for families but not a draw, mixed tenant base, ~2y average lease.
- Market conditions: Rents rising fast (+5.5%/yr); 117 active listings in the ZIP; 4 comparable units currently listed for rent nearby; rentals leasing fast (median 14d on market — plan ~1-2 weeks tenant-placement turnaround); solid renter incomes; 1,765 units permitted in Leon County in 2024 (975 in 5+ unit buildings).
Forward outlook
- Local home prices are declining (-3.0%/yr); year-one equity from $864 of loan paydown is wiped out by about $4k of value loss. Plan a longer hold.
- Leon County population projected at +23% by 2050 — long-run rental-demand tailwind backs the buy-and-hold thesis.
- At projected returns (-3.0% appreciation + 5.5% rent growth), your $35k cash investment doubles in ~6 years — after that, you're playing with house money.
Negotiation context
- Only 1 days on market — expect competitive offers; lowballing is unlikely to land.
- 2 sale attempts with the ask held roughly flat each time — persistent listings suggest the price (not the market) is what's stuck; bring a comps-based counter.
Risks & watch-outs
- Climate carrying-cost: severe wind risk, 99% chance of damaging wind over 30y; extreme-heat days projected 7→20/yr by 2055 (HVAC capex compounding) — expect insurance premiums to compound above CPI over the hold.
Questions for the listing agent
- Is there a deadline driving the sale (1031 exchange, divorce, estate, relocation)? That informs how much negotiation room exists.
- Schools are B-rated — typically a magnet for longer-tenancy family renters. What's the average tenant stay here, and is there a school-zone premium baked into asking?
- What's the average days-on-market for RENTAL listings here right now (not sales)? A rising rental-DOM trend means longer vacancies and softer asking-rent achievability than the comps imply.
- What's the recent tenant-quality profile in this submarket — average credit score on applications, eviction rate, late-payment / NSF rate, and stable-employment percentage? A property-management company in the area should have these aggregated.
- How much new for-sale + rental construction is in the pipeline within 1–3 miles? Heavy new supply typically softens prices + rents 12–24 months out; constrained supply supports both.
Investment metrics
- 1% rule
- 1.47% ✓
- Cap rate
- 11.80%
- Cash-on-cash
- 19.65%
- DSCR
- 1.87
- GRM
- 5.7
CMA / ARV
- ARV (on-the-fly)
- $167,808
- Comps found
- 12
Show comp detail 12 sales within ~0.75 mi
| Address | Dist | Beds/Ba | Sqft | Sold | Price | $/sf | Match |
|---|---|---|---|---|---|---|---|
| 3725 Sutor Ct | 0.04mi | 2/1.0 (-1) | 912 (0%) | 4mo | $117,500 | $129 | 90 |
| 3729 Sutor Ct | 0.05mi | 2/1.0 (-1) | 920 (+1%) | 4mo | $117,500 | $128 | 88 |
| 3708 Rockbrook Dr Unit B | 0.18mi | 2/1.5 (-1) | 960 (+5%) | 4mo | $137,000 | $143 | 73 |
| 1018 Crossing Brook Way | 0.14mi | 2/1.0 (-1) | 992 (+9%) | 2mo | $128,000 | $129 | 73 |
| 3706 Aksarben Dr | 0.11mi | 2/1.5 (-1) | 992 (+9%) | 2mo | $135,000 | $136 | 72 |
| 3742 Rockbrook Dr | 0.21mi | 2/2.0 (-1) | 1,000 (+10%) | 1mo | $120,000 | $120 | 64 |
| 1160 Copper Creek Dr Unit A | 0.12mi | 2/2.0 (-1) | 1,008 (+10%) | 6mo | $185,000 | $184 | 63 |
| 1053 Copper Creek Dr | 0.20mi | 2/2.0 (-1) | 1,008 (+10%) | 3mo | $208,000 | $206 | 62 |
| 1064 Copper Creek Dr Unit B | 0.20mi | 2/2.0 (-1) | 1,008 (+10%) | 3mo | $204,000 | $202 | 62 |
| 1029 Copper Creek Dr | 0.23mi | 2/2.0 (-1) | 1,008 (+10%) | 5mo | $200,000 | $198 | 58 |
| 1187 Brafforton Way | 0.75mi | 2/2.0 (-1) | 964 (+6%) | 7mo | $180,000 | $187 | 41 |
| 1218 Brafforton Dr | 0.71mi | 2/2.0 (-1) | 1,008 (+10%) | 3mo | $215,000 | $213 | 38 |
Match score weights: distance 35% · size 25% · config 20% · recency 20%. Top-matched comps best support the ARV.
Projected returns pro-forma
-3.0% appreciation · 5.55% rent growth · sell at horizon
- IRR
- 14.6%
- Equity multiple
- 1.60×
- Total profit
- $21,142
- Equity at exit
- $18,638
- IRR
- 25.2%
- Equity multiple
- 3.47×
- Total profit
- $86,550
- Equity at exit
- $10,808
Cash invested: $35,000 (down + closing). Projections, not guarantees.
Landlord ↔ Tenant lean methodology
- Overall (STATE)
- 87 Strongly Landlord-Friendly
- State Florida
- 87 Strongly Landlord-Friendly · R+3
- County
- — inherits STATE
- City
- — inherits STATE
ZIP-level market 32311
- Home prices YoY
- -27.5%
- Rents YoY
- 5.5%
- Active inventory
- 117
- Price-to-rent
- 5.7×
Monthly cashflow live
- Estimated rent
- $1,843 medium interval (Pro) →
- Mortgage (P&I)
- −$656
- Tax from tax record
- −$175 /mo · $2,105/yr
- Insurance
- −$52
- HOA
- −$0
- Vacancy / Maint / Mgmt
- −$387
- Net cashflow
- $573
Break-even live
UW: 25.0% down · 7.5% · 30yr · 1.5% tax · 5.0% vac · 8.0% maint · 8.0% mgmt
Financing live
Cash to close
- Down payment
- $31,250
- Closing costs
- $3,750
- Reserves months
- —
- Total cash needed
- —
Loan-product check · same deal, 3 products live
Conventional
25% down · 7.5% · 30yr
- Down + closing
- —
- Monthly P&I
- —
- Monthly cashflow
- —
- DSCR
- —
- Eligible?
- —
Personal DTI + credit; lowest rate.
DSCR
20% down · 8.5% · 30yr
- Down + closing
- —
- Monthly P&I
- —
- Monthly cashflow
- —
- DSCR
- —
- Eligible?
- —
No personal income docs; deal must DSCR.
Hard money
10% down · 12.0% · 12mo
- Down + closing
- —
- Monthly P&I
- —
- Monthly cashflow
- —
- DSCR
- —
- Eligible?
- —
Short-term bridge; refi at stabilization.
Rent comps 4 comps
| Address | Beds | Baths | Sqft | Rent | $/sqft | DOM | Units | Dist |
|---|---|---|---|---|---|---|---|---|
| 3909 Reserve Dr Tallahassee, FL | 1.0–3.0 | 1.0–2.0 | 1220 | $1,825 | $1.50 | 13d | 1 | 0.24mi |
| 3373 Apalachee Pkwy Tallahassee, FL | 1.0–2.0 | 1.0–2.0 | 779 | $1,258 | $1.61 | 13d | 1 | 0.53mi |
| 2750 Old Saint Augustine Rd Tallahassee, FL | 1.0–3.0 | 1.0–2.0 | 1230 | $1,739 | $1.41 | 21d | 2 | 1.39mi |
| 1497 Wooster Dr Tallahassee, FL | 2.0–3.0 | 2.0–3.0 | 1238 | $2,165 | $1.75 | 13d | 6 | 1.48mi |
Listing history 15 events
-
2026-06-18pricedays on market $125,000 Active 1 DOM
-
2026-06-10days on market $129,900 Active 100 DOM
-
2026-06-09days on market $129,900 Active 99 DOM
-
2026-06-08days on market $129,900 Active 98 DOM
-
2026-06-07days on market $129,900 Active 97 DOM
-
2026-06-05days on market $129,900 Active 94 DOM
-
2026-06-03days on market $129,900 Active 93 DOM
-
2026-06-02days on market $129,900 Active 92 DOM
-
2026-06-01days on market $129,900 Active 91 DOM
-
2026-05-31days on market $129,900 Active 90 DOM
-
2026-05-30days on market $129,900 Active 89 DOM
-
2026-03-02$129,900 Active
-
2026-02-14historical Active Under Contract
-
2026-02-14historical
-
2026-01-31$129,900 Active
ⓘ Source: listings_history table (triggers on properties + properties_extension) + one-shot
backfill from property_details.listing_events for pre-trigger history.
Tax reassessment forecast FL · Resets to sale price
- Current annual tax
- $2,105 · $175/mo
- Projected year-2 tax
- $2,105 · $175/mo
- Expected delta
- $0/yr ($0/mo · 0.0%)
ⓘ Screening estimate from a state-policy table — verify with the county assessor before closing.
Climate risk First Street
- Flood 1/10 Low FEMA zone X (unshaded) · 0% chance over 30 yrs
- Wildfire 3/10 Moderate
- Heat 8/10 Severe 7 d/yr ≥108°F today · 20 d/yr by 30 yrs out
- Wind 9/10 Extreme 99% chance of damaging wind over 30 yrs
- Air quality 4/10 Moderate 6 unhealthy d/yr today · 7 by 30 yrs out
Nearby sold comps map
Loading sold comps map…
Walkable amenities ~0.75 mi
Loading nearby amenities…
Taxation est. · year 1
- Rental income
- $22,120
- − Mortgage interest
- −$7,002
- − Property taxes
- −$2,105
- − Insurance
- −$625
- − Repairs & maintenance
- −$1,770
- − Management
- −$1,770
- − Depreciation
- −$3,636
- Taxable income
- $5,212
- Est. tax owed @ 24.0%
- −$1,251
- After-tax cash flow
- $5,627/yr
For passive investors: Depreciation is non-cash, so a rental often shows a tax loss while cash-flowing — sheltering income. Rental losses are passive: they offset passive income freely, and up to $25,000/yr can offset ordinary (W-2) income if you actively participate and your MAGI is under $100k (phasing out to $0 by $150k); unused losses carry forward. On sale, claimed depreciation is recaptured at up to 25%, and gains may owe capital-gains tax (a 1031 exchange can defer both). Figures are a year-1 estimate at your 24.0% rate — not tax advice; consult a CPA.
Schools (NCES district)
- District
- Leon
- NCES district ID
- 1201110
- Math proficiency
- 48% ▼ -13.00%
- Reading proficiency
- 53% ▼ -5.00%
- Median HH income
- $46,339
- Composite
- 42.84/100
- National rank
- #3131
- State rank
- #33 of 73 in FL
Livability — Tallahassee
- Score
- 86/100
- State rank
- #19
- US rank
- #429
Category grades
Schools grade is shown separately in the Schools card above.
Census & demographics
- Census place
- Tallahassee, FL
- County
- Leon County · 294,472 people
- City population
- 294,472
- Metro
- Tallahassee, FL
- Population (ZIP)
- 21,905
- Household income
- $81,243
- Rent vs Own
- Severe rent burden
- 795.0
Population outlook (Leon County) Hauer SSP2
- Today (2025)
- 315,507 people
- By 2030
- 330,677 · +4.8%
- By 2040
- 358,465 · +13.6%
- By 2050
- 386,804 · +22.6%
- By 2075
- 465,480 · +47.5%
- By 2100
- 519,959 · +64.8%
Race, ethnicity, and origin ACS 2023
- Neighborhood character
- Diverse neighborhood (Simpson 0.64)
- Race & ethnicity
- White 52% Black 27% Two or more races 10% Hispanic / Latino 9% Asian 6%
- Hispanic origin (detail)
- Mexican 2% Puerto Rican 1% Cuban 1%
- Common ancestry
- Romanian 2% Serbian 2% Slovak 2%
- Foreign-born
- 11% · Canada, Jamaica
- Languages at home
- 86% English-only · Spanish 6% Other Indo-European 3% Other Asian/Pacific 2%
Political lean MEDSL · Leon
- 2024 margin
- Strong D (+21.8) · D 60.3% · R 38.5% · Other 1.2%
- 2008→2024 swing
- -2.5pp toward R · 2008: 24.3pp · 2024: 21.8pp
- All cycles
- 2024: D+21.8 2020: D+28.3 2016: D+25.1 2012: D+23.6 2008: D+24.3
Not yet ingested
- Civics
- —
Market trends
- HPI YoY
- ▼ -90.68%
- Current HPI
- 238.8804
- Rent YoY
- ▲ 5.55%
- Metro
- Tallahassee, FL
- State GDP YoY
- ▲ 3.28%
- F500 in state
- 36
Industry mix (Fortune 500 HQ in FL)
| Industry | F500 HQs | Revenue |
|---|---|---|
| Industrial Technology | 2 | $29B |
|
||
| Insurance | 2 | $17B |
|
||
| Retail | 1 | $60B |
|
||
| Technology Distribution | 1 | $58B |
|
||
| Homebuilding | 1 | $35B |
|
||
| Technology Manufacturing | 1 | $35B |
|
||
Price history
+0.0% since first listed4 events — show timeline
- 2026-03-02 Listed $129,900 CATRS
- 2026-02-14 Contingent — CATRS
- 2026-02-14 Listing Removed — CATRS
- 2026-01-31 Listed $129,900 CATRS
Property tax history
+50.2%/yrLatest (2025): $2,105 · +1833.3% YoY. Source: county tax records.
Cash-flow waterfall
monthlySold comps — $/sqft
last 12 mo · ≤1 miLoading sold comps…