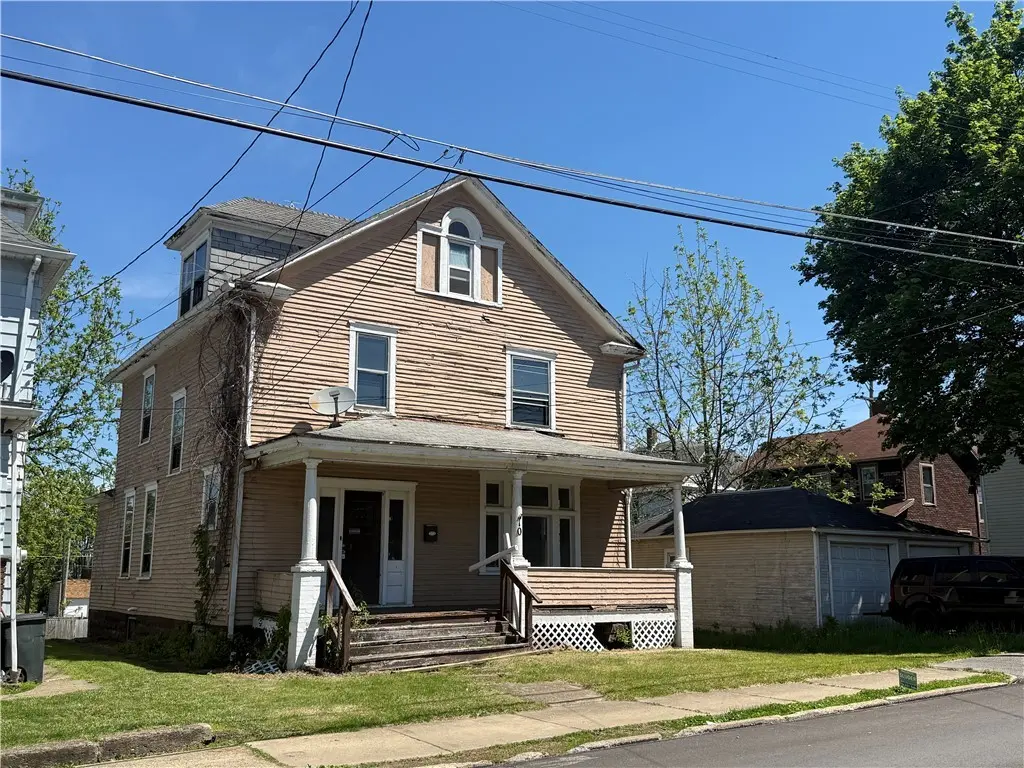
10 W Miller St · New Castle, PA
Flood risk 1/10 · Minimal
- FEMA flood zone
- X (unshaded)
- Chance of flooding over 30 yrs
- 0.0%
- Est. flood insurance / yr
- $473 – $860
Fire risk 1/10 · Minimal
- Est. fire insurance / yr
- $511 – $949
Heat risk 3/10 · Minor
- Hot days now (above 95°F)
- 7 days/yr
- Hot days in 30 yrs
- 18 days/yr
Wind risk 1/10 · Minimal
- Chance of severe wind over 30 yrs
- —
Air-quality risk 2/10 · Minimal
- Unhealthy air days now
- 1 days/yr
- Unhealthy air days in 30 yrs
- 3 days/yr
Risk factors via First Street. Map © Google.
Why this score? — see what drove the B+ grade
The composite is a weighted blend of 9 inputs, each scored 0–100. Each bar is that input's sub-score; the figure is the points it added to the 100-point composite (weight × sub-score).
- Cash flow +30.0/30.0
- ARV discount +15.0/15.0
- 1% rule +10.0/10.0
- DSCR +10.0/10.0
- Livability +4.1/5.0
- Rent growth +2.5/5.0
- Condition / age +2.5/5.0
- Schools +1.1/10.0
- Appreciation +0.0/10.0
$39,000
🖨 Deal sheet (PDF) 📄 Offer letter ✓ Due diligence
Listing remarks MLS
This large two-story home offers four generously sized bedrooms and one and a half baths, providing plenty of space for a variety of living needs. The first floor features a spacious living room and dining room, a large kitchen with an island, a convenient first-floor half bath, and laundry room. Upstairs, you’ll find four sizable bedrooms and a full bathroom. The walk-up attic includes two additional rooms, offering excellent potential for storage, home office space, or future finishing. The home is in need of TLC but presents a fantastic opportunity for an investor or owner-occupant ready to bring their vision to life. With its ample square footage and flexible layout, this property offers endless possibilities for renovation and value-add potential.
Key facts
- 4,573 sq ft lot
- 2 parking spots
- Built 1926
Neighborhood map
What this means for you Summary
Snapshot
- This is a 4-bed/1.0-bath single-family listed at $39k.
Deal economics
- At list price, monthly cash flow is $832 ($10k/yr) — positive.
- The deal already cash-flows at list — no discount required.
- Meets the 1% rule at list price ($1k rent vs $39k).
- Recommended offer: $34k (12.0% below list) — sets the bar for market timing.
- Cap rate 31.9% vs local median 10.1% in New Castle — top-decile yield for the area; either an underpriced asset or a hidden risk that comps aren't pricing in. Stress-test before assuming the spread holds.
Location & tenants
- Location reads 82/100 on livability (#137 in PA, #1,120 nationally) — a professional / high-income tenant draw. Strengths: crime A+, commute A+, cost of living A+; Watch: amenities F, employment F.
- New Castle Area SD (town): math 9% / reading 19% proficiency, ranked #519 of 539 in PA (top 96%) — low school quality limits family demand, transient renter base, plan for 1-2y turnover; 66% free/reduced lunch — lower-income household profile, screen leases tightly.
- Zoned schools: Harry W Lockley Early Learning Center (775 students, 100% FRL); New Castle Jhs (math 6% / reading 21%, grade F, #482 of 512 statewide, top 94%, 706 students, 100% FRL); New Castle Shs (math 47% / reading 30%, grade F, #280 of 437 statewide, top 64%, 771 students, 100% FRL) — zoned schools average 100% FRL vs 66% district-wide (33 pts higher); higher-poverty schools than district average — tighter screening recommended.
- Zoned-school proficiency averages 26% at this address vs 14% district-wide (+12 pts) — the actual schools serving this property are materially stronger than the New Castle Area SD average implies; a family-tenant draw the district grade alone would hide.
- Market conditions: 17 active listings in the ZIP; 6 comparable units currently listed for rent nearby; rentals lingering (median 46d on market — plan ~5-8 weeks vacancy on turnover, expect pricing pressure); 100% of comp listings sitting > 30 days — soft ceiling on asking rent; 51 units permitted in Lawrence County in 2024 (0 in 5+ unit buildings).
Forward outlook
- Local home prices are declining (-3.0%/yr); year-one equity from $270 of loan paydown is wiped out by about $1k of value loss. Plan a longer hold.
- Lawrence County population projected at -25% by 2050 — secular population decline; favor cash flow + early exit over multi-decade hold.
- At projected returns (-3.0% appreciation + 3.0% rent growth), your $11k cash investment doubles in ~2 years — after that, you're playing with house money.
Negotiation context
- It's been on market 167 days — a 12% lower offer ($34k) is reasonable based on typical stale-listing flexibility.
- 4 sale attempts since 17y ago with the ask held roughly flat each time — persistent listings suggest the price (not the market) is what's stuck; bring a comps-based counter.
- Current owner paid $9k; list at $39k implies a 333% gain — meaningful room to come down on a strong offer.
Risks & watch-outs
- Watch-outs: property tax is 3.1% of price; built in 1926 — expect roof / HVAC / electrical / plumbing capex.
Questions for the listing agent
- It's been on market 167 days. Have you received any prior offers? Is the seller open to a 12% concession, seller financing, or rate buy-down credit?
- Built in 1926 — when were the roof, HVAC, electrical panel, plumbing, and water heater last replaced?
- Property tax is high relative to price — has the assessment been appealed recently, and will the sale trigger a re-assessment?
- Why hasn't it sold? Are there any deal-killer items the seller is aware of (foundation, flood, title, zoning, code violations)?
- Is there a deadline driving the sale (1031 exchange, divorce, estate, relocation)? That informs how much negotiation room exists.
- What's the average days-on-market for RENTAL listings here right now (not sales)? A rising rental-DOM trend means longer vacancies and softer asking-rent achievability than the comps imply.
- What's the recent tenant-quality profile in this submarket — average credit score on applications, eviction rate, late-payment / NSF rate, and stable-employment percentage? A property-management company in the area should have these aggregated.
- How much new for-sale + rental construction is in the pipeline within 1–3 miles? Heavy new supply typically softens prices + rents 12–24 months out; constrained supply supports both.
Investment metrics
- 1% rule
- 3.75% ✓
- Cap rate
- 31.91%
- Cash-on-cash
- 91.47%
- DSCR
- 5.07
- GRM
- 2.2
CMA / ARV
- ARV (median comp)
- $59,385
- List price
- $39,000
- Delta
- -34.33%
- Verdict
- UNDERPRICED
- Comps
- 20 within 1.0 mi
Show comp detail 12 sales within ~0.75 mi
| Address | Dist | Beds/Ba | Sqft | Sold | Price | $/sf | Match |
|---|---|---|---|---|---|---|---|
| 1708 Moravia St | 0.21mi | 3/2.0 (-1) | 1,824 (+6%) | 4mo | $43,500 | $24 | 68 |
| 1801 Hanna St | 0.12mi | 4/1.0 | 1,932 (+12%) | 15mo | $110,000 | $57 | 62 |
| 1605 S Jefferson St | 0.05mi | 3/1.0 (-1) | 1,500 (-13%) | 12mo | $48,900 | $33 | 61 |
| 1918 Morris | 0.24mi | 3/3.0 (-1) | 1,750 (+1%) | 16mo | $219,900 | $126 | 61 |
| 9 W Fulton St | 0.14mi | 3/1.5 (-1) | 1,600 (-7%) | 19mo | $16,000 | $10 | 58 |
| 28 W Chartes St | 0.08mi | 3/1.5 (-1) | 1,560 (-10%) | 22mo | $60,000 | $38 | 55 |
| 407 E Lutton St | 0.65mi | 4/1.0 | 1,665 (-4%) | 13mo | $53,000 | $32 | 53 |
| 1930 Morris St | 0.28mi | 3/2.0 (-1) | 1,533 (-11%) | 10mo | $143,330 | $93 | 50 |
| 1512 S Jefferson St | 0.07mi | 3/1.0 (-1) | 1,488 (-14%) | 23mo | $64,000 | $43 | 50 |
| 1604 Morris St | 0.14mi | 3/1.0 (-1) | 1,476 (-15%) | 18mo | $17,000 | $12 | 49 |
| 111 E Tempalena Ave | 0.40mi | 3/1.5 (-1) | 1,480 (-14%) | 20mo | $165,000 | $111 | 34 |
| 503 E Lutton St | 0.70mi | 3/1.5 (-1) | 1,492 (-14%) | 6mo | $66,000 | $44 | 33 |
Match score weights: distance 35% · size 25% · config 20% · recency 20%. Top-matched comps best support the ARV.
Projected returns pro-forma
-3.0% appreciation · 3.0% rent growth · sell at horizon
- IRR
- 92.2%
- Equity multiple
- 5.28×
- Total profit
- $46,752
- Equity at exit
- $5,815
- IRR
- 95.1%
- Equity multiple
- 11.00×
- Total profit
- $109,200
- Equity at exit
- $3,372
Cash invested: $10,920 (down + closing). Projections, not guarantees.
Landlord ↔ Tenant lean methodology
- Overall (STATE)
- 62 Landlord-Friendly
- State Pennsylvania
- 62 Landlord-Friendly · EVEN
- County
- — inherits STATE
- City
- — inherits STATE
ZIP-level market 16102
- Home prices YoY
- -9.6%
- Active inventory
- 17
- Price-to-rent
- 2.2×
Monthly cashflow live
- Estimated rent
- $1,462 high interval (Pro) →
- Mortgage (P&I)
- −$205
- Tax from tax record
- −$102 /mo · $1,224/yr
- Insurance
- −$16
- HOA
- −$0
- Lot rent
- −$0
- Vacancy / Maint / Mgmt
- −$307
- Net cashflow
- $832
Break-even live
Sensitivity live
| Price | -10% $854 | -5% $843 | +0% $832 | +5% $821 | +10% $810 |
|---|---|---|---|---|---|
| Rent | -10% $717 | -5% $775 | +0% $832 | +5% $890 | +10% $948 |
| Rate | -1.0pp $852 | -0.5pp $842 | base $832 | +0.5pp $822 | +1.0pp $812 |
UW: 25.0% down · 7.5% · 30yr · 1.5% tax · 5.0% vac · 8.0% maint · 8.0% mgmt
Financing live
Cash to close
- Down payment
- $9,750
- Closing costs
- $1,170
- Reserves months
- —
- Total cash needed
- —
Loan-product check · same deal, 3 products live
Conventional
25% down · 7.5% · 30yr
- Down + closing
- —
- Monthly P&I
- —
- Monthly cashflow
- —
- DSCR
- —
- Eligible?
- —
Personal DTI + credit; lowest rate.
DSCR
20% down · 8.5% · 30yr
- Down + closing
- —
- Monthly P&I
- —
- Monthly cashflow
- —
- DSCR
- —
- Eligible?
- —
No personal income docs; deal must DSCR.
Hard money
10% down · 12.0% · 12mo
- Down + closing
- —
- Monthly P&I
- —
- Monthly cashflow
- —
- DSCR
- —
- Eligible?
- —
Short-term bridge; refi at stabilization.
Rent comps 6 comps
| Address | Beds | Baths | Sqft | Rent | $/sqft | DOM | Units | Dist |
|---|---|---|---|---|---|---|---|---|
| 1605 S Jefferson St New Castle, PA | 3.0 | 1.0 | 1500 | $1,500 | $1.00 | 46d | 1 | 0.04mi |
| 1708 Moravia St New Castle, PA | 3.0 | 2.0 | 1500 | $1,500 | $1.00 | 46d | 1 | 0.23mi |
| 712 E Reynolds St New Castle, PA | 3.0 | 1.0 | 1182 | $975 | $0.82 | 46d | 1 | 0.76mi |
| 1510 Huron Ave New Castle, PA | 3.0 | 1.0 | 1560 | $1,475 | $0.95 | 46d | 1 | 1.11mi |
| 932 Morton St New Castle, PA | 3.0 | 1.0 | 1440 | $1,375 | $0.95 | 46d | 1 | 1.17mi |
| 1056 Adams St New Castle, PA | 3.0 | 1.0 | 1116 | $1,500 | $1.34 | 46d | 1 | 1.48mi |
Listing history 26 events
-
2026-06-22days on market $39,000 Active 167 DOM
-
2026-06-21days on market $39,000 Active 166 DOM
-
2026-06-19days on market $39,000 Active 164 DOM
-
2026-06-18days on market $39,000 Active 163 DOM
-
2026-06-17days on market $39,000 Active 162 DOM
-
2026-06-16days on market $39,000 Active 161 DOM
-
2026-06-15days on market $39,000 Active 160 DOM
-
2026-06-14days on market $39,000 Active 158 DOM
-
2026-06-12days on market $39,000 Active 157 DOM
-
2026-06-09days on market $39,000 Active 154 DOM
-
2026-06-08days on market $39,000 Active 153 DOM
-
2026-06-07days on market $39,000 Active 152 DOM
-
2026-06-03days on market $39,000 Active 148 DOM
-
2026-06-02days on market $39,000 Active 147 DOM
-
2026-06-01days on market $39,000 Active 146 DOM
-
2026-05-31days on market $39,000 Active 145 DOM
-
2026-05-30days on market $39,000 Active 144 DOM
-
2026-01-06$39,000 Active 768-char remark
Show marketing remark (768 chars)
This large two-story home offers four generously sized bedrooms and one and a half baths, providing plenty of space for a variety of living needs. The first floor features a spacious living room and dining room, a large kitchen with an island, a convenient first-floor half bath, and laundry room. Upstairs, you’ll find four sizable bedrooms and a full bathroom. The walk-up attic includes two additional rooms, offering excellent potential for storage, home office space, or future finishing. The home is in need of TLC but presents a fantastic opportunity for an investor or owner-occupant ready to bring their vision to life. With its ample square footage and flexible layout, this property offers endless possibilities for renovation and value-add potential.
-
2025-04-02historical Expired 106-char remark
Show marketing remark (106 chars)
Large home offering spacious room sizes, located in New Castle. Currently being used as a rental property.
-
2025-02-04status Active 106-char remark
Show marketing remark (106 chars)
Large home offering spacious room sizes, located in New Castle. Currently being used as a rental property.
-
2024-04-08historical Contingent 106-char remark
Show marketing remark (106 chars)
Large home offering spacious room sizes, located in New Castle. Currently being used as a rental property.
-
2024-04-03$39,900 Active 106-char remark
Show marketing remark (106 chars)
Large home offering spacious room sizes, located in New Castle. Currently being used as a rental property.
-
2009-06-24price $9,900
-
2009-06-24soldstatus $9,000
-
2009-04-03$9,000
-
1998-11-25soldstatus $32,000
ⓘ Source: listings_history table (triggers on properties + properties_extension) + one-shot
backfill from property_details.listing_events for pre-trigger history.
Tax reassessment forecast PA · Partial reset (capped growth)
- Current annual tax
- $1,224 · $102/mo
- Projected year-2 tax
- $1,224 · $102/mo
- Expected delta
- $0/yr ($0/mo · 0.0%)
ⓘ Screening estimate from a state-policy table — verify with the county assessor before closing.
Climate risk First Street
- Flood 1/10 Low FEMA zone X (unshaded) · 0% chance over 30 yrs
- Wildfire 1/10 Low
- Heat 3/10 Moderate 7 d/yr ≥95°F today · 18 d/yr by 30 yrs out
- Wind 1/10 Low
- Air quality 2/10 Low 1 unhealthy d/yr today · 3 by 30 yrs out
Nearby sold comps map
Loading sold comps map…
Walkable amenities ~0.75 mi
Loading nearby amenities…
Taxation est. · year 1
- Rental income
- $17,547
- − Mortgage interest
- −$2,185
- − Property taxes
- −$1,224
- − Insurance
- −$195
- − Repairs & maintenance
- −$1,404
- − Management
- −$1,404
- − Depreciation
- −$1,135
- Taxable income
- $10,001
- Est. tax owed @ 24.0%
- −$2,400
- After-tax cash flow
- $7,589/yr
For passive investors: Depreciation is non-cash, so a rental often shows a tax loss while cash-flowing — sheltering income. Rental losses are passive: they offset passive income freely, and up to $25,000/yr can offset ordinary (W-2) income if you actively participate and your MAGI is under $100k (phasing out to $0 by $150k); unused losses carry forward. On sale, claimed depreciation is recaptured at up to 25%, and gains may owe capital-gains tax (a 1031 exchange can defer both). Figures are a year-1 estimate at your 24.0% rate — not tax advice; consult a CPA.
Schools (NCES district)
- District
- New Castle Area SD
- NCES district ID
- 4216620
- Math proficiency
- 9% ▼ -13.00%
- Reading proficiency
- 19% ▼ -23.00%
- Median HH income
- $30,967
- Composite
- 11.08/100
- National rank
- #9736
- State rank
- #519 of 539 in PA
Livability — New Castle
- Score
- 82/100
- State rank
- #137
- US rank
- #1120
Category grades
Schools grade is shown separately in the Schools card above.
Census & demographics
- Census place
- New Castle, PA
- City population
- 30,767
- Population (ZIP)
- 4,933
Population outlook (Lawrence County) Hauer SSP2
- Today (2025)
- 81,781 people
- By 2030
- 77,978 · -4.7%
- By 2040
- 69,522 · -15.0%
- By 2050
- 61,344 · -25.0%
- By 2075
- 45,027 · -44.9%
- By 2100
- 31,305 · -61.7%
Race, ethnicity, and origin ACS 2023
- Neighborhood character
- Predominantly White (91%)
- Race & ethnicity
- White 91% Two or more races 6% Black 2%
- Common ancestry
- Romanian 11% Serbian 3% Slovak 2%
- Foreign-born
- 0%
- Languages at home
- 98% English-only · German/W. Germanic 1% Other Indo-European 1%
Political lean MEDSL · Lawrence
- 2024 margin
- Solid R (+33.8) · D 32.8% · R 66.5%
- 2008→2024 swing
- -28.7pp toward R · 2008: -5.1pp · 2024: -33.8pp
- All cycles
- 2024: R+33.8 2020: R+29.6 2016: R+28.1 2012: R+9.0 2008: R+5.1
Not yet ingested
- Civics
- —
Market trends
- HPI YoY
- ▼ -16.16%
- Current HPI
- 153.0061
- Rent YoY
- —
- Metro
- —
- State GDP YoY
- ▲ 1.68%
- F500 in state
- 34
Industry mix (Fortune 500 HQ in PA)
| Industry | F500 HQs | Revenue |
|---|---|---|
| Healthcare | 2 | $309B |
|
||
| Insurance | 2 | $27B |
|
||
| Telecommunications / Media | 1 | $124B |
|
||
| Industrial Distribution | 1 | $22B |
|
||
| Financial Services | 1 | $20B |
|
||
| Chemicals / Materials | 1 | $18B |
|
||
Price history
+21.9% since first listed9 events — show timeline
- 2026-01-06 Listed $39,000 West Penn MLS
- 2025-04-02 Delisted — West Penn MLS
- 2025-02-04 Relisted — West Penn MLS
- 2024-04-08 Contingent — West Penn MLS
- 2024-04-03 Listed $39,900 West Penn MLS
- 2009-06-24 Sold (MLS) $9,000 West Penn MLS
- 2009-06-24 Price Changed $9,900 West Penn MLS
- 2009-04-03 Listed $9,000 West Penn MLS
- 1998-11-25 Sold (Public Records) $32,000 Public Records
Property tax history
+1.2%/yrLatest (2025): $1,224 · -0.5% YoY. Source: county tax records.
Cash-flow waterfall
monthlySold comps — $/sqft
last 12 mo · ≤1 miLoading sold comps…