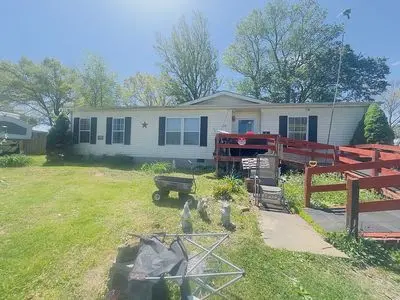
153 Devona Ln · Eubank, KY
Flood risk 1/10 · Minimal
- FEMA flood zone
- X
- Chance of flooding over 30 yrs
- 0.0%
- Est. flood insurance / yr
- $435 – $905
Fire risk 2/10 · Minimal
- Est. fire insurance / yr
- $839 – $1,559
Heat risk 4/10 · Minor
- Hot days now (above threshold)
- 7 days/yr
- Hot days in 30 yrs
- 19 days/yr
Wind risk No data
- Chance of severe wind over 30 yrs
- —
Air-quality risk No data
- Unhealthy air days now
- —
- Unhealthy air days in 30 yrs
- —
Risk factors via First Street. Map © Google.
Why this score? — see what drove the D+ grade
The composite is a weighted blend of 9 inputs, each scored 0–100. Each bar is that input's sub-score; the figure is the points it added to the 100-point composite (weight × sub-score).
- Cash flow +20.8/30.0
- DSCR +6.6/10.0
- Appreciation +6.1/10.0
- 1% rule +5.5/10.0
- Livability +3.2/5.0
- Rent growth +2.5/5.0
- Condition / age +2.5/5.0
- Schools +2.3/10.0
- ARV discount +0.0/15.0
$150,000
🖨 Deal sheet (PDF) 📄 Offer letter ✓ Due diligence
Listing remarks
## Peaceful Country Living Meets Modern Versatility! Escape the noise and settle into this charming * * 3-bedroom, 2-bath * * home nestled on a beautiful * * . 38-acre lot * * . If you & acirc; & euro; & trade; ve been dreaming of quiet mornings and starry nights with plenty of room for your hobbies, this is the one. * * The Highlights: * * * * * Flexible Space: * * The standout feature is a spacious add-on room. Whether you need a 4th bedroom, a massive walk-in closet, a dedicated home gym, or the ultimate game room & acirc; & euro; & rdquo; the choice is yours! * * * Accessibility & amp; Ease: * * This home is designed for everyone. With
Key facts
- Spacious add-on room
- Outside storage shed
- Sturdy ramps
Tags
Neighborhood map
What this means for you Summary
Snapshot
- This is a 3-bed/2.0-bath single-family listed at $150k.
Deal economics
- At list price, monthly cash flow is $205 ($2k/yr) — positive.
- The deal already cash-flows at list — no discount required.
- Meets the 1% rule at list price ($2k rent vs $150k).
- Cap rate 7.9% vs local median 4.7% in Eubank — top-decile yield for the area; either an underpriced asset or a hidden risk that comps aren't pricing in. Stress-test before assuming the spread holds.
Location & tenants
- Location reads 65/100 on livability (#262 in KY) — a middle-class / working-renter tenant base. Strengths: crime A+, cost of living A+, housing A+; Watch: amenities F, commute F, employment F.
- Lincoln County (rural): math 20% / reading 35% proficiency, ranked #131 of 165 in KY (top 79%) — low school quality limits family demand, transient renter base, plan for 1-2y turnover.
- Zoned schools: Waynesburg Elementary School (math 12% / reading 27%, grade F, #572 of 676 statewide, top 88%, 190 students, 83% FRL); Lincoln County Middle School (math 18% / reading 38%, grade F, #165 of 217 statewide, top 77%, 745 students, 67% FRL); Lincoln County High School (math 24% / reading 32%, grade F, #151 of 254 statewide, top 61%, 951 students, 63% FRL).
- Market conditions: 37 active listings in the ZIP; 91 units permitted in Lincoln County in 2024 (0 in 5+ unit buildings).
Forward outlook
- In year one you build about $4k of equity ($1k loan paydown + $3k appreciation (2.3% local appreciation)).
- Lincoln County population projected at -23% by 2050 — secular population decline; favor cash flow + early exit over multi-decade hold.
- At projected returns (2.3% appreciation + 3.0% rent growth), your $42k cash investment doubles in ~6 years — after that, you're playing with house money.
- By year 8, paydown + projected appreciation supports a ~$33k cash-out refi (75% LTV) — recoverable capital for the next deal without selling this one.
Negotiation context
- Only 14 days on market — expect competitive offers; lowballing is unlikely to land.
Questions for the listing agent
- Is there a deadline driving the sale (1031 exchange, divorce, estate, relocation)? That informs how much negotiation room exists.
- The area grade is low — what's the realistic commute time and amenity access for the typical tenant pool here? Any planned neighborhood developments (good or bad) we should know about?
- What's the average days-on-market for RENTAL listings here right now (not sales)? A rising rental-DOM trend means longer vacancies and softer asking-rent achievability than the comps imply.
- What's the recent tenant-quality profile in this submarket — average credit score on applications, eviction rate, late-payment / NSF rate, and stable-employment percentage? A property-management company in the area should have these aggregated.
- How much new for-sale + rental construction is in the pipeline within 1–3 miles? Heavy new supply typically softens prices + rents 12–24 months out; constrained supply supports both.
Investment metrics
- 1% rule
- 1.05% ✓
- Cap rate
- 7.94%
- Cash-on-cash
- 5.87%
- DSCR
- 1.26
- GRM
- 8.0
CMA / ARV
- ARV (median comp)
- $106,981
- List price
- $150,000
- Delta
- 40.21%
- Verdict
- OVERPRICED
- Comps
- 4 within 2.0 mi
Projected returns pro-forma
2.28% appreciation · 3.0% rent growth · sell at horizon
- IRR
- 11.1%
- Equity multiple
- 1.61×
- Total profit
- $25,554
- Equity at exit
- $61,461
- IRR
- 13.8%
- Equity multiple
- 2.90×
- Total profit
- $79,893
- Equity at exit
- $90,305
Cash invested: $42,000 (down + closing). Projections, not guarantees.
Landlord ↔ Tenant lean methodology
- Overall (STATE)
- 83 Strongly Landlord-Friendly
- State Kentucky
- 83 Strongly Landlord-Friendly · R+16
- County
- — inherits STATE
- City
- — inherits STATE
ZIP-level market 42567
- Home prices YoY
- 0.9%
- Active inventory
- 37
- Price-to-rent
- 8.0×
Monthly cashflow live
- Estimated rent
- $1,572 medium interval (Pro) →
- Mortgage (P&I)
- −$787
- Tax est. 1.5%
- −$188 /mo · $2,250/yr
- Insurance
- −$62
- HOA
- −$0
- Vacancy / Maint / Mgmt
- −$330
- Net cashflow
- $205
Break-even live
Sensitivity live
| Price | -10% $309 | -5% $257 | +0% $205 | +5% $154 | +10% $102 |
|---|---|---|---|---|---|
| Rent | -10% $81 | -5% $143 | +0% $205 | +5% $268 | +10% $330 |
| Rate | -1.0pp $281 | -0.5pp $244 | base $205 | +0.5pp $167 | +1.0pp $127 |
UW: 25.0% down · 7.5% · 30yr · 1.5% tax · 5.0% vac · 8.0% maint · 8.0% mgmt
Financing live
Cash to close
- Down payment
- $37,500
- Closing costs
- $4,500
- Reserves months
- —
- Total cash needed
- —
Loan-product check · same deal, 3 products live
Conventional
25% down · 7.5% · 30yr
- Down + closing
- —
- Monthly P&I
- —
- Monthly cashflow
- —
- DSCR
- —
- Eligible?
- —
Personal DTI + credit; lowest rate.
DSCR
20% down · 8.5% · 30yr
- Down + closing
- —
- Monthly P&I
- —
- Monthly cashflow
- —
- DSCR
- —
- Eligible?
- —
No personal income docs; deal must DSCR.
Hard money
10% down · 12.0% · 12mo
- Down + closing
- —
- Monthly P&I
- —
- Monthly cashflow
- —
- DSCR
- —
- Eligible?
- —
Short-term bridge; refi at stabilization.
Listing history 1 events
-
2026-05-12$150,000 Active 1530-char remark
ⓘ Source: listings_history table (triggers on properties + properties_extension) + one-shot
backfill from property_details.listing_events for pre-trigger history.
Climate risk First Street
- Flood 1/10 Low FEMA zone X · 0% chance over 30 yrs
- Wildfire 2/10 Low
- Heat 4/10 Moderate
Nearby sold comps map
Loading sold comps map…
Walkable amenities ~0.75 mi
Loading nearby amenities…
Taxation est. · year 1
- Rental income
- $18,867
- − Mortgage interest
- −$8,402
- − Property taxes
- −$2,250
- − Insurance
- −$750
- − Repairs & maintenance
- −$1,509
- − Management
- −$1,509
- − Depreciation
- −$4,364
- Taxable income
- $82
- Est. tax owed @ 24.0%
- −$20
- After-tax cash flow
- $2,446/yr
For passive investors: Depreciation is non-cash, so a rental often shows a tax loss while cash-flowing — sheltering income. Rental losses are passive: they offset passive income freely, and up to $25,000/yr can offset ordinary (W-2) income if you actively participate and your MAGI is under $100k (phasing out to $0 by $150k); unused losses carry forward. On sale, claimed depreciation is recaptured at up to 25%, and gains may owe capital-gains tax (a 1031 exchange can defer both). Figures are a year-1 estimate at your 24.0% rate — not tax advice; consult a CPA.
Schools (NCES district)
- District
- Lincoln County
- NCES district ID
- 2103480
- Math proficiency
- 20% ▼ -18.00%
- Reading proficiency
- 35% ▼ -16.00%
- Median HH income
- $35,356
- Composite
- 22.68/100
- National rank
- #8042
- State rank
- #131 of 165 in KY
Livability — Eubank
- Score
- 65/100
- State rank
- #262
- US rank
- #12947
Category grades
Schools grade is shown separately in the Schools card above.
Census & demographics
- Population (ZIP)
- 5,150
Population outlook (Lincoln County) Hauer SSP2
- Today (2025)
- 23,293 people
- By 2030
- 22,392 · -3.9%
- By 2040
- 20,336 · -12.7%
- By 2050
- 18,016 · -22.7%
- By 2075
- 12,976 · -44.3%
- By 2100
- 8,446 · -63.7%
Race, ethnicity, and origin ACS 2023
- Neighborhood character
- Predominantly White (92%)
- Race & ethnicity
- White 92% Two or more races 5% Hispanic / Latino 3%
- Common ancestry
- Lithuanian 2% Italian 2% Slovak 1%
- Foreign-born
- 2% · Canada
- Languages at home
- 96% English-only · Spanish 3% German/W. Germanic 2%
Political lean MEDSL · Lincoln
- 2024 margin
- Solid R (+61.2) · D 18.9% · R 80.0% · Other 1.1%
- 2008→2024 swing
- -22.7pp toward R · 2008: -38.5pp · 2024: -61.2pp
- All cycles
- 2024: R+61.2 2020: R+57.1 2016: R+57.3 2012: R+41.9 2008: R+38.5
Not yet ingested
- Civics
- —
Market trends
- HPI YoY
- ▲ 2.28%
- Current HPI
- 263.9851
- Rent YoY
- —
- Metro
- —
- State GDP YoY
- ▲ 1.81%
- F500 in state
- 4
Industry mix (Fortune 500 HQ in KY)
| Industry | F500 HQs | Revenue |
|---|---|---|
| Healthcare | 1 | $118B |
|
||
| Food / Beverage | 1 | $7B |
|
||
Property tax history
-4.9%/yrLatest (2025): $140 · -19.7% YoY. Source: county tax records.
Cash-flow waterfall
monthlySold comps — $/sqft
last 12 mo · ≤1 miLoading sold comps…