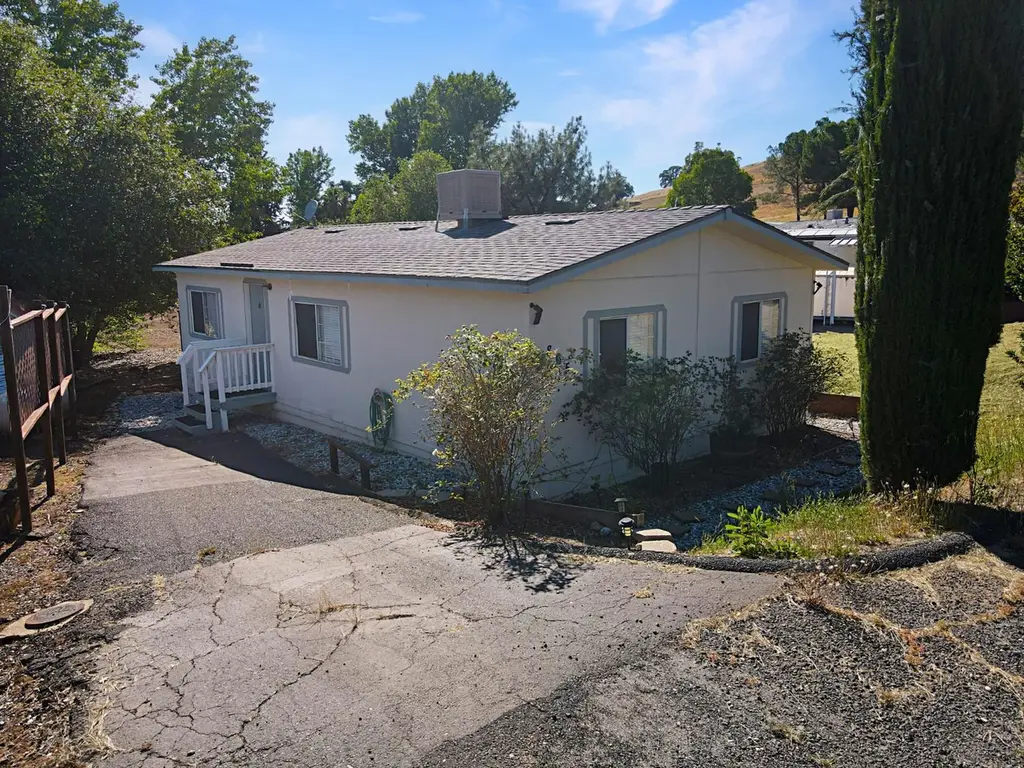
865 Sequoia Cir · Copperopolis, CA
Flood risk 1/10 · Minimal
- FEMA flood zone
- X (unshaded)
- Chance of flooding over 30 yrs
- 0.0%
- Est. flood insurance / yr
- $507 – $1,088
Fire risk 9/10 · Severe
- Est. fire insurance / yr
- $659 – $1,223
Heat risk 7/10 · Major
- Hot days now (above 103°F)
- 7 days/yr
- Hot days in 30 yrs
- 16 days/yr
Wind risk 1/10 · Minimal
- Chance of severe wind over 30 yrs
- —
Air-quality risk 10/10 · Severe
- Unhealthy air days now
- 30 days/yr
- Unhealthy air days in 30 yrs
- 35 days/yr
Risk factors via First Street. Map © Google.
Why this score? — see what drove the C- grade
The composite is a weighted blend of 9 inputs, each scored 0–100. Each bar is that input's sub-score; the figure is the points it added to the 100-point composite (weight × sub-score).
- Cash flow +21.4/30.0
- ARV discount +7.5/15.0
- DSCR +6.8/10.0
- 1% rule +5.3/10.0
- Schools +4.5/10.0
- Livability +2.9/5.0
- Rent growth +2.5/5.0
- Condition / age +2.5/5.0
- Appreciation +0.0/10.0
$225,000
🖨 Deal sheet 📄 Offer letter ✓ Due diligence
Listing remarks
Discover 865 Sequoia Cir, Copperopolis, CA, a ready-to-move-in home designed for comfortable living without space rent!! Enter into a bright livingroom open to the kitchen. The large updated kitchen features vinyl flooring, updated cabinetry, solid surface counter tops and stainless steel appliances. The spacious primary bedroom offers the convenience of sliding glass door access to the back deck. The ensuite primary bathroom complete with a soaking tub and walk in closet. Two guest bedrooms and guest bath. The Copper Cove HOA offers an array of amenities including a refreshing pool, 7 acre park including a playground , and a basketball court . Additionally access to Lake Tulloch through K
Key facts
- Soaking tub
- Updated kitchen
- Walk in closet
Tags
Property features AI
Finance
- HOA & community: Mandatory association; Monthly HOA fee; HOA amenities include playground, pool, clubhouse, recreation facilities, exercise room, game court, lake and park
Exterior
- Parking: No garage
- Utilities: Public water; Public sewer; DSL available; Underground utilities; Leased propane tank
- Home design: Manufactured detached home; Single-story
- Construction: Built in 1992; Composition roof; Detached property
- Exterior features: Low-maintenance lot; No fencing; No private pool or spa
Interior
- Kitchen: Free-standing gas range; Dishwasher; Disposal; Microwave; Laminate counters
- Bedrooms: 3 bedrooms (includes master bedroom)
- Flooring: Carpet; Vinyl
- Bathrooms: 2 full bathrooms; Master bath with soaking tub and tub/shower; Additional baths with tub/shower
- Heating & cooling: Central heating; Propane heating; Ceiling fans; Evaporative cooler
- Interior features: Cathedral/vaulted living room; Great room; Back porch; Dual pane windows with coverings; Updated/remodeled condition; Pets allowed
- Laundry & utility: Laundry inside with cabinets; 220V outlet in laundry
Neighborhood map
What this means for you Summary
Snapshot
- This is a 3-bed/2.0-bath manufactured listed at $225k.
Deal economics
- At list price, monthly cash flow is $334 ($4k/yr) — positive.
- The deal already cash-flows at list — no discount required.
- Meets the 1% rule at list price ($2k rent vs $225k).
- Recommended offer: $222k (1.5% below list) — sets the bar for market timing.
- Cap rate 8.1% vs local median 2.0% in Copperopolis — top-decile yield for the area; either an underpriced asset or a hidden risk that comps aren't pricing in. Stress-test before assuming the spread holds.
Location & tenants
- Location reads 58/100 on livability (#691 in CA) — a working-class tenant base; expect higher turnover. Strengths: housing A+, employment A-, crime B+; Watch: schools D+, amenities F, commute F.
- Bret Harte Union High (town): math 35% / reading 65% proficiency, ranked #429 of 1,400 in CA (top 31%) — acceptable for families but not a draw, mixed tenant base, ~2y average lease.
- Market conditions: 235 active listings in the ZIP; 77 units permitted in Calaveras County in 2024 (0 in 5+ unit buildings).
Forward outlook
- Local home prices are declining (-3.0%/yr); year-one equity from $2k of loan paydown is wiped out by about $7k of value loss. Plan a longer hold.
- Calaveras County population projected at -18% by 2050 — secular population decline; favor cash flow + early exit over multi-decade hold.
Negotiation context
- It's been on market 27 days — a 2% lower offer ($222k) is reasonable based on typical stale-listing flexibility.
Risks & watch-outs
- Climate carrying-cost: severe wildfire risk; extreme-heat days projected 7→16/yr by 2055 (HVAC capex compounding) — expect insurance premiums to compound above CPI over the hold.
Questions for the listing agent
- What does the HOA fee cover, when was the last increase, and are there any pending special assessments or reserve-fund shortfalls?
- Is there a deadline driving the sale (1031 exchange, divorce, estate, relocation)? That informs how much negotiation room exists.
- Schools are D-rated, which usually means shorter tenancies and higher turnover. Who's the typical renter profile here, and what's been the actual vacancy rate?
- What's the average days-on-market for RENTAL listings here right now (not sales)? A rising rental-DOM trend means longer vacancies and softer asking-rent achievability than the comps imply.
- What's the recent tenant-quality profile in this submarket — average credit score on applications, eviction rate, late-payment / NSF rate, and stable-employment percentage? A property-management company in the area should have these aggregated.
- How much new for-sale + rental construction is in the pipeline within 1–3 miles? Heavy new supply typically softens prices + rents 12–24 months out; constrained supply supports both.
Investment metrics
- 1% rule
- 1.03% ✓
- Cap rate
- 8.07%
- Cash-on-cash
- 6.35%
- DSCR
- 1.28
- GRM
- 8.1
CMA / ARV
- ARV (on-the-fly)
- $140,160
- Comps found
- 3
Show comp detail 3 sales within ~0.75 mi
| Address | Dist | Beds/Ba | Sqft | Sold | Price | $/sf | Match |
|---|---|---|---|---|---|---|---|
| 923 Morado Cir | 0.13mi | 3/2.0 | 960 (0%) | 7mo | $141,500 | $147 | 88 |
| 976 Morado Cir | 0.09mi | 3/2.0 | 1,020 (+6%) | 5mo | $149,000 | $146 | 81 |
| 954 Morado Cir | 0.12mi | 2/2.0 (-1) | 1,050 (+9%) | 9mo | $137,500 | $131 | 66 |
Match score weights: distance 35% · size 25% · config 20% · recency 20%. Top-matched comps best support the ARV.
Projected returns pro-forma
-3.0% appreciation · 3.0% rent growth · sell at horizon
- IRR
- -6.5%
- Equity multiple
- 0.76×
- Total profit
- $-15,217
- Equity at exit
- $33,548
- IRR
- 3.1%
- Equity multiple
- 1.22×
- Total profit
- $14,090
- Equity at exit
- $19,454
Cash invested: $63,000 (down + closing). Projections, not guarantees.
Landlord ↔ Tenant lean methodology
- Overall (STATE)
- 18 Strongly Tenant-Friendly
- State California
- 18 Strongly Tenant-Friendly · D+13
- County
- — inherits STATE
- City
- — inherits STATE
ZIP-level market 95228
- Active inventory
- 235
- Price-to-rent
- 8.1×
Monthly cashflow live
- Estimated rent
- $2,309 medium interval (Pro) →
- Mortgage (P&I)
- −$1,180
- Tax from tax record
- −$165 /mo · $1,980/yr
- Insurance
- −$94
- HOA
- −$52
- Vacancy / Maint / Mgmt
- −$485
- Net cashflow
- $334
Break-even live
Sensitivity live
| Price | -10% $461 | -5% $397 | +0% $334 | +5% $270 | +10% $206 |
|---|---|---|---|---|---|
| Rent | -10% $151 | -5% $242 | +0% $334 | +5% $425 | +10% $516 |
| Rate | -1.0pp $447 | -0.5pp $391 | base $334 | +0.5pp $275 | +1.0pp $216 |
UW: 25.0% down · 7.5% · 30yr · 1.5% tax · 5.0% vac · 8.0% maint · 8.0% mgmt
Financing live
Cash to close
- Down payment
- $56,250
- Closing costs
- $6,750
- Reserves months
- —
- Total cash needed
- —
Loan-product check · same deal, 3 products live
Conventional
25% down · 7.5% · 30yr
- Down + closing
- —
- Monthly P&I
- —
- Monthly cashflow
- —
- DSCR
- —
- Eligible?
- —
Personal DTI + credit; lowest rate.
DSCR
20% down · 8.5% · 30yr
- Down + closing
- —
- Monthly P&I
- —
- Monthly cashflow
- —
- DSCR
- —
- Eligible?
- —
No personal income docs; deal must DSCR.
Hard money
10% down · 12.0% · 12mo
- Down + closing
- —
- Monthly P&I
- —
- Monthly cashflow
- —
- DSCR
- —
- Eligible?
- —
Short-term bridge; refi at stabilization.
HOA detail
- Monthly dues
- $52 · $624/yr
- Likely covers
- pool
Listing history 16 events
-
2026-06-18days on market $225,000 Active 27 DOM
-
2026-06-17days on market $225,000 Active 26 DOM
-
2026-06-16days on market $225,000 Active 25 DOM
-
2026-06-15days on market $225,000 Active 24 DOM
-
2026-06-14days on market $225,000 Active 22 DOM
-
2026-06-10days on market $225,000 Active 19 DOM
-
2026-06-09days on market $225,000 Active 18 DOM
-
2026-06-08days on market $225,000 Active 17 DOM
-
2026-06-07days on market $225,000 Active 16 DOM
-
2026-06-05days on market $225,000 Active 13 DOM
-
2026-06-03days on market $225,000 Active 12 DOM
-
2026-06-02days on market $225,000 Active 11 DOM
-
2026-06-01days on market $225,000 Active 10 DOM
-
2026-05-31days on market $225,000 Active 9 DOM
-
2026-05-30days on market $225,000 Active 8 DOM
-
2024-10-18soldstatus $205,000
ⓘ Source: listings_history table (triggers on properties + properties_extension) + one-shot
backfill from property_details.listing_events for pre-trigger history.
Tax reassessment forecast CA · Resets to sale price
- Current annual tax
- $1,980 · $165/mo
- Projected year-2 tax
- $1,980 · $165/mo
- Expected delta
- $0/yr ($0/mo · 0.0%)
ⓘ Screening estimate from a state-policy table — verify with the county assessor before closing.
Climate risk First Street
- Flood 1/10 Low FEMA zone X (unshaded) · 0% chance over 30 yrs
- Wildfire 9/10 Extreme
- Heat 7/10 Severe 7 d/yr ≥103°F today · 16 d/yr by 30 yrs out
- Wind 1/10 Low
- Air quality 10/10 Extreme 30 unhealthy d/yr today · 35 by 30 yrs out
Nearby sold comps map
Loading sold comps map…
Walkable amenities ~0.75 mi
Loading nearby amenities…
Taxation est. · year 1
- Rental income
- $27,711
- − Mortgage interest
- −$12,603
- − Property taxes
- −$1,980
- − Insurance
- −$1,125
- − Repairs & maintenance
- −$2,217
- − Management
- −$2,217
- − HOA
- −$624
- − Depreciation
- −$6,545
- Taxable income
- $399
- Est. tax owed @ 24.0%
- −$96
- After-tax cash flow
- $3,907/yr
For passive investors: Depreciation is non-cash, so a rental often shows a tax loss while cash-flowing — sheltering income. Rental losses are passive: they offset passive income freely, and up to $25,000/yr can offset ordinary (W-2) income if you actively participate and your MAGI is under $100k (phasing out to $0 by $150k); unused losses carry forward. On sale, claimed depreciation is recaptured at up to 25%, and gains may owe capital-gains tax (a 1031 exchange can defer both). Figures are a year-1 estimate at your 24.0% rate — not tax advice; consult a CPA.
Schools (NCES district)
- District
- Bret Harte Union High
- NCES district ID
- 0605940
- Math proficiency
- 35% ▲ 5.00%
- Reading proficiency
- 65% ▲ 5.00%
- Median HH income
- $56,974
- Composite
- 45.41/100
- National rank
- #5708
- State rank
- #429 of 1400 in CA
Livability — Copperopolis
- Score
- 58/100
- State rank
- #691
- US rank
- #21010
Category grades
Schools grade is shown separately in the Schools card above.
Census & demographics
- Census place
- Copperopolis, CA
- Population (ZIP)
- 4,880
Population outlook (Calaveras County) Hauer SSP2
- Today (2025)
- 43,163 people
- By 2030
- 41,703 · -3.4%
- By 2040
- 38,202 · -11.5%
- By 2050
- 35,385 · -18.0%
- By 2075
- 30,807 · -28.6%
- By 2100
- 25,755 · -40.3%
Race, ethnicity, and origin ACS 2023
- Neighborhood character
- Predominantly White (71%)
- Race & ethnicity
- White 71% Hispanic / Latino 25% Two or more races 15% Black 2%
- Hispanic origin (detail)
- Mexican 21%
- Common ancestry
- Iranian 4% Romanian 4% Russian 3%
- Foreign-born
- 3% · Canada
- Languages at home
- 91% English-only · Spanish 9% Tagalog/Filipino 1%
Political lean MEDSL · Calaveras
- 2024 margin
- Strong R (+28.1) · D 34.7% · R 62.8% · Other 2.5%
- 2008→2024 swing
- -15.2pp toward R · 2008: -13.0pp · 2024: -28.1pp
- All cycles
- 2024: R+28.1 2020: R+23.8 2016: R+23.9 2012: R+17.0 2008: R+13.0
Not yet ingested
- Civics
- —
Market trends
- HPI YoY
- ▼ -141.73%
- Current HPI
- 176.1251
- Rent YoY
- —
- Metro
- —
- State GDP YoY
- ▲ 3.21%
- F500 in state
- 116
Industry mix (Fortune 500 HQ in CA)
| Industry | F500 HQs | Revenue |
|---|---|---|
| Technology | 27 | $1,492B |
|
||
| Financial Services | 3 | $174B |
|
||
| Retail | 3 | $44B |
|
||
| Insurance | 3 | $26B |
|
||
| Media / Entertainment | 2 | $115B |
|
||
| Pharmaceuticals / Biotech | 2 | $62B |
|
||
Price history
1 event — show timeline
- 2024-10-18 Sold (Public Records) $205,000 Public Records
Property tax history
+7.0%/yrLatest (2025): $1,980 · +54.0% YoY. Source: county tax records.
Cash-flow waterfall
monthlySold comps — $/sqft
last 12 mo · ≤1 miLoading sold comps…